
Crypto World
XRP Faces 40% Decline vs Bitcoin Despite 9-Day ETF Inflow Streak
XRP has fallen about 5% against Bitcoin over the past week, reinforcing a technical setup that could tilt toward more downside unless buyers step in. The weekly chart shows XRP/BTC trading within a descending triangle that has now triggered a breakdown signal, underscoring a risk-weighted outlook for the pair.
The pattern’s implications point to a downside target near 0.000011 BTC, roughly 40% below current levels, calculated by measuring the triangle’s height and projecting it from the breakout point. Yet momentum metrics offer a possible counterpoint: the RSI sits at 33, a level associated with oversold conditions that have foreshadowed macro bottoms for the pair in the past. That dynamic leaves open the possibility of a near-term pause or reversal if buying interest returns.
Key takeaways
- XRP/BTC’s weekly descending-triangle breakdown targets about 0.000011 BTC, roughly 40% lower from current prices.
- RSI at 33 suggests oversold conditions that could precede a base formation or a pause in the slide.
- Institutional demand for XRP exposure is resurfacing, with US spot XRP ETFs seeing persistent inflows and rising assets under management.
- SoSoValue data show a nine-day streak of inflows totaling about $73.78 million, with cumulative inflows near $1.28 billion and AUM around $1.1 billion.
Technical picture: XRP/BTC pattern unfolds
The XRP/BTC pair has been consolidating within a descending triangle on the weekly timeframe since late 2024. A classic pattern in technical analysis, the descending triangle is typically considered bearish when the price breaks below the lower trend line. The break occurred as XRP/BTC closed beneath the 0.000096 BTC support, catalyzing the measured downside target around 0.000011 BTC. Traders watching these levels note that a failed defense of the near-term support—around 0.000091 BTC—could accelerate losses for both the XRP/BTC pair and XRP/USD.
Despite the bearish setup, the RSI’s current position in the low-30s has historically preceded macro bottoms for the XRP/BTC ratio, suggesting the possibility of a bottom before a meaningful recovery. If the pattern holds and selling pressure intensifies, the next leg could test additional support before any sustained rebound.
Institutional demand reemerges for XRP exposure
Separately, demand from institutional investors for XRP-linked products appears to be reviving. SoSoValue data show US-based spot XRP ETFs attracting $3.89 million in net inflows on Thursday, marking nine consecutive days of inflows and lifting the nine-day total to about $73.78 million. Cumulatively, inflows have neared $1.28 billion, with assets under management standing at roughly $1.1 billion.
Analysts have framed the ETF activity as a sign of growing institutional interest in XRP, even as the spot price remains soft. Don Digital Finance commented that the inflows indicate “steady institutional demand as accumulation continues despite sideways price action.” Fellow analyst Ledger Man suggested the development could signal a broader uptick in confidence around XRP, noting that rising exposure could eventually support a price recovery if demand persists.
Analyst ChartNerd cautioned that a break below the 0.000091 BTC level could accelerate declines in XRP/BTC and XRP/USD, highlighting the sensitivity of the situation to key support zones even as ETF flows suggest a longer-term structural interest from institutions.
Looking ahead, traders will be watching how the ETF inflow momentum interacts with the technical pattern on XRP/BTC. If inflows stay robust and risk appetite broadens, the potential for a counter-move higher could emerge, particularly if macro conditions remain supportive for crypto assets and if institutions continue to add XRP exposure during periods of price consolidation.
Readers should monitor the next few weekly closes for XRP/BTC and track whether ETF inflows maintain their pace, as those signals will help clarify whether the current setup is a setup for further downside or the seed of a broader rebound.

Crypto World
XRP (XRP) Price Analysis: Whales Drive 94% of Exchange Outflows Amid Institutional Accumulation

Key Highlights
- Large holders account for 94.4% of XRP withdrawals from Binance, signaling concentrated accumulation
- Spot cumulative volume delta increased by $310 million amid persistent futures market selling
- XRP maintains position above critical support zones between $1.39 and $1.43 with RSI at neutral 53%
- Farmers & Merchants Investments revealed Bitwise XRP ETF position through SEC disclosure
- Technical analyst Ali Martinez forecasts possible 10% surge toward $1.58 level
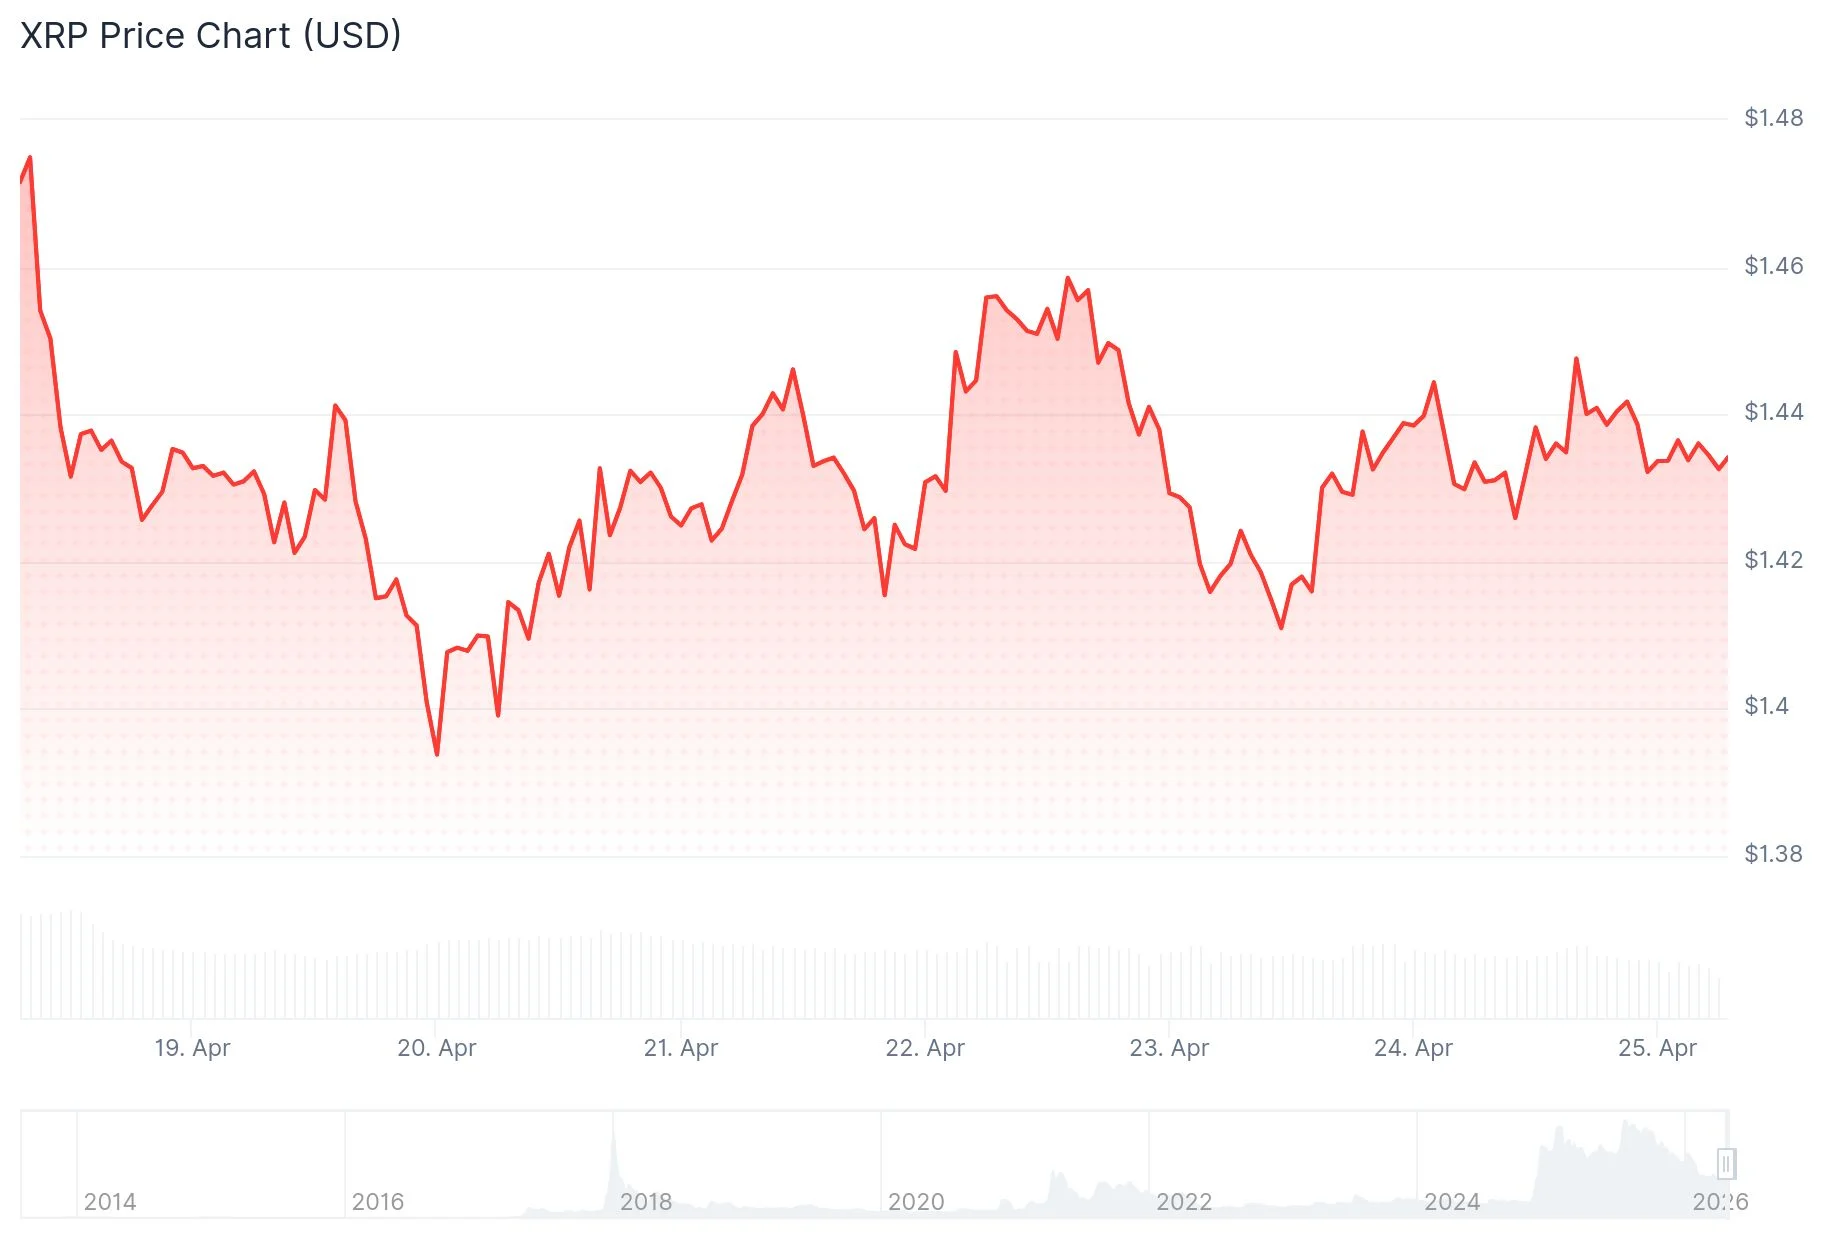
XRP is currently hovering around $1.43 as multiple data streams indicate intensifying accumulation among major holders. Despite shedding more than 20% of its value year-to-date in 2025, both blockchain metrics and market analysts signal a potential trend reversal.
Large-scale transactions on Binance represented 94.4% of total withdrawals on April 24, based on analysis from CryptoQuant’s Amr Taha. Retail participation fell to a mere 5.5% during the same timeframe.
The XRP Ledger registered 34.94 million XRP tokens moving off exchanges that day. Data from Santiment positioned this as the sixth-highest single-day withdrawal volume recorded in 2025.
Historical patterns suggest such withdrawal surges often precede upward price movements. Following a comparable whale activity spike in October of the previous year, XRP experienced a remarkable 525% rally. Another notable increase in June 2025 led to a subsequent 71% price appreciation.
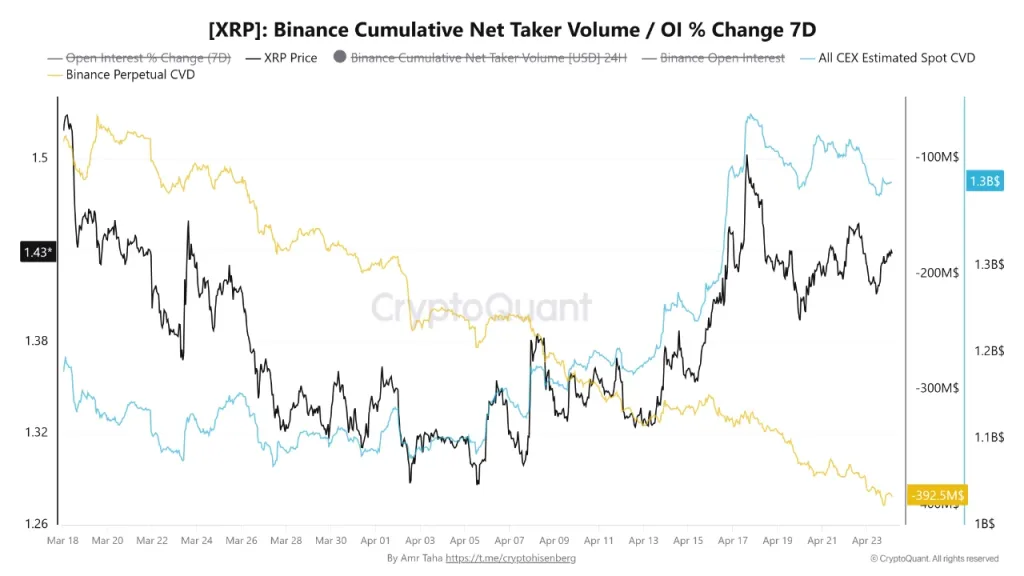
The spot cumulative volume delta for XRP—which tracks genuine buying pressure—climbed from $1.08 billion to $1.39 billion, representing a $310 million increase over recent weeks. Simultaneously, Binance perpetual futures CVD declined to -$392 million, indicating futures market participants maintain net short positions.
Price Action and Technical Framework
XRP is currently positioned above its 200-day exponential moving average at $1.39. The 50-day EMA rests at $1.42, while the 20-day EMA stands at $1.43, establishing multiple nearby support layers.
The Relative Strength Index reads 53%, indicating neither overbought nor oversold conditions. The MACD indicator demonstrates diminishing downward momentum, pointing to potential trend stabilization.
Fibonacci-based resistance targets are identified at $1.45 and $1.49. Support structure remains intact within the $1.42 to $1.39 corridor.
Long position liquidations have dominated since April 18, effectively reducing market leverage and tempering excessive bullish speculation. This deleveraging has contributed to improved funding rate conditions.
Crypto analyst Ali Martinez shared technical analysis on April 24 highlighting a symmetrical triangle formation on XRP’s hourly timeframe. His projection suggests a potential 10% advance from present levels, targeting approximately $1.58 upon breakout confirmation.
Growing Institutional Participation
Farmers & Merchants Investments, a banking institution managing $3.6 billion in assets under management, reported holdings in the Bitwise XRP ETF through recent SEC documentation. The institution’s position comprises 2,374 shares with an approximate valuation of $35,681.
The same firm maintains positions in BlackRock’s Bitcoin ETF product. Goldman Sachs currently leads institutional XRP ETF ownership with holdings exceeding $152 million.
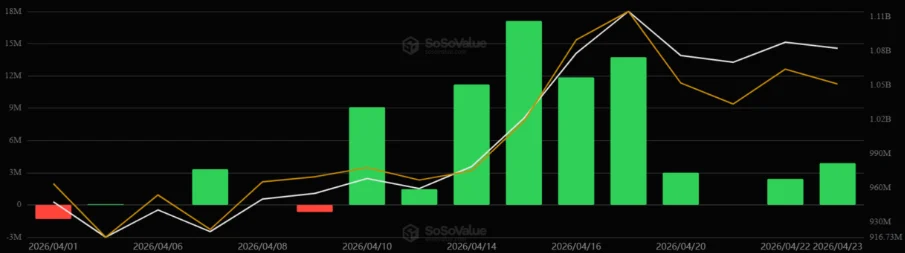
Spot XRP exchange-traded funds registered net inflows totaling $3.89 million on Thursday, pushing aggregate inflows to $1.28 billion. Combined assets under management across all XRP ETF vehicles have reached $1.08 billion, per SoSoValue tracking.
XRP achieved its all-time peak of $3.65 on July 18, 2025. Current trading stands at $1.44, with today’s price range spanning $1.41 to $1.44.


TLDR:
- Grayscale staked 102,400 ETH worth $237M via 32 transactions, bringing its net staking rewards to nearly $38 million.
- Bitmine now holds 3.7 million staked ETH worth $8.58 billion, representing 74% of its total Ethereum holdings.
- Grayscale’s Ethereum Mini ETF ranked first among US ETP providers in Q1 2026, recording $337 million in net inflows.
- Nearly 39 million ETH is locked in staking contracts network-wide, removing close to one-third of all ETH from circulation.
Ethereum staking activity has surged, with Grayscale Investments and Bitmine collectively committing close to $500 million within 24 hours.
On-chain data from Arkham Intelligence confirmed both transactions. Grayscale deposited 102,400 ETH worth roughly $237 million through Coinbase Prime.
Bitmine followed with an additional 112,040 ETH valued at about $259.6 million. Both firms now rank among the most active institutional Ethereum stakers globally. This activity reflects growing institutional confidence in ETH’s staking infrastructure and long-term utility.
Grayscale Builds ETH Staking Position Across Its Products
Grayscale executed its latest staking deposit through 32 separate transactions. Funds moved from its Ethereum Trust wallet directly to Coinbase Prime.
The asset manager first activated Ethereum staking for its products in October 2025. Since then, it has accumulated nearly $38 million in net staking rewards.
The firm operates two staking-focused Ethereum products in the US market. These are the Grayscale Ethereum Staking ETF (ETHE) and the Mini ETF (ETH).
Combined assets under management for both products reached $4 billion as of April 24. Steady inflows have driven that growth since staking capabilities launched.
Grayscale CEO Peter Mintzberg shared performance figures for the first quarter of 2026. He noted that the Mini ETF ranked first among all US ETP providers.
The fund pulled in $337 million in net inflows during that period alone. Mintzberg also pointed to Ethereum’s record-breaking 200 million-plus on-chain transactions for Q1.
In a public post, Mintzberg wrote that Ethereum recorded its busiest quarter ever on-chain. He cited $180 billion in stablecoin activity and the expansion of programmable finance infrastructure.
Real usage is growing, and staking aligns with that fundamental investment thesis. Grayscale views staking as a core pillar of its Ethereum product strategy.
Bitmine Leads the Race as the Largest Corporate Ethereum Staker
Bitmine Immersion Technologies now holds the top position among corporate Ethereum stakers. The firm disclosed this week that its staked ETH had reached 3.3 million units.
That amount represented 67% of its total Ethereum holdings at the time. No other corporate entity currently matches Bitmine’s scale of ETH staking.
The firm expanded its staked position further on Friday. Lookonchain reported that Bitmine staked an additional 112,040 ETH on that day.
After the deposit, total staked ETH climbed to 3.7 million units. That now equals approximately 74% of Bitmine’s overall ETH holdings.
The on-chain tracker noted that Bitmine’s cumulative staked ETH is worth $8.58 billion. Tom Lee’s firm has built what amounts to a yield-driven ETH treasury strategy.
Each additional stake reinforces its position as a dominant institutional holder. The firm’s approach is drawing attention from other corporate entities watching the ETH markets.
Across the broader Ethereum network, roughly 39 million ETH is currently locked in staking contracts. That is close to one-third of all Ethereum in existence.
Removing this supply from the open market reduces available trading liquidity. Additional institutional staking further tightens the available ETH supply pool over time.
Quick Summary
- A rare MACD crossover on Solana’s weekly timeframe has triggered a buy signal, historically followed by rallies ranging from 100% to 860%
- The Relative Strength Index has bounced back to 35 from a low of 25 recorded in mid-February, mirroring conditions at the 2022 market bottom
- Technical analysis reveals a symmetrical triangle formation suggesting a potential move to $130 upon breakout confirmation
- Critical resistance zone between $90 and $96 contains approximately 9.9 million SOL tokens with average acquisition prices of $90-$92
- Technical analyst Ali Charts identified a Bollinger Band compression on the 3-day timeframe, designating the $77-$94 range as a cautionary zone
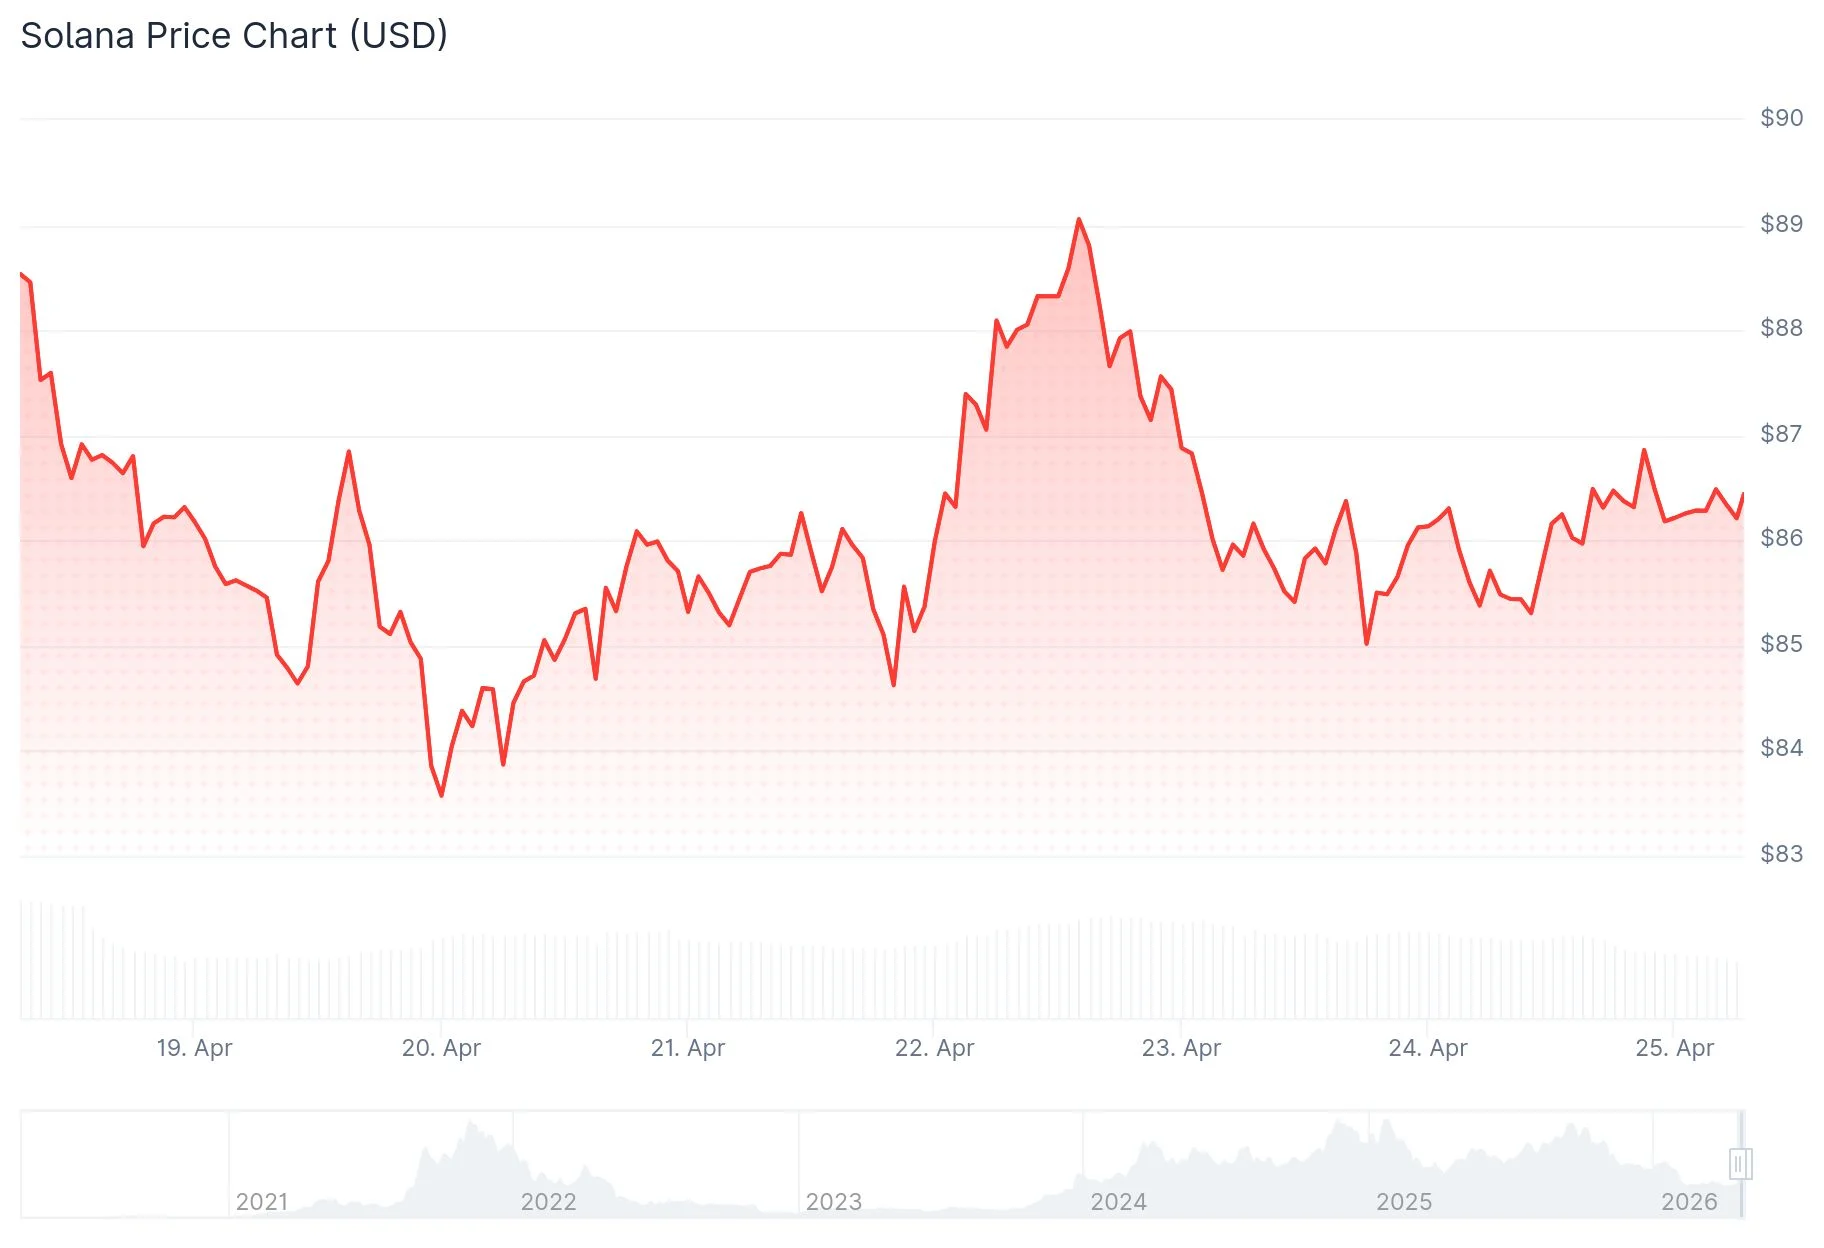
A significant technical development has emerged on Solana’s (SOL) weekly chart as a MACD buy signal appears — an indicator that has historically preceded substantial price rallies. The digital asset is currently changing hands near $85-$86 following a retreat from its weekly peak of $89.

The Moving Average Convergence Divergence line has crossed above its signal line on the weekly timeframe. This identical crossover pattern emerged in May 2025, preceding a rally that propelled SOL from approximately $125 to beyond $250 — representing a gain of nearly 100%.
Previous occurrences of this technical signal preceded even more dramatic rallies, including an 860% surge in 2023 and a 617% advance in 2021.
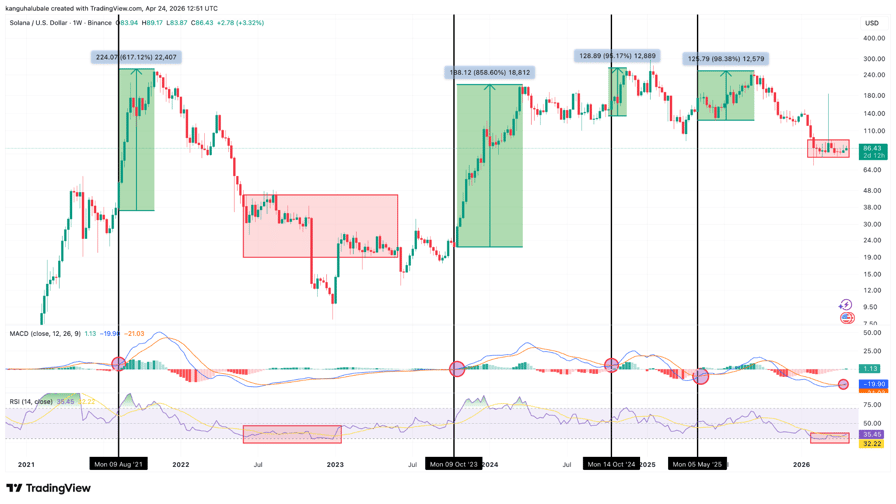
Solana’s weekly Relative Strength Index has also rebounded to 35 from its mid-February low of 25. This reading is particularly notable as it aligns with RSI levels observed during Solana’s 2022 bear market capitulation, which subsequently led to an explosive 2,500% rally reaching $210 by March 2024.
Market analyst Tyler Hill highlighted that Solana’s RSI had declined below 35 for the first time in 1,200 days. According to Hill, the previous instance of such extreme readings marked the bear market floor and triggered a subsequent 3,000% price expansion.
Analyst Sixtysecondalpha emphasized that the MACD crossover occurred following its “lowest stretch ever.” When combined with bullish divergence on the RSI, they concluded that SOL is positioned for its “most powerful move” in the past two years.
Technical Pattern Suggests $130 Price Objective
Examining the daily chart reveals that SOL has developed a symmetrical triangle consolidation pattern. The critical breakout threshold is established at $90. Should price action confirm a daily close above this level, the pattern’s measured move projects a target of approximately $130, representing a potential 50% gain from current trading levels.
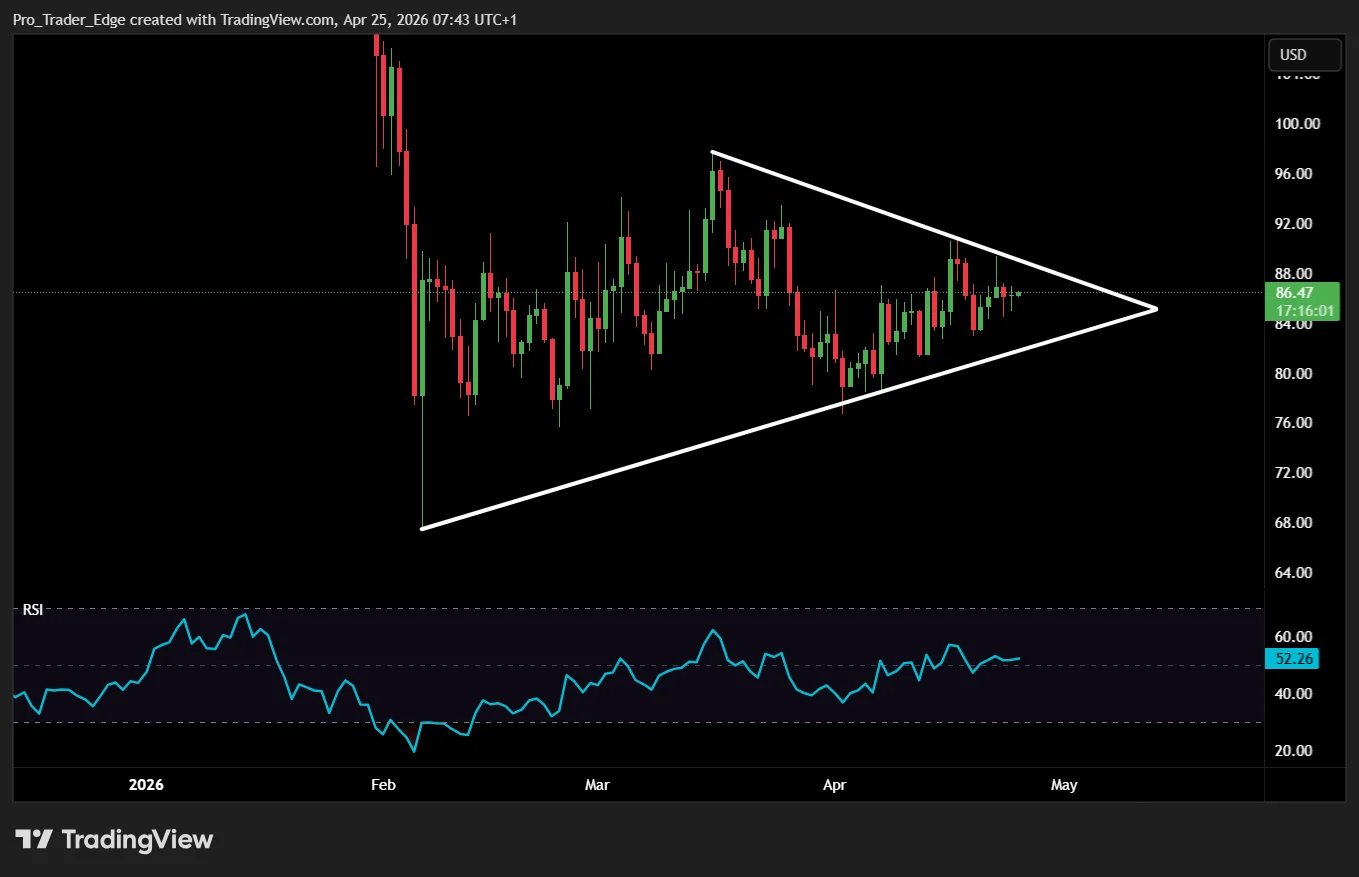
The daily RSI indicator has recovered to 52 from deeply oversold conditions of 11 registered on February 6, signaling a notable improvement in underlying momentum.
Critical Resistance Zone at $90 Poses Challenge
The $90-$96 price corridor represents a formidable obstacle for continued upside. Data from Glassnode reveals that approximately 9.9 million Solana tokens are currently held by market participants with an average entry price between $90 and $92. A substantial portion of these holders may look to exit positions at breakeven levels, potentially creating significant selling pressure that could impede upward momentum.
Additional technical resistance emerges from the convergence of 100-day moving averages within this same zone, reinforcing the challenge bulls face.
Technical analyst Ali Charts drew attention to a developing Bollinger Band squeeze on the 3-day chart, with price action compressed within the $77 to $94 corridor. Ali Charts characterized this range as a “no-trade zone” and recommended that traders wait for a decisive 3-day candle close beyond the bands before initiating positions.
Solana is presently maintaining support within the $85-$86 area as buyers continue efforts to recapture the crucial $90 threshold.

Key Highlights
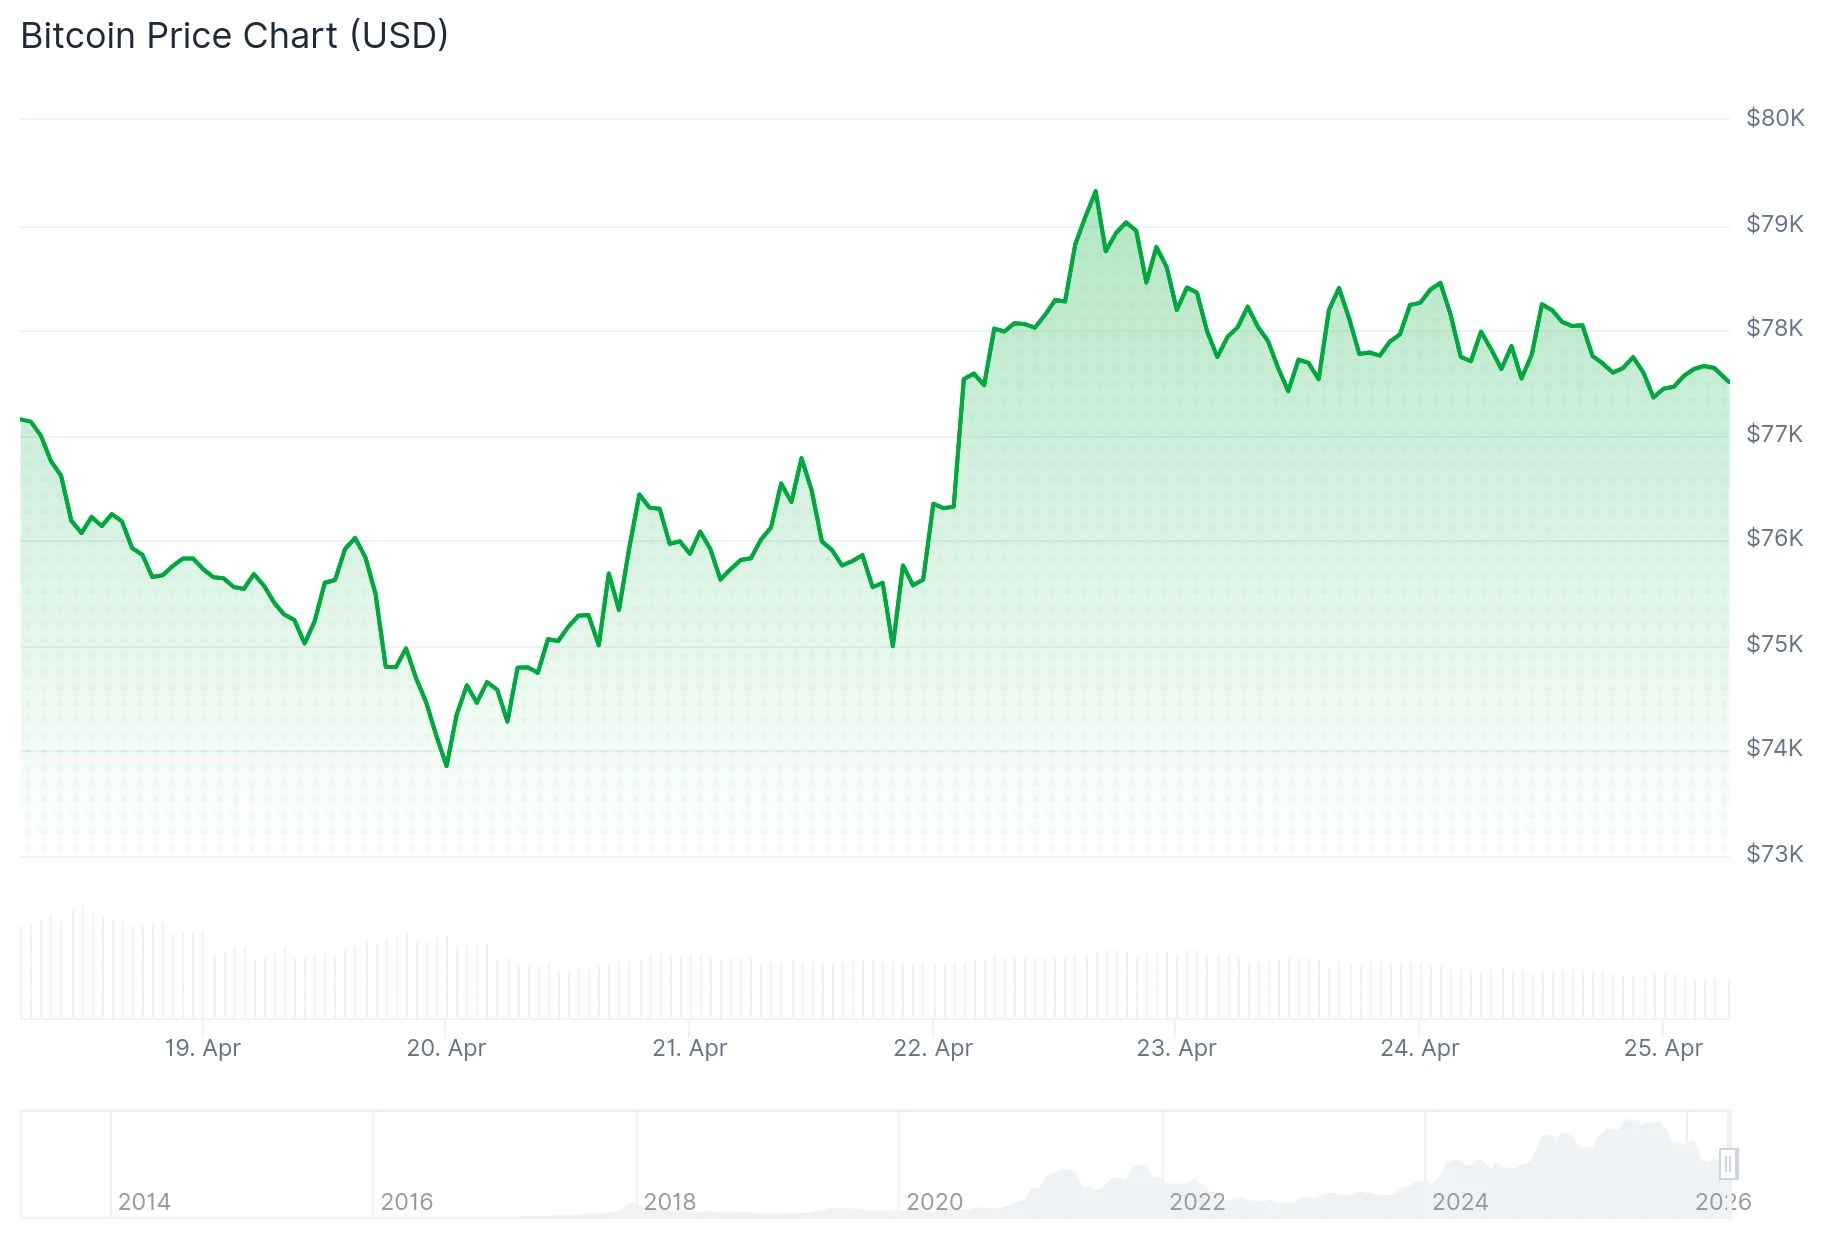
- Bitcoin has posted a 13.6% gain in April, marking its strongest monthly performance since last year
- Major holders with wallets containing 10–10,000 BTC have acquired approximately 41,000 BTC since mid-April
- Tether’s USDT market capitalization expanded to roughly $150 billion, growing by $5 billion within a two-week period
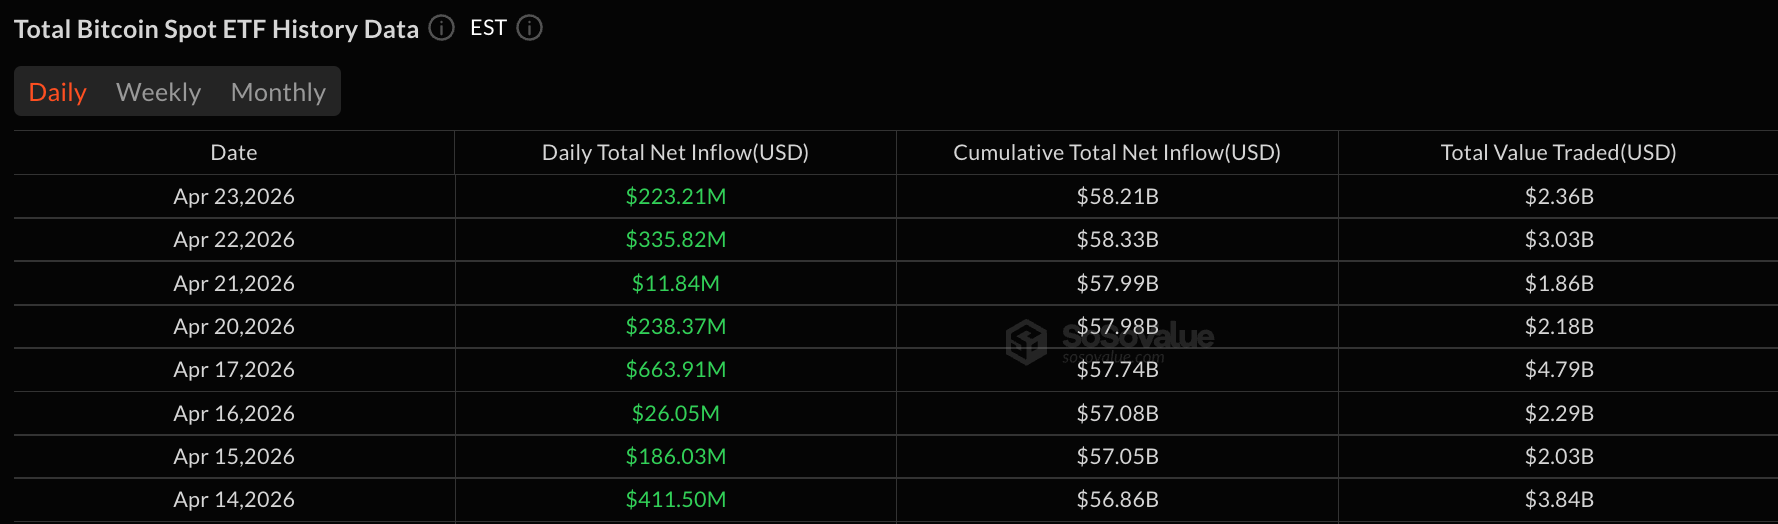
- Spot Bitcoin ETFs have recorded eight consecutive days of positive net flows, with $223 million added on April 23 alone, spearheaded by BlackRock’s IBIT
- Market participants are closely monitoring the $79,000 price level as critical resistance before the Federal Reserve’s upcoming policy decision
Bitcoin is experiencing its most impressive April performance in twelve months. The leading cryptocurrency reached an intraday peak of $79,327 on Wednesday before retracing to approximately $77,390. Month-to-date gains now stand at roughly 13.6%.
This rally represents a significant turnaround following a challenging period. Digital asset markets experienced their most prolonged downturn since 2018, suffering back-to-back monthly losses spanning from October through February.
A major catalyst behind the current rebound appears to be expanding stablecoin liquidity. The circulating supply of Tether’s USDT has climbed to nearly $150 billion, with approximately $5 billion added during the last fortnight. Market analysts typically interpret stablecoin supply expansion as an indicator of new capital flowing into cryptocurrency markets.
From a macroeconomic perspective, traditional U.S. equity markets have also rebounded strongly. Both the S&P 500 and Nasdaq have climbed back toward all-time highs following brief corrections into negative territory earlier this year.
Jasper de Maere, an OTC trader at Wintermute, observed that financial markets have essentially begun to ignore headlines surrounding Middle Eastern conflicts. He explained that robust corporate earnings reports are helping to counterbalance geopolitical tensions, although he cautioned about “a certain level of fatigue and potentially complacency” creeping into market sentiment.
Large Holder Accumulation Pattern Emerges
According to data from cryptocurrency sentiment analytics platform Santiment, Bitcoin addresses holding between 10 and 10,000 BTC have acquired 40,967 BTC starting from April 10, representing approximately $3.17 billion in value.
In a post shared on X, Santiment stated: “Bitcoin’s key stakeholders are accumulating rapidly.” The firm characterized this dynamic — where large holders purchase while smaller retail investors realize profits — as “one of the strongest signals for a long-term bull run.”
Meanwhile, smaller retail participants (holding less than 0.1 BTC) accumulated merely 46 BTC during the identical timeframe, valued at around $3.56 million.
Andre Dragosch, who serves as head of Europe research at Bitwise, also commented on X Friday: “Institutional demand for Bitcoin is clearly accelerating.”
Spot ETF Momentum Continues
Bitcoin spot exchange-traded funds registered $223 million in net positive flows on April 23, extending their winning streak to eight consecutive trading sessions. BlackRock’s IBIT product dominated with $167.49 million in inflows. Ark & 21Shares’ ARKB contributed an additional $71.22 million. Aggregate net assets across Bitcoin ETF products have now reached $102.79 billion.
Ethereum-focused ETFs, on the other hand, experienced their first day of outflows following a 10-day positive streak, recording net redemptions of $75.94 million.
Michael van de Poppe, founder of MN Trading Capital, indicated on Thursday that Bitcoin possesses “enough room” to advance toward the $86,000 level, though maintaining support above $75,000 will be essential for sustaining upward momentum.
The Crypto Fear & Greed Index registered a reading of 39 on Friday, remaining within “Fear” territory.
Adam Haeems, head of asset management at Tesseract Group, emphasized that the $79,000 price point “matters structurally because heavy institutional overhead supply sits just above it.” He suggested that sustained ETF inflows leading up to and through the Federal Reserve’s upcoming policy meeting could transform $79,000 from a resistance barrier into a support foundation.
The forthcoming Federal Reserve monetary policy meeting represents the primary near-term catalyst that market participants are monitoring most attentively.
TLDR:
- Ethereum trades near $2.3K, staying below the weekly 200 MA and EMA, with $2.4K acting as key resistance.
- CryptosRus reports the Ethereum Foundation sold 10,000 ETH OTC at $2,387, totaling about $23.9M to BitMine.
- OTC transaction signals institutional absorption of ETH liquidity, reducing immediate exchange-side selling pressure.
- Price remains in a broader downtrend, with support near $2.1K and resistance extending toward $2.8K–$3.5K zones.
Ethereum is trading near a critical technical zone after recovering from early 2026 lows, with price action pressing into major long-term resistance.
The asset remains below key weekly indicators, leaving traders focused on whether current momentum can sustain a broader trend shift.
Ethereum faces resistance at key weekly averages
Ethereum’s weekly structure shows price approaching a decisive resistance cluster after rebounding from recent lows. The current move places the asset just below long-term indicators that often define broader market direction.
A recent tweet from Daan Crypto Trades outlines this setup, noting that Ethereum is rejecting the bull market support band and weekly 200 averages. The post states that a close above the $2,400 to $2,500 range is required to regain bullish control.
At present, Ethereum trades near $2,309, still below the weekly 200 EMA around $2,459 and the 200 MA near $2,430. This area continues to act as a resistance cluster that limits upward movement.
The price structure reflects a strong rally into late 2024, followed by a rejection near the $4,600 level. Since then, Ethereum has remained within a broader downward structure, despite the recent recovery attempt.
The same zone previously acted as support during the earlier uptrend. Once the price broke below it, the level flipped into resistance, reinforcing the current barrier on higher timeframes.
Support Zones Hold as a Recovery Attempt Develops
Ethereum rebounded from a capitulation low near $1,790, where elevated selling volume marked a possible exhaustion phase. Following that move, price reclaimed the $2,100 to $2,165 support region.
A separate update from CryptosRus reported that the Ethereum Foundation completed a 10,000 ETH over-the-counter sale. The transaction was executed at an average price of $2,387, with BitMine listed as the buyer.
The deal represents roughly $23.9 million in Ethereum transferred through an institutional OTC channel. Such transactions often occur outside public exchanges, allowing large orders without immediate market disruption.
Following this, the price continues to trade within a recovery structure, gradually pushing toward the $2,300 range. Even so, the asset remains inside a broader downtrend on the weekly timeframe.
Support levels remain clearly defined. The $2,165 to $2,106 zone serves as the nearest support range, while the $2,030 to $1,790 region holds as macro support below.
On the upside, resistance levels continue to cap the price. The $2,815 to $2,851 zone has seen repeated rejections. Beyond that, the $3,300 to $3,500 range represents a prior support area that now acts as resistance.
Volume data shows a shift after the sharp decline. Selling pressure has eased, while gradual buying activity has emerged. This pattern aligns with early accumulation behavior, though confirmation remains limited.
Traders continue to monitor the $2,400 region closely. A move above this level could lead to a test of $2,850, while rejection may result in a return to lower support levels.
For now, Ethereum remains in a transition phase, with price reacting to long-term indicators ahead of the next directional move.

Succinct has introduced Zcam, an iPhone camera app designed to cryptographically sign photos and videos at the moment of capture, creating a verifiable link between the media and the device that produced it. The aim is to let viewers confirm that content has not been digitally altered or AI-generated, even as synthetic media becomes more prevalent.
According to Succinct, Zcam hashes the raw image data and signs the result with keys generated inside Apple’s Secure Enclave, a hardware-based security module. The resulting signature, along with capture metadata and attestation, is embedded into the file using the Coalition for Content Provenance and Authenticity (C2PA) standard, a framework for attaching tamper-evident provenance data to digital media.
How Zcam signs media at capture. Source: Succinct
Succinct notes that the process relies on a tamper-evident record that ties the media to the capture device, enabling readers to verify authenticity directly. The company’s blog explains that Zcam’s signing workflow is designed to deter manipulation and to establish a provable origin for each image or video file, leveraging existing hardware and open provenance standards.
The underlying concept is anchored in the Coalition for Content Provenance and Authenticity (C2PA) framework, which is described as an open technical standard that enables publishers, creators and consumers to establish the “origin and edits” of digital content. The standard allows metadata about how content was created, which tools were used, and how it changed over time to be attached to the media itself.
The move signals a broader push beyond traditional blockchain-based verifications, bringing cryptographic provenance tools closer to the point of creation. In an era where questions about AI-generated imagery and video content proliferate, having a cryptographic trail attached to media at capture could offer a complementary line of defense to post hoc AI-detection techniques.
Key takeaways
- Zcam signs media at capture by hashing raw data and using keys generated inside Apple’s Secure Enclave, then embeds the signature with metadata and attestation into the file.
- The signing and provenance data are embedded using the C2PA standard, which aims to provide a tamper-evident record of origin and edits directly within media files.
- Succinct positions Zcam as an early, practical step toward widespread cryptographic provenance, with potential use cases in journalism, insurance claims and identity verification.
- The project faces important caveats: the Zcam SDK is unaudited and not production-ready, and secure enclaves have faced past compromises, highlighting that a fully tamper-proof capture-to-signing chain remains an active area of research.
- Security researchers warn that AI-driven fraud and deepfakes could intensify crypto security threats in 2026, underscoring the value—and the limits—of provenance data as part of a layered defense.
Provenance at the source: how Zcam and C2PA fit into the crypto security landscape
At the heart of Zcam’s approach is a simple but increasingly consequential idea: trust in digital media should begin at creation. By hashing image data and sealing that hash with a device-bound key, Zcam intends to provide verifiable evidence that the media originated from the claimed device and was not altered after capture. The Secure Enclave, Apple’s isolated processing environment, is used to protect the signing keys and operations from tampering or extraction, while the C2PA metadata travels along with the media file, offering verifiers a practical provenance trail.
The C2PA standard itself is designed to be open and collaborative, with the goal of clarifying the origin and the evolution of content. It does not prescribe a single implementation but provides a framework for recording provenance data—such as capture tools, software versions, and subsequent edits—so that consumers and downstream systems can assess authenticity. For those assessing the technology, the formal description of C2PA clarifies that provenance data covers both the creation process and the edits it undergoes over time.
Succinct’s announcement positions Zcam as a reference point for a broader adoption of cryptographic provenance tools beyond the blockchain sphere. As media consumers increasingly encounter AI-generated content, having an auditable, tamper-evident record attached to files could help publishers and platforms respond to authenticity concerns in real time. That said, analysts caution that provenance data alone does not solve all risk vectors; it is one layer in an ecosystem that includes detection technologies, secure capture hardware, and robust verification workflows.
In assessing the security landscape, it’s worth noting that a recent briefing from CertiK—cited in coverage by Cointelegraph—suggests that deepfakes, phishing, and AI-assisted social engineering could fuel some of the largest crypto hacks in 2026. The report underscores the broader security stakes as attackers increasingly rely on convincing synthetic media to bypass human and automated defenses. Provenance tools like Zcam could help close gaps in trust, but their effectiveness will depend on end-to-end integration, independent audits, and continued advancements in tamper-resistant capture chains.
Limitations, next steps and what to watch
While Zcam represents a meaningful step toward “proveable” media, Succinct acknowledges it is still early in its evolution. The company notes that its software development kit (SDK) has not been audited and is not yet ready for production use. Moreover, even secure enclaves have vulnerabilities, and ensuring a fully tamper-proof capture-to-signing chain remains an active area of research and refinement. Real-world deployment will depend on broader ecosystem validation, independent security testing, and the development of reliable verification workflows for end users and platforms.
Nonetheless, the trajectory is clear: cryptographic provenance is moving from a theoretical construct into practical tools that can accompany content creation. If adopted widely, Zcam and similar approaches could reshape how publishers, advertisers, insurers and identity providers handle digital media—shifting the emphasis from post hoc detection to provenance-backed assurance at the moment of capture.
As the conversation around media trust evolves, watchers should monitor whether major manufacturers, media platforms and standards bodies embrace similar capture-time signing workflows, and whether independent audits verify the security and reliability of early implementations like Zcam. The next milestones will likely include formal audits of sign-then-verify workflows, expanded support within the C2PA ecosystem, and pilots across journalism and claim-verification use cases.
For readers and builders, the development signals a broader trend: trust in digital content may increasingly hinge on cryptographic proofs anchored at the moment of creation, not only on detection methods applied after publication. The coming months will reveal how quickly such provenance tools scale and how they coexist with other AI-authentication and anti-fraud measures.
Succinct’s Zcam approach is explained in more detail on the company’s blog: Introducing Zcam. For broader context on the provenance framework, see the Coalition for Content Provenance and Authenticity (C2PA) documentation, which describes how provenance data can be attached to media: C2PA content credentials. On the security frontier, CertiK’s analysis about AI-enabled threats is summarized in coverage linked to a Cointelegraph report: CertiK warning.
TLDR:
- Bitcoin sentiment flipped from fear to strong optimism within days as the price rebounded above $78.7K quickly.
- Santiment data shows rising FOMO levels, which often act as caution signals during key resistance tests.
- The $80K level remains a major barrier, with a breakout likely attracting new and returning traders.
- Elevated Bitcoin sentiment suggests crowded positioning, which can slow momentum or trigger short-term pullbacks.
Bitcoin sentiment shifted sharply this week as traders moved from fear to renewed optimism within days. Price action followed closely, with Bitcoin rebounding after a brief rejection and returning near a key resistance zone that continues to attract strong market attention.
Crowd behavior flips as Bitcoin sentiment rebounds
Bitcoin sentiment turned negative early in the week as prices faced rejection near $80,000. Traders reacted to downside pressure with caution, expecting further losses as fear spread across social platforms.
Santiment reported this shift, noting that market participants moved from pessimism on Monday to strong optimism by Thursday.
The firm shared that what looked like a breakdown instead became a recovery, with Bitcoin climbing above $78,700.
This rapid reversal reflects how Bitcoin sentiment often tracks price movements closely. When fear increases, selling pressure tends to peak. In contrast, renewed optimism tends to follow price recovery, drawing more traders back into the market.
The tweet also pointed out that rising optimism can act as a warning sign. As more traders enter with fear of missing out, markets may face short-term resistance or slower momentum. This pattern has appeared frequently during previous Bitcoin rallies.
At the same time, Bitcoin sentiment remains a useful indicator for tracking crowd behavior. Data from platforms like X, Reddit, and Telegram shows how quickly traders adjust expectations based on price action.
Resistance near $80K keeps traders focused
Bitcoin is once again testing the $80,000 level, a zone that has acted as resistance in recent sessions. The current price structure shows steady recovery, yet traders remain cautious as optimism builds.
Santiment noted that a breakout above this level could attract new and returning traders. However, such a move may require a calmer Bitcoin sentiment environment rather than peak excitement.
Markets often move against the majority expectation, especially during crowded trades. When Bitcoin sentiment becomes overly bullish, price action may slow or pullback before continuing higher.
Despite this, the broader trend still allows room for further upside. Price strength remains intact, and continued demand could support another attempt to break resistance. Traders are watching closely for confirmation through volume and sustained buying pressure.
Bitcoin sentiment plays a central role in this process. It helps identify whether current moves are driven by strong conviction or emotional reactions. As sentiment rises too quickly, markets tend to reset before continuing.
For now, Bitcoin remains near a decisive level. The coming sessions will determine whether the current optimism supports a breakout or leads to short-term consolidation. Bitcoin sentiment will likely remain a key factor shaping the next move.
TLDR:
- Bittensor investors want subnet performance, not just decentralized AI architecture strength
- TAO focus is shifting toward subnets targeting state-of-the-art AI model competition
- Investors want models that outperform GPT and Gemini in specific commercial sectors
- Stronger reasoning, coding, and creativity remain key tests for Bittensor subnet growth
Bittensor has investors pushing its subnet ecosystem toward direct competition with leading AI firms. The debate centers on whether decentralized AI can move beyond theory and challenge closed-source giants like OpenAI and Google DeepMind.
Market participants now want proof that Bittensor subnets can deliver top-tier models, not just promising architecture. The discussion gained momentum after crypto investor Lucky outlined what he sees as the next critical stage for TAO.
Bittensor Subnets Need More Than Strong Architecture
Lucky said Bittensor’s decentralized design remains one of the strongest structures in the sector. However, he argued that strong architecture alone does not create industry disruption.
He described the current phase as an era of potential rather than proven dominance. According to his post on X, subnets must now move beyond internal validation and focus on measurable performance.
That means building systems that outperform existing open-source limits. He pointed to the need for models that can set benchmarks instead of simply following them.
The challenge also extends to reasoning, coding, and creativity. He said decentralized compute must produce results that compete directly with the strongest closed-source systems.
OpenAI and Google DeepMind continue to dominate the broader AI market. For Bittensor, competing with those firms requires stronger execution from subnet builders.
The TAO ecosystem depends on subnets that can prove clear advantages in high-value domains. Without that shift, the network risks staying an experimental project rather than a mainstream AI force.
TAO Investors Search for State-of-the-Art AI Models
Lucky said his focus has now shifted toward identifying subnets targeting state-of-the-art performance. He said he is looking for teams building to surpass existing AI leaders.
His search centers on subnets aiming for SOTA results instead of simple replication. He noted that the goal is to support projects obsessed with outperforming the world’s most advanced models.
That includes teams using decentralized incentives to create stronger machine intelligence. He framed this as the key path for long-term capital allocation inside the TAO ecosystem.
The biggest turning point would come when a subnet beats GPT or Gemini in a specific commercial area. According to his post, that would permanently change how the market views decentralized AI.
Such a result would move Bittensor from an interesting concept to an unavoidable competitor. It would also strengthen the case for TAO as more than a crypto-native experiment.
Capital, he said, will likely follow the subnets that prove real-world superiority. For investors, performance now matters more than architectural ambition alone.
TLDR:
- XRP outflows reached 34.94 million tokens, marking one of the largest daily exchange withdrawals this year.
- Historical data shows XRP outflows often appear before upward price movement during accumulation phases.
- XRP is forming a multi-year base pattern, with Base 3 developing near key resistance levels.
- Price remains near an ascending trendline, with consolidation continuing as traders watch for breakout confirmation.
XRP is drawing renewed market attention as on-chain activity and long-term technical structure align. Recent exchange outflows and a repeating base formation pattern suggest that the asset may be approaching a key phase within its broader cycle.
XRP Outflows Show Accumulation Behavior
Recent data indicates that XRP recorded 34.94 million tokens in exchange outflows within a single day. This ranks as the sixth-largest outflow event recorded this year. Such movements often reflect investors shifting assets into private storage.
Santiment shared this update on X, stating that XRP Ledger saw 34.94 million XRP in exchange outflows. The firm noted this marked one of the largest daily outflows this year. It also stated that such XRP outflows have often appeared before upward price movement.
Exchange outflows usually reduce the available supply on trading platforms. When tokens move off exchanges, they are less likely to be sold quickly. This shift can support price stability during consolidation periods.
At present, XRP outflows are occurring while the price trades near a key resistance level. This overlap suggests that accumulation may still be active. Meanwhile, traders continue to monitor whether this trend will lead to stronger price action.
Multi-Year Base Pattern Points to Breakout Structure
A technical analysis shared by ChartNerd presents a multi-year base pattern forming on XRP’s long-term chart. The structure shows that XRP has completed two base phases and may now be entering a third.
This pattern follows a cycle of accumulation, breakout, and re-accumulation at higher levels. Similar formations were observed before earlier rallies, including the move seen in 2017. The structure reflects a gradual build-up in market strength.
Currently, XRP is trading near a long-standing resistance zone. This level has limited price movement in both past and recent cycles. At the same time, price is pulling back toward an ascending trendline that supports higher lows.
The current phase, referred to as Base 3, often forms before expansion. During this stage, price tends to consolidate within a tighter range. Short-term declines may occur as the market absorbs remaining supply.
Previous cycles show that breakouts followed periods of compression near resistance. If XRP maintains its trendline support, the structure may remain intact. However, a drop below this level could shift focus back to earlier accumulation zones.
For now, XRP outflows and the base pattern continue to guide market attention. Observers are tracking both signals closely as price action develops near critical levels.
TLDR:
- Brazil banned derivatives tied to sports, politics, gaming, and entertainment events from May 4
- Foreign prediction market contracts offered in Brazil also fall under the new derivatives restriction
- Only contracts linked to financial benchmarks like rates, prices, and indices remain allowed
- Securities regulators now hold broad authority over future event-based derivatives listings
Brazil moved to block prediction market contracts tied to sports, politics, and entertainment under a new derivatives market rule approved this week.
Moreover, the measure targets contracts linked to real-world and virtual events that regulators say do not reflect economic or financial benchmarks. It also applies to foreign derivatives offered inside Brazil, widening the reach of the restriction.
The new framework takes effect on May 4 and places enforcement duties on the Securities and Exchange Commission.
Brazil Prediction Market Ban Reshapes Derivatives Trading
The National Monetary Council approved Resolution No. 5,298 during its April 23 session. The Central Bank of Brazil published the measure on April 24.
Additionally, the resolution sets new rules for how derivatives markets must operate across the country. It places investor protection and market integrity at the center of the framework.
Under Article 3, firms cannot offer or trade derivative contracts linked to sporting events. This includes contracts tied to real sports competitions covered under Law No. 14,790 of 2023.
The ban also covers virtual online gaming events. That extends the rule to contracts tied to esports and similar digital competitions.
Political, electoral, social, cultural, and entertainment events also fall under the restriction. Regulators said these events do not qualify as proper economic or financial benchmarks.
The Securities and Exchange Commission can also classify other event-based contracts as prohibited. That gives regulators broad control over future listings.
Crypto Derivatives Rules Extend Beyond Domestic Markets
Article 4 expands the ban beyond Brazil-based platforms. It applies to foreign derivatives if they are offered within national territory.
That means offshore prediction market products could also face restrictions when targeting Brazilian users. Crypto-linked event contracts may fall under this scope depending on structure.
The resolution allows only contracts tied to recognized financial benchmarks. These include exchange rates, interest rates, bond indices, securities indices, and commodity prices.
Financial assets and securities traded on organized markets remain allowed. Other benchmarks must rely on consistent and verifiable pricing methods.
The council said the rules aim to prevent regulatory arbitrage and harmful speculation. It also cited product suitability and transparency as minimum standards.
At the same time, the framework includes innovation as one of its guiding principles. Regulators appear focused on limiting speculative event contracts without disrupting broader derivatives markets.
Central Bank President Gabriel Muricca Galípolo signed the resolution. The Securities and Exchange Commission will now issue supplementary rules for implementation.
The new policy arrives as prediction market platforms gain traction globally, including in crypto trading circles. Brazil’s move draws a clearer line between financial derivatives and speculative event betting.

GameStop Shares Tick Higher on Power Packs Launch and Massive Cash Reserves

XRP (XRP) Price Analysis: Whales Drive 94% of Exchange Outflows Amid Institutional Accumulation
Houston PD Fires Officer Ashley Gonzalez After Viral Racist Rant
Manchester United reach agreement with Casemiro over contract clause amid transfer speculation

US brings back mandatory military draft registration

Steven Gerrard disagrees with Gary Neville over ‘shock’ Chelsea and Arsenal claim | Football


-

 Business6 days ago
Powerball Result April 18, 2026: No Jackpot Winner in Powerball Draw: $75 Million Rolls Over
-

 Politics6 days ago
Zack Polanski demands ‘council homes not luxury flats for foreign investors’
-
Entertainment5 days ago
NBA Analyst Charles Barkley Chimes in on Ice Spice McDonald’s Fiasco
-

 Fashion13 hours ago
Weekend Open Thread – Corporette.com
-

 Tech6 days ago
Auto Enthusiast Scores Running Tesla Model 3 for Two Grand and Turns It Into Bare-Bones Go-Kart
-

 Politics4 days ago
Gary Stevenson delivers timely reminder to register to vote as deadline TODAY
-

 Politics3 days ago
Making troops accountable for war crimes threatens US alliance, ex-SAS colonel warns
-

 Business3 days ago
Rolls-Royce Voted UK’s Most Iconic Trade Mark as IPO Register Hits 150
-

 Politics3 days ago
Disabled people challenge government SEND proposals over segregation concerns
-

 Politics3 days ago
Zack Polanski responds to home secretary’s taser threat
-
Politics3 days ago
Wings Over Scotland | How To Get Away With Crimes
-

 Politics3 days ago
Starmer handler McSweeney to be dragged from shadows by Foreign Affairs Committee
-
Crypto World6 days ago
Kelp DAO rsETH Bridge Hack Drains $292M as DeFi Losses Top $600M in Two Weeks
-

 Politics2 days ago
‘Iran is still a nuclear threat’
-

 Crypto World3 days ago
New York sues Coinbase, Gemini over prediction market offerings
-
Crypto World5 days ago
Bank of Hawai’i (BOH) Q1 2026: Net Income Drops to $57.4M as Net Interest Margin Expands
-

 Business3 days ago
The Job Benefits Most Men Don’t Know to Negotiate
-

 Politics6 days ago
Reform investigating candidate who ‘hates’ the NHS
-

 Crypto World21 hours ago
Michael Saylor says BTC winter is over. Market analyst disagrees, says bitcoin was in a pullback
-
Crypto World6 days ago
Nasdaq Rally Extends to 13 Days as Call Options Volume Nears Record High Levels
You must be logged in to post a comment Login