
Crypto World
XRP Price Flips BNB as Open Interest Rebuilds Toward Pre-Crash Levels
XRP price just flipped BNB to become the fourth largest crypto by market cap. Price pushed past $1.50 on a 125% volume spike. Total market cap hit $93.4 billion.
Futures open interest on Binance has climbed 59% since October. Traders are re-leveraging aggressively. OI is rebuilding toward the same danger zone that preceded the last major crash.
XRP is still 58% below its 2025 highs. But the speed of this open interest rebuild suggests smart money is positioning for a sustained move, not just a quick scalp.
Open Interest Surge Signals Leveraged Conviction
Coinglass data puts XRP open interest on Binance at 353.49 million XRP as of March 17. Back in October it was sitting at 222.79 million. That is a significant rebuild.
Here is what makes it interesting. Price has not reclaimed its October highs yet. But OI is already surging. That divergence points to net new long positioning entering the market. Traders are not chasing a recovery. They are front-running one.

XRP trading hit $3.22 billion during the BNB flip, significantly outpacing its rival.
Large wallets are accumulating across major assets right now. The positioning looks less like a dead cat bounce and more like a bet on sustained momentum.
Can XRP Price Hold the $1.50 Breakout? Key Levels to Watch
XRP is trading at $1.53, having broken through $1.40 on high volume. Now it is testing the $1.50 to $1.60 zone. A range that has killed previous rallies multiple times.
Bull case: hold above $1.53 on a daily close and the breakout is confirmed. Next target is $1.90 if volume stays elevated enough to absorb profit taking.
Bear case: lose $1.50 and the price retraces to $1.35. RSI is heating up fast. A rejection here flushes the late longs who chased the breakout.
Now the structural concern.
Open interest is at 353 million XRP and climbing toward 400 million. That exact level was the ceiling in September 2025 right before XRP collapsed from $3.65 to under $2. The difference this time is price is still 58% below those highs. More leverage per dollar of market cap. That is a powder keg setup.
A small spot correction could trigger cascading liquidations. Institutional ETF demand provides some floor. But the leverage density makes the market fragile.
Watch Binance funding rates over the next 48 hours. Rates spike while price stalls at $1.55 and a flush is coming. Price grinds higher with stable OI and $1.80 opens up.
The setup is explosive in both directions.
The post XRP Price Flips BNB as Open Interest Rebuilds Toward Pre-Crash Levels appeared first on Cryptonews.


Polymarket will rebuild its core engine, introduce a hybrid CLOB, and launch Polymarket USD, a USDC‑backed stablecoin on Polygon aimed at cheaper, more institution‑friendly trading.
Summary
- Prediction market Polymarket plans its “largest infrastructure upgrade” in the next 2–3 weeks, overhauling its matching engine and smart contracts.
- The upgrade will introduce a new hybrid CLOB model and a native stablecoin, Polymarket USD, pegged 1:1 to USDC on Polygon.
- The changes aim to cut gas costs, boost efficiency, and make the platform friendlier to institutions via EIP‑1271 and multi‑sig support.
On‑chain prediction market Polymarket will roll out what it calls “the largest infrastructure upgrade since its launch” in the coming 2–3 weeks, rebuilding its core trading engine and debuting a native dollar stablecoin, Polymarket USD, according to plans shared with The Block. The company said the overhaul will “completely reconstruct” its matching engine via a new CTF Exchange V2 smart‑contract system, while introducing a native stablecoin pegged 1:1 to USDC to replace the current bridged USDC.e on Polygon. Existing order books will be cleared during the migration, with Polymarket promising to give users at least one week’s notice before maintenance begins.
At the heart of the upgrade is a redesigned Central Limit Order Book that uses a hybrid model of off‑chain order matching combined with on‑chain, non‑custodial settlement. In technical documentation for its CTF Exchange, Polymarket describes the architecture as a “hybrid‑decentralized model” where an operator handles off‑chain matching while settlement remains on‑chain, a setup it says optimizes “performance and security” for high‑volume event markets. The Block reports that CTF Exchange V2 will introduce new matching logic and order‑data structures intended to improve matching efficiency and reduce gas costs for traders.
Polymarket has grown into one of the largest fully on‑chain prediction venues, recently drawing hundreds of millions of dollars in liquidity and a $600 million strategic investment from Intercontinental Exchange (ICE) as part of a broader bet on decentralized betting markets. ICE said its combined $1.6 billion of direct and secondary investment is not expected to be material to its financial results but positions the exchange operator as a key backer in what it calls a “David and Goliath battle” to bring prediction markets into the financial mainstream.
On the asset side, Polymarket USD formalizes a shift already underway in partnership with Circle to move from bridged USDC.e to native USDC on Polygon for all trading, order placement, and settlement. Circle has said native USDC, redeemable 1:1 for US dollars through its regulated entities, offers a “capital‑efficient” and more secure alternative to bridged tokens by eliminating cross‑chain bridge risk and tying collateral directly to its reserves. In line with that, Polymarket USD will be pegged 1:1 to USDC and used as the core collateral across the platform, with deposits from networks such as Ethereum, Solana, Arbitrum, and Base automatically converted into the new stablecoin on Polygon.
Polymarket will also add support for the EIP‑1271 (ERC‑1271) standard, allowing smart‑contract wallets such as Safe to validate signatures and trade directly, a move aimed at “expanding use cases for institutions and advanced users.” EIP‑1271 lets contracts define an isValidSignature method with arbitrary logic, making it easier for DAOs, funds, and multi‑sig setups to participate in non‑custodial markets without relying on externally owned accounts. The upgrade comes as competition in prediction markets intensifies, with Polymarket using performance, native dollar liquidity, and institutional‑grade wallet support to defend its lead in what it brands “The World’s Largest Prediction Market.”
Bitcoin found familiar resistance as it crossed the $70,000 mark to hit new April highs, with analysis blaming “profit-taking pressure.”
Bitcoin (BTC) coiled below $70,000 at Monday’s Wall Street open as analysis blamed profit taking for price inertia.
Key points:
-
Bitcoin and stocks wobble as the US trading session begins amid nerves over the US-Iran war outcome.
-
Profit taking activity is keeping BTC price action away from a $70,000 reclaim, says research.
-
A Trader says $71,000 will act as fuel for a surge $10,000 higher.
BTC price meets “profit-taking pressure”
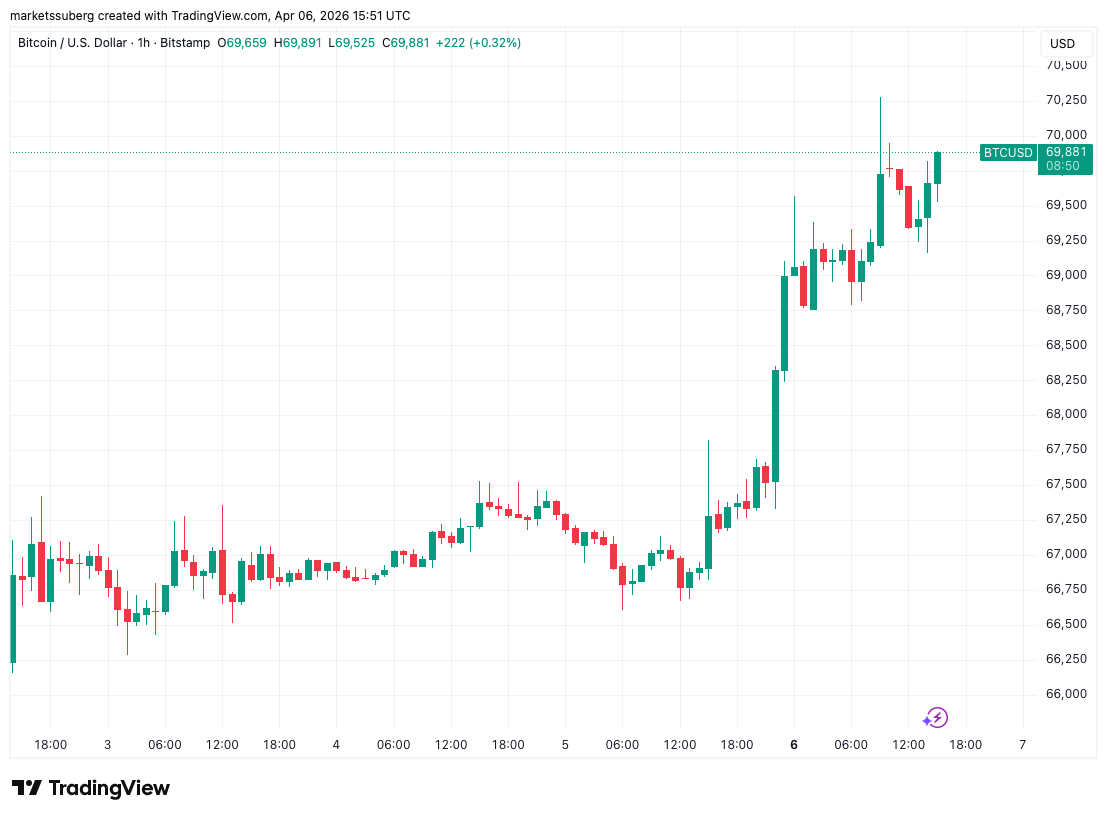
Data from TradingView showed BTC price action consolidating after hitting new April highs of $70,275 on Bitstamp.

Market nerves over the US-Iran war resulted in uncertain trading, with US stocks treading water at the open.
Speaking to the media at a military event, US President Donald Trump reiterated earlier comments that Iran would “have no bridges” and “no power plants” unless a deal was reached.
“I won’t go further because there are other things that are worse than those two,” he told reporters.
Trump previously stated that the deadline for a deal was 8pm Eastern time on Tuesday.
With price pinned below the $70,000 mark, onchain analytics platform Glassnode pointed to internal market forces as the reason for the lack of continuation higher.
“As price probed the $70K region, Realized Profit/hour spiked above $20M, signalling a local exhaustion,” it noted in a post on X.
“A pattern consistent since February 2026: Every approach to the $70k–$80K band meets thin liquidity and profit-taking pressure, capping the bounce.”

Pseudonymous trader LP added that Mondays and Thursdays had seen the upper and lower end of the week’s trading range throughout 2026.
“Price pushed higher into Monday, increasing the probability of this pivot forming a weekly high. If the correlation continues to play out, this would suggest Thursday forms the low of the week,” they told X followers.
“Watch price action closely today and tomorrow, it will confirm whether this intra-week pivot resolved as a high or a low.”

Bitcoin trader eyes $71,000 springboard
Continuing, crypto trader Michaël Van de Poppe said the line in sand for bears lay slightly higher than Monday’s current peak.
Related: First real bull signal since 2025? Five things to know in Bitcoin this week
“Pretty strong momentum on the markets of Bitcoin,” he wrote on X about the initial move to $70,000.
“Volatility picking up, and I think it’s fireworks during this week as we might be getting to the end stage of the entire situation in the Strait of Hormuz. If Bitcoin breaks $71K, then markets are in for a test at $80K.”

Van de Poppe further cautioned on following blanket market consensus over new lows coming next.
“Given that all the markets are so oversold at this point, all on-chain indicators are looking overextended and are at similar levels to the bottom areas in 2018, 2020 and 2022, I wouldn’t be surprised that we’re getting a relief run that’s going to turn the sentiment quickly,” he concluded.
This article is produced in accordance with Cointelegraph’s Editorial Policy and is intended for informational purposes only. It does not constitute investment advice or recommendations. All investments and trades carry risk; readers are encouraged to conduct independent research before making any decisions. Cointelegraph makes no guarantees regarding the accuracy or completeness of the information presented, including forward-looking statements, and will not be liable for any loss or damage arising from reliance on this content.
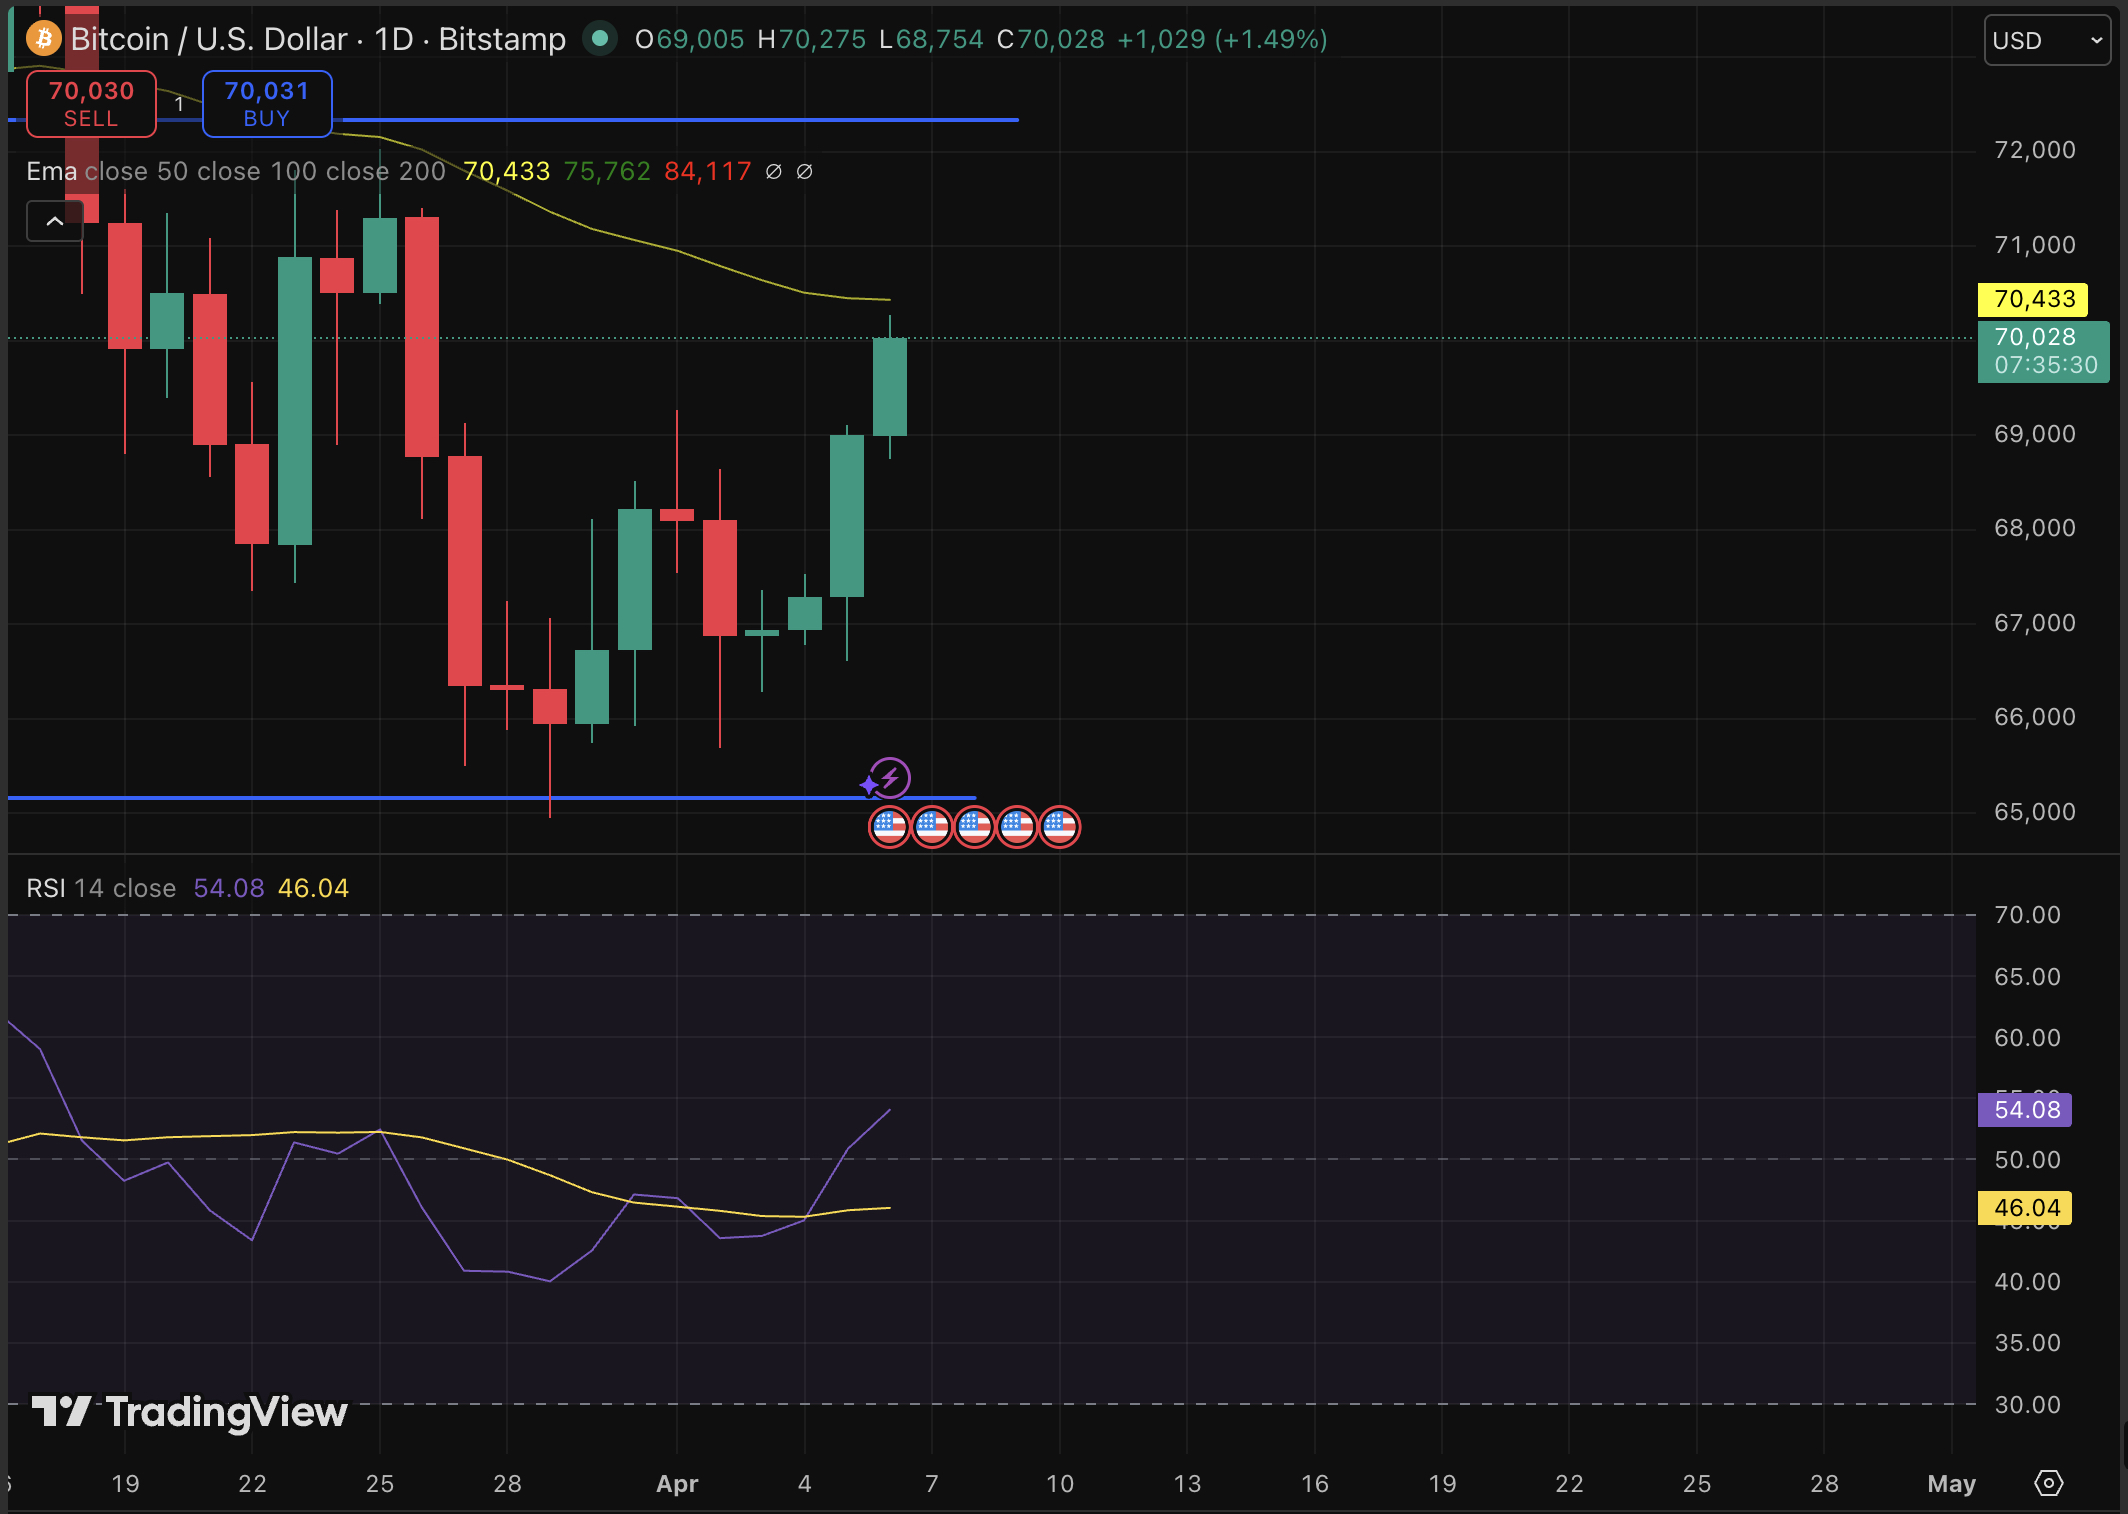
BTC USD price is moving again, at $69,000, it is up by 4% in just a day, bouncing hard off the long-term trendline that has defined every major cycle low since 2017. Before the movement, Strategy’s latest filing reveals that the firm was loading up just before this leg higher, spending $329.9 million in a single week at prices well below current levels.
Michael Saylor’s Strategy added 4,871 BTC to its treasury between late March and early April at an average cost of $67,718 per coin, bringing total holdings to 766,970 BTC acquired for $58.02 billion. The purchase was funded primarily through $227.3 million in STRC preferred stock sales, supplemented by $72 million in common stock proceeds.
At current prices, the full position sits roughly 8% underwater, about $5 billion in unrealized losses, yet the buying continued without hesitation. This conviction, right at a trendline support test, tends to matter.
The broader context makes this accumulation harder to dismiss. Strategy and spot ETFs are now the two dominant institutional absorption channels in a thinning market, with Strategy alone accumulating roughly 44,000 BTC over 30 days through late March.
Discover: The best crypto to diversify your portfolio with
Can BTC USD Price Break $72,000 This Week?
BTC USD is consolidating just below the $72,000 price resistance zone after reclaiming the 100-hour simple moving average. Volume confirmation arrived Monday evening and has held, which is a structurally positive development.
Daily RSI reads 53, MACD(12,26) at 499.5, and ADX(14) at 37.847, all of which point to sustained bullish momentum, though STOCH indicators are flashing overbought.
A daily close above $69,500 opens the path to $72,000 and potentially the $74,000 area that briefly traded in mid-March. Catalyst would be a softer-than-expected US jobs or inflation print, shifting Fed rate expectations.
Or a consolidation between $67,500 and $69,500 for several sessions, as the market digests the bounce, can also happen. Analysts forecast $67,000 by quarter-end, suggesting a range-bound grind before the next directional move.

However, a close below $66,000 and the long-term trendline would invalidate the current setup and expose the $64,000 range.
TradingView analysts noted this week: “A lot of people are turning very bearish on Bitcoin, but I don’t think it’s time to be bearish; the bearish trend is not confirmed.”
Price movement from here will largely depend on macro data and whether ETF inflows accelerate alongside the Strategy’s continued accumulation.
Discover: The best pre-launch token sales
Bitcoin Hyper Targets Early-Mover Upside While BTC Rally
Bitcoin rebounding toward $70,000 is undeniably bullish, but at a $1.4 trillion market cap, the asymmetric upside that characterized 2020 and 2021 is simply getting slimmer. The ship has sailed somewhere under $50,000.
Traders looking for leverage on a Bitcoin bull cycle without the ceiling constraints are increasingly scanning the infrastructure layer, specifically projects that extend Bitcoin’s utility rather than just price-follow it.
Bitcoin Hyper ($HYPER) is one presale generating real traction in that context. Positioned as the first-ever Bitcoin Layer 2 with Solana Virtual Machine (SVM) integration, it targets Bitcoin’s three structural weaknesses directly: slow transactions, high fees, and absent programmability.
The SVM integration is the differentiator; it has a faster performance than Solana itself through extremely low-latency Layer 2 processing, combined with a Decentralized Canonical Bridge for native BTC transfers.
The presale has raised more than $32 million at a current token price of just low $0.013, with staking available at a high 36% APY for early participants.
Research the Bitcoin Hyper presale thoroughly and join the army.
The post BTC USD Price Finally Moving Up: Saylor Strategy Bought More Before The Rally appeared first on Cryptonews.

Polymarket is rolling out its biggest platform upgrade to date, introducing a new stablecoin and rebuilding its trading system.
The changes will take place over the next few weeks and aim to make the platform faster, simpler, and more reliable for users.
At the center of the update is a new collateral token called “Polymarket USD.” It will replace USDC.e and is backed 1:1 by USDC.
For most users, the switch will happen automatically with a one-time approval. However, advanced users and bot traders will need to manually convert their funds.
At the same time, Polymarket is upgrading how trades are placed and matched. The platform is introducing a new order book system and updated smart contracts.
These changes are designed to improve speed, reduce costs, and support more advanced trading activity.
As part of the transition, all existing order books will be cleared, and trading will pause briefly during a scheduled maintenance window. Polymarket said it will announce the exact timing in advance.
For everyday users, the impact will be minimal. The interface will handle most changes in the background. However, traders may notice smoother performance and quicker order execution after the upgrade.
Overall, the update signals a shift in how Polymarket operates. The platform is moving toward a more structured, exchange-like system built for higher trading volume and broader use.
The post Polymarket Launches Stablecoin, Overhauls Trading System appeared first on BeInCrypto.
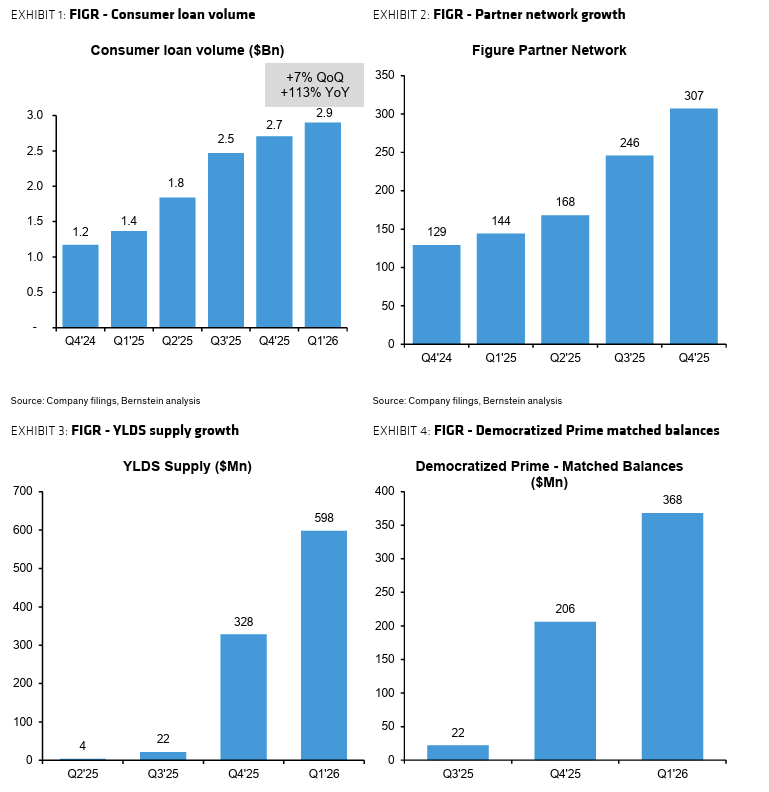
Figure Technology Solutions, a blockchain-based lending platform that went public last year, may be undervalued at current levels as loan originations accelerate and its tokenized credit marketplace scales, according to Bernstein analysts.
In a report published Monday, Bernstein assigned Figure an “Outperform” rating and a $67 price target — nearly double the stock’s recent trading level of around $32.
The bullish call follows a surge in lending activity. Figure originated $1.2 billion in loans in March, up 33% from the previous month and marking the first time monthly volumes exceeded $1 billion.
The company primarily originates home equity lines of credit (HELOCs), which allow homeowners to borrow against their equity in the property, typically at lower interest rates than unsecured loans.
It uses the Provence blockchain to reduce friction in the loan process which it claims makes it more efficient than traditional lenders. According to Provenance, Figure is able to shave 117 basis points per loan by transacting on the blockchain.
First-quarter originations reached $2.9 billion, more than doubling from a year earlier and defying the usual seasonal slowdown in HELOC demand. The figure is now tracking roughly $12 billion in annualized loan volume.

Figure’s strong start to the year follows a largely positive fourth quarter, where earnings and revenue increased, though profits fell short of expectations.
Related: CoinShares stock makes US debut on Nasdaq following SPAC merger
Figure stock struggles despite strong fundamentals
Despite improving operating performance, Figure shares have fallen more than 20% this year, reflecting broader volatility across digital asset–linked stocks and sector-specific pressures.
The stock has also struggled to regain momentum following its high-profile Nasdaq market debut last September. That closely watched initial public offering valued the company at nearly $800 million.

Still, Bernstein’s analysis valued the company at roughly 25 times its projected 2027 EBITDA — meaning the stock trades at a multiple of its expected earnings before interest, taxes, depreciation and amortization.
This valuation sits above existing digital asset companies, reflecting what analysts describe as Figure’s “structural prospects” as both a tokenization platform and a profitable lending business.
However, risks remain. According to Bernstein, HELOC demand can be sensitive to mortgage refinancing trends, while the broader private credit market — a key pillar of Figure’s growth strategy — has shown signs of increasing pressure.
Related: Crypto Biz: Bitcoin treasuries break ranks as BTC dips below $70K


Crypto has added to a Sunday rally, with bitcoin rising above $70,000 in quiet post-Easter U.S. trading hours.
The gains come alongside a modest advance in the major stock market averages ahead of President Trump’s Tuesday ultimatum for Iran to open the Strait of Hormuz. Just past the noon hour on the East Coast, the Nasdaq is higher by 0.45% and the S&P 500 by 0.3%.
Bitcoin is now higher by nearly 4% over the past 24 hours, with ether, XRP and solana posting similar gains.
Contrarian bitcoin bulls — as bitcoin crashed to $60,000 in early February — first took hope that a bottom was forming, as the strongly no-coiner Financial Times took a victory lap.
The bulls may have been even more pleased over this past weekend by a couple of other bottoming signals. First was the late Friday news that Jeff Park was exiting his role as chief investment officer at ProCap Financial (BRR). Led by Anthony Pompliano, ProCap was among 2025’s hastily formed bitcoin treasury companies aiming to hitch their wagon to the BTC bull market and replicate the success of Michael Saylor’s Strategy.
As with others of the 2025 crop — David Bailey’s Nakamoto (NAKA) and Jack Mallers’ Twenty One Capital (XXI) among them — ProCap stock has struggled mightily, performing far worse for shareholders than bitcoin itself.
Second was well-followed, longtime bull Willy Woo, suggesting that bitcoin could trade sideways for 8 to 12 years from here before finally entering a major bull market.
Other signals of the past couple of weeks: bitcoin miner MARA Holdings unloading more than 15,000 of its bitcoin stack, peer Riot Platforms selling off its entire March BTC production of 3,778 coins, and the aforementioned Nakamoto parting with some its holdings.
Whether the true bottom is in remains to be seen, but the bottoming signs continue to grow.

Key Takeaways
- Appeals court rules federal oversight supersedes state jurisdiction for Kalshi
- CFTC authority confirmed over prediction market contracts
- State gambling regulations blocked from interfering with Kalshi operations
- Decision establishes crucial precedent for U.S. prediction market industry
- Kalshi’s federally-regulated status validated by Third Circuit judges
A federal appeals court delivered a decisive victory for Kalshi, establishing that state regulators cannot enforce gambling restrictions against the prediction market platform. The Third Circuit Court of Appeals determined that Kalshi operates exclusively under Commodity Futures Trading Commission supervision, creating a protective federal shield against conflicting state laws. This watershed moment significantly expands Kalshi’s operational certainty across the nation.
Court Establishes Federal Supremacy Over Prediction Markets
The Third Circuit judges unanimously determined that Kalshi’s event-based contracts constitute federally regulated commodities rather than state-controlled gambling activities. The panel recognized Kalshi’s designation as a contract market under direct CFTC jurisdiction. This classification prevents individual states from applying their gambling statutes to the platform’s offerings.
The court’s analysis centered on the Commodity Exchange Act’s framework, which assigns comprehensive regulatory authority to the CFTC for swap agreements and related financial instruments. Judges found that sports outcome contracts traded on Kalshi qualify as swaps under federal commodity law. This interpretation grants Kalshi immunity from state-level enforcement measures.
The legal challenge originated when multiple state authorities, notably New Jersey, issued cease-and-desist directives targeting Kalshi’s operations. Kalshi contested these actions by asserting that federal regulatory approval preempts state-level prohibitions. The appellate court validated this argument, reinforcing the primacy of federal oversight.
State Regulators Face Jurisdictional Setback
New Jersey’s attorney general contended that Kalshi’s contract offerings violated state gambling prohibitions and operated illegally within state borders. The court dismissed this position, determining that the Commodity Exchange Act explicitly reserves regulatory power for federal authorities. Kalshi successfully defended against potential operational restrictions that threatened its business model.
The majority opinion stressed that Congressional intent clearly established the CFTC as the sole regulator for designated contract markets and swap transactions. According to the ruling, states retain enforcement capabilities only over activities falling outside federal regulatory frameworks. Kalshi’s compliance with CFTC requirements places it firmly within protected federal territory.
A lone dissenting judge raised concerns that Kalshi’s products functionally mirror conventional sports wagering activities. This dissent advocated for preserving state regulatory rights over betting-like offerings. Despite this objection, the prevailing judicial opinion affirmed Kalshi’s status as a legitimate commodities exchange platform.
Implications for the Prediction Market Industry
This judicial determination establishes critical legal foundation for prediction market growth throughout American financial markets. Kalshi now enjoys enhanced regulatory clarity enabling nationwide service expansion without confronting conflicting state requirements. The decision eliminates substantial legal ambiguity that previously clouded federal-state jurisdictional boundaries.
The Commodity Futures Trading Commission has consistently backed Kalshi and comparable platforms when facing state regulatory challenges. Federal regulators have actively opposed state attempts to impose restrictions on CFTC-approved exchanges. This appellate victory provides additional confirmation of Kalshi’s regulatory compliance and legitimacy.
The precedent established by this case will likely shape how emerging prediction market ventures structure their platforms under federal commodity regulations. Kalshi emerges with strengthened competitive positioning and validated legal framework for continued growth. This ruling represents a defining moment for prediction markets’ integration into mainstream financial infrastructure.


A US appeals court sided with Kalshi, ruling that CFTC‑regulated event contracts fall under federal law, not New Jersey gambling rules, reshaping prediction market oversight.
Summary
- U.S. appeals court says New Jersey cannot regulate Kalshi’s CFTC‑supervised sports contracts.
- Ruling strengthens federal preemption and could reshape how prediction markets compete with sportsbooks.
- Decision lands amid a broader legal war between states, Kalshi, and the CFTC over who controls event‑based trading.
A federal appeals court has ruled that New Jersey cannot bar Kalshi from offering sports‑related event contracts in the state, declaring that the Commodity Exchange Act and the Commodity Futures Trading Commission (CFTC) hold exclusive authority over those markets. In a 2‑1 decision, the 3rd U.S. Circuit Court of Appeals in Philadelphia held that trading on Kalshi’s designated contract market is governed by federal derivatives law, not state gambling codes, effectively blocking New Jersey regulators from enforcing their cease‑and‑desist order. The ruling cements a major legal win for Kalshi, which has argued for years that its contracts are swaps and hedging tools rather than traditional sports bets.
The case stems from a series of cease‑and‑desist letters sent by New Jersey in 2025, accusing Kalshi’s sports markets of violating the state’s Sports Wagering Act and constitution and threatening fines of up to $100,000 per violation. Kalshi sued in federal court, claiming that, as a CFTC‑regulated designated contract market, its event contracts sit squarely within federal jurisdiction and are “a type of ‘swap’ regulated by the Commodity Exchange Act.” A New Jersey federal judge had already granted Kalshi a preliminary injunction in 2025, writing that he was “persuaded that Kalshi’s sports‑related event contracts fall within the CFTC’s exclusive jurisdiction,” a view the 3rd Circuit has now largely endorsed.
The appeals court’s opinion aligns with Kalshi’s broader strategy as it fights regulators in multiple states, including Nevada, Maryland, and Tennessee, over whether its markets are illegal gambling or federally protected derivatives. In Tennessee, for example, U.S. District Judge Aleta Trauger recently granted a temporary restraining order halting enforcement of that state’s cease‑and‑desist order, finding that Kalshi is likely to succeed on its argument that federal law preempts state gambling statutes. More broadly, the CFTC and U.S. Department of Justice have escalated the fight by suing Arizona, Connecticut, and Illinois over what CFTC Chair Mike Selig called “aggressive and overzealous attempts to overstep the CFTC” in their efforts to police prediction markets.
Responding to the New Jersey decision, Kalshi co‑founder and CEO Tarek Mansour called the appeals ruling a “significant victory” and argued that regulated prediction markets “offer greater transparency and fairness” than opaque traditional betting channels. In earlier commentary, Mansour has said that prediction markets can outperform conventional financial instruments by delivering “clean, crowd‑driven probabilities instead of noisy headlines,” framing platforms like Kalshi as information infrastructure rather than casinos. The decision also lands as rivals such as Polymarket secure their own CFTC approvals, with the agency “effectively welcoming” Polymarket into the club of fully regulated U.S. exchanges and binding it to full designated‑contract‑market‑style surveillance and self‑regulatory duties.
Despite the 3rd Circuit win, Kalshi’s regulatory risk is far from over. A Nevada judge recently extended a ban preventing the company from offering event‑based contracts in that state, underscoring the fragmented legal landscape facing prediction platforms. At the federal level, a bipartisan group of U.S. senators has floated legislation to ban sports‑bet and casino‑style contracts on CFTC‑regulated prediction markets altogether, raising the prospect that Congress, not just courts, will decide how far companies like Kalshi can push into sports.

Bitmine Immersion Technologies (BMNR) announced $11.4 billion in total crypto and cash holdings alongside approval to uplist to the New York Stock Exchange (NYSE).
The company will begin trading on the NYSE on April 9, 2026, after its stock ceases trading on the NYSE American following market close on April 8. BMNR will retain its ticker symbol.
BitMine’s ETH Treasury Grows to Nearly 4% of Total Supply
BitMine’s holdings as of this writing include 4,803,334 Ethereum (ETH) tokens valued at $2,146 per coin, 198 Bitcoin (BTC), a $200 million position in Beast Industries, a $92 million stake in Eightco Holdings (ORBS), and $864 million in cash.
The company now controls 3.98% of all ETH in circulation, placing it over 79% toward its stated goal of accumulating 5% of the total supply.
That target has been central to BitMine’s strategy since its pivot from Bitcoin mining to Ethereum accumulation in mid-2025.
BitMine acquired 71,252 ETH in the week ending April 5, its highest weekly purchase since late December 2025.
The company has steadily increased its weekly buying pace throughout 2026, rising from roughly 33,000 tokens per week in early January to above 70,000.
Tom Lee Frames ETH as a Wartime Safe Haven
Chairman Thomas “Tom” Lee, also known for his role at Fundstrat, positioned Ethereum’s performance against the backdrop of the ongoing Iran conflict, which began on February 28 with joint US-Israeli strikes.
“ETH remains the second best performing asset since the start of the war, with a 6.8% gain and outperforming the S&P 500 by 1,130bp. And ETH beating gold by 1,840bp demonstrates ETH is the wartime store of value,” read an excerpt in the announcement, citing Tom Lee.
Lee added that Ethereum benefits from Wall Street’s shift toward blockchain tokenization and growing demand from agentic AI systems for public, neutral networks.
The Iran war has triggered what the International Energy Agency called the largest supply disruption in oil market history, sending shockwaves through equities and commodities globally.
Against that backdrop, Lee argued that ETH’s absolute gains signal investor confidence that could eventually pull sidelined capital back into risk assets.
These remarks align with sentiment from Geoff Kendrick, Global Head of Digital Asset Research at Standard Chartered, during a recent BeInCrypto Experts Council.
“I think Ethereum probably wins for the next little while on the back of TradFi getting involved. As banks and other build stuff on the blockchain space, it’s almost all going to happen on Ethereum for the next couple of years, I think,” Kendrick told BeInCrypto.
Staking and Institutional Backing
BitMine has 3,334,637 ETH staked, generating an annualized yield of 2.78% and annualized staking revenues of $196 million. The company also launched MAVAN, its institutional-grade Ethereum staking platform built to serve custodians and ecosystem partners.
The firm ranks as the 96th most traded stock in the US by daily dollar volume at $987 million, placing it between Schlumberger and Adobe.
Its institutional investor base includes ARK Invest’s Cathie Wood, Founders Fund, Pantera, Kraken, Galaxy Digital, and personal investor Tom Lee.
BitMine now trails only Strategy Inc. (MSTR) as the second-largest crypto treasury company globally. Strategy holds 766,970 BTC valued at approximately $53.5 billion.
The NYSE uplisting, increasing weekly ETH accumulation, and growing staking revenue suggest BitMine’s next phase will test whether institutional appetite for an Ethereum-focused treasury model can rival the attention that Strategy has drawn with Bitcoin.
The post Tom Lee’s BitMine Storms the NYSE With $11 Billion in Crypto appeared first on BeInCrypto.
Most altcoins are trading 50% or more below their record prices, but a small group is moving against that trend. Three tokens currently sit within 11% of their all-time highs, each backed by a distinct catalyst and a confirmed breakout pattern.
BeInCrypto analysts identified these altcoins where the technical setup and fundamental momentum converge, creating a realistic path to new price discovery this week.
Aria.AI (ARIA)
AriaAI (ARIA), an AI-powered gaming and publishing platform, trades at $0.607 on the 8-hour chart, approximately 10.5% below its all-time high of $0.679. The token has surged 214% since March 23, driven by the broader AI sector rally that pushed the category’s total market cap up 30% in a single month to $19 billion.
Grayscale, the world’s largest crypto asset manager, added ARIA to its Q1 2026 “Assets Under Consideration” watchlist in January under the Consumer and Culture category, as reported by Wu Blockchain.
Want more token insights like this? Sign up for Editor Harsh Notariya’s Daily Crypto Newsletter here.
That institutional recognition, combined with the AI sector momentum, has fueled the rally. The 8-hour chart shows a pole and flag pattern. The pole represents the 214% ascent since March 23, and since April 5, prices have consolidated inside what resembles a bullish flag.
However, the Relative Strength Index (RSI), a momentum oscillator, is flashing a bearish divergence. Between March 22 and April 6, price made a higher high while RSI made a lower high. This warns that momentum is cooling and the consolidation could extend before a breakout attempt.
A break above $0.63 would breach the upper trendline and open the path toward the ATH and beyond, with $0.78 as the next reasonable target.
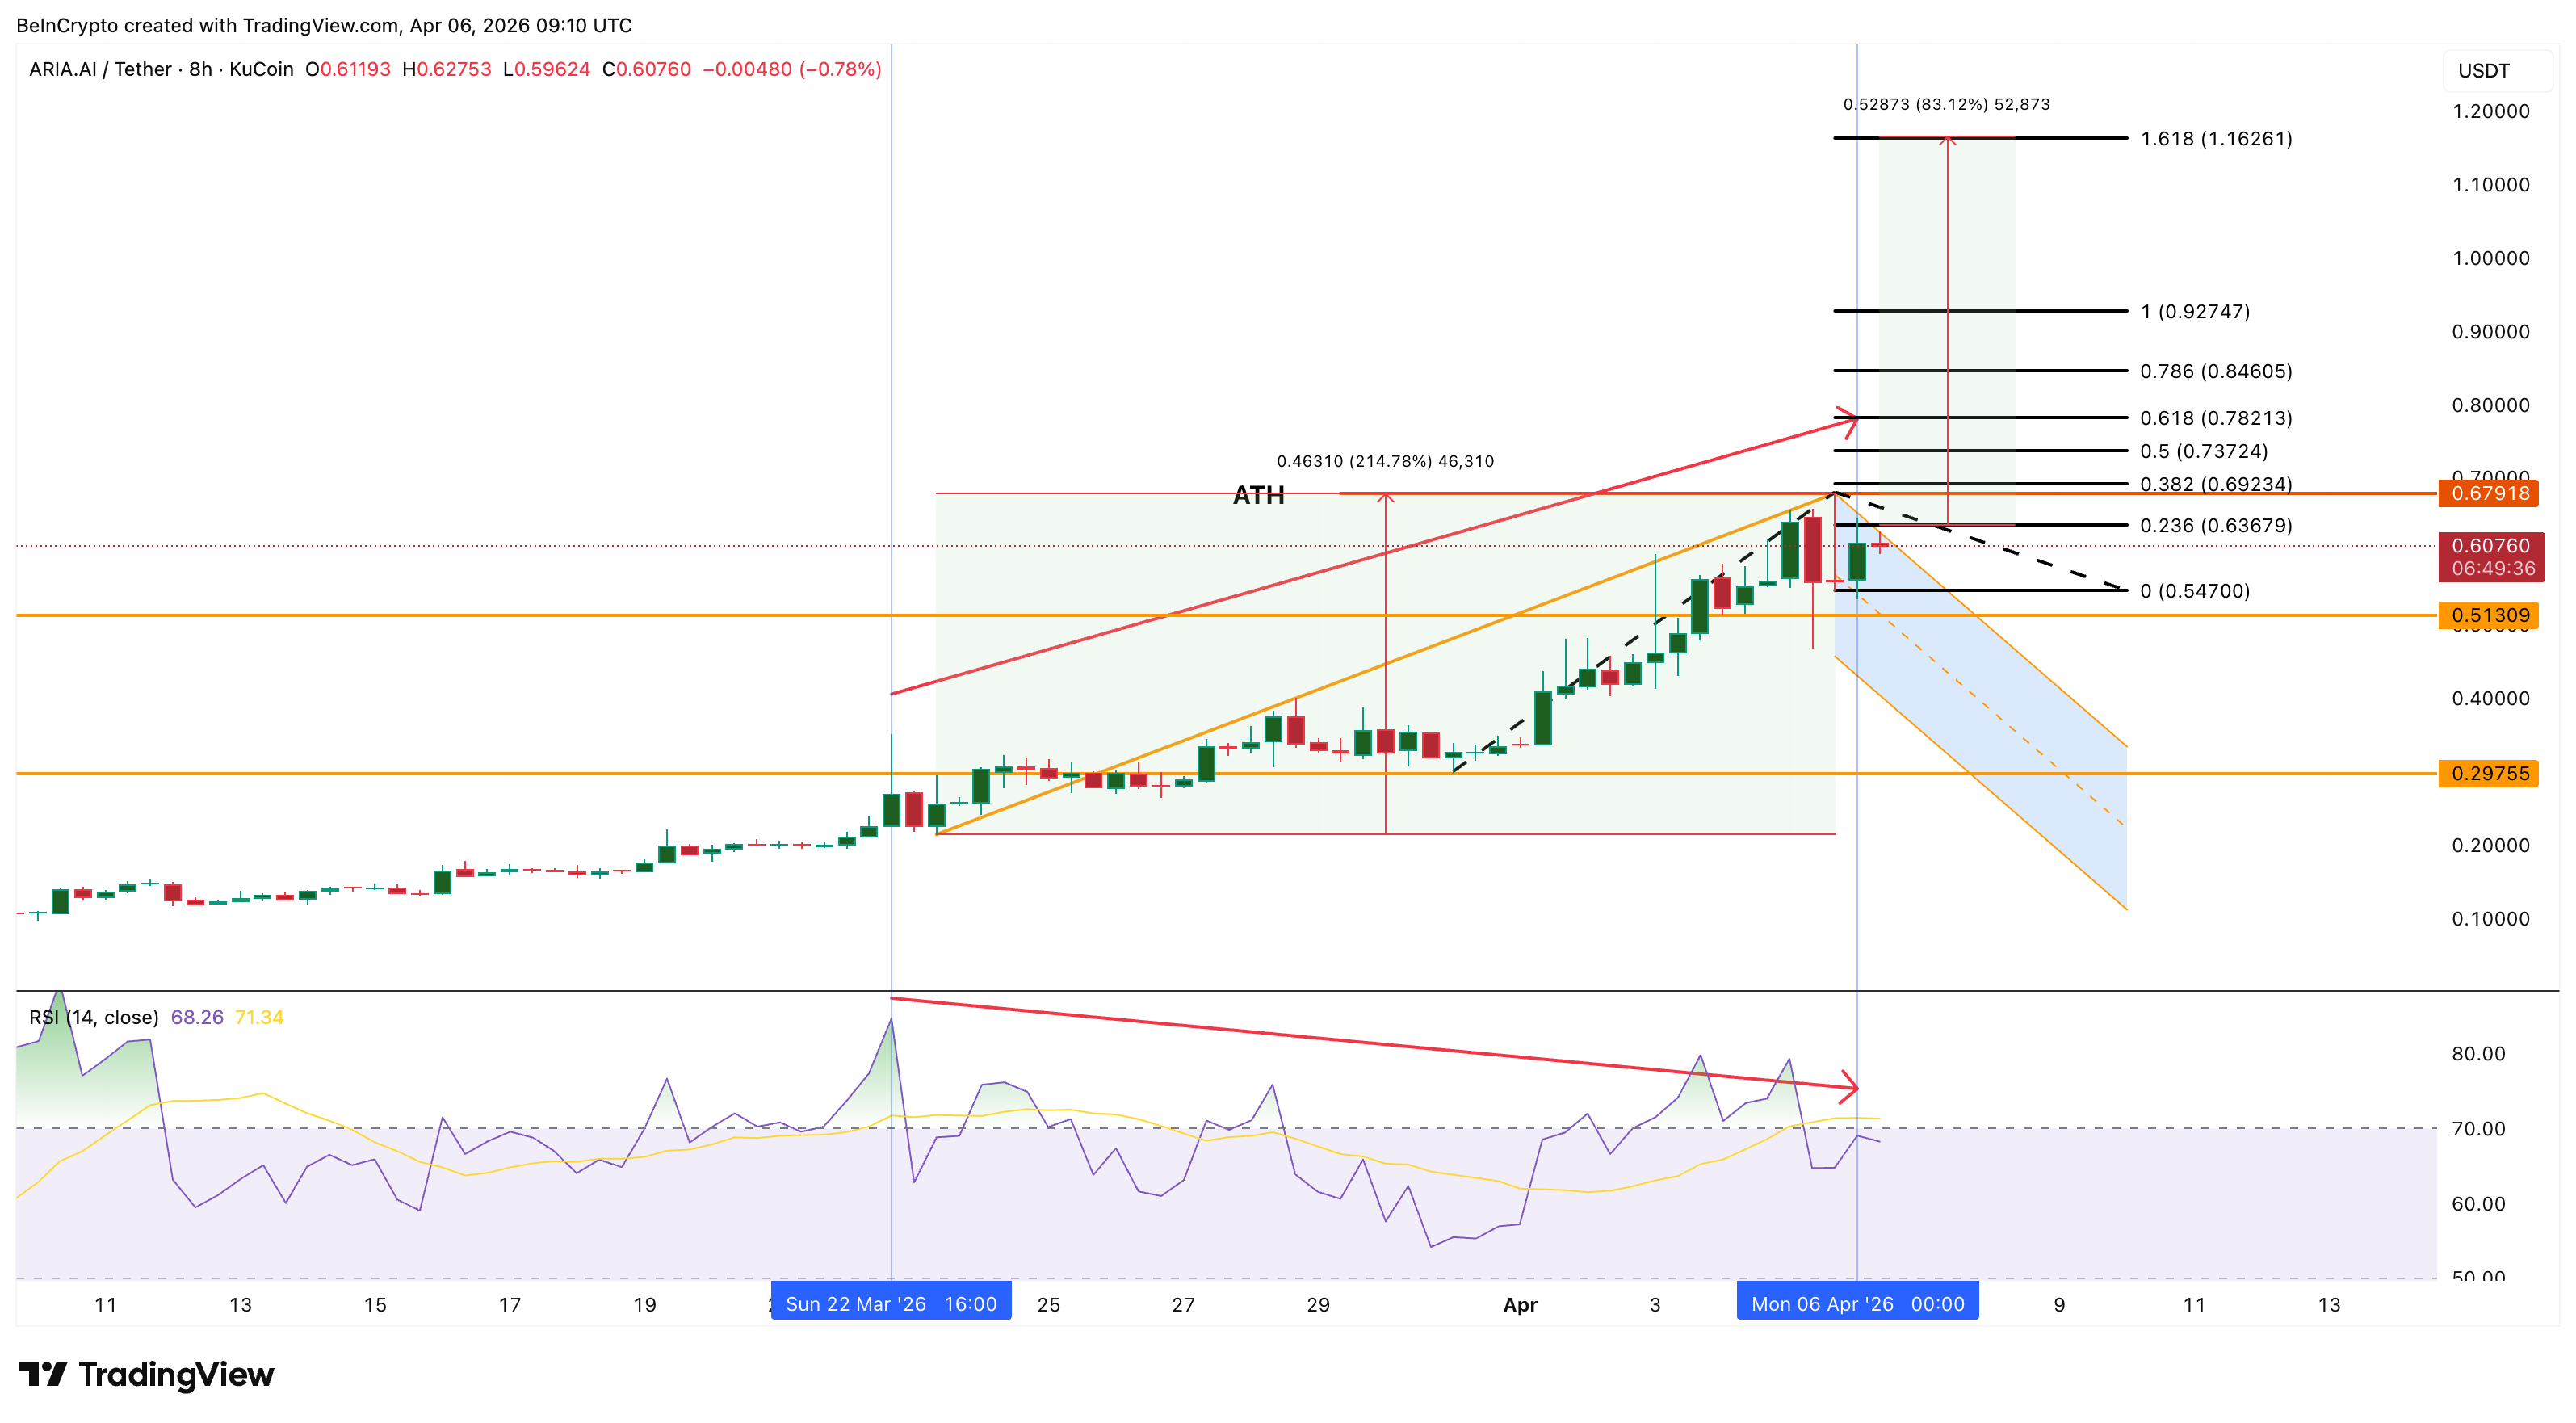
A drop to $0.51 keeps the pattern intact, but a fall under $0.29 invalidates the structure entirely.
MemeCore (M)
MemeCore (M), a Layer 1 blockchain built for meme coin infrastructure, trades at $2.69 on the daily chart. The token is up 73% year-to-date and sits approximately 9.5% below its all-time high of $2.97 set in 2025.
The March 25 hard fork slashed gas fees from 1,500 gwei to 15 gwei, serving as the fundamental catalyst. Since then, MemeCore has confirmed an inverse head and shoulders breakout on the daily chart.
The measured move from the neckline projects a 67% advance, targeting $3.42. That projection lands well above the current all-time high at $2.97, meaning the pattern itself points to price discovery if it completes. The breakout fulfilment is a key reason why M is one of the few altcoins capable of hitting a new peak this week.
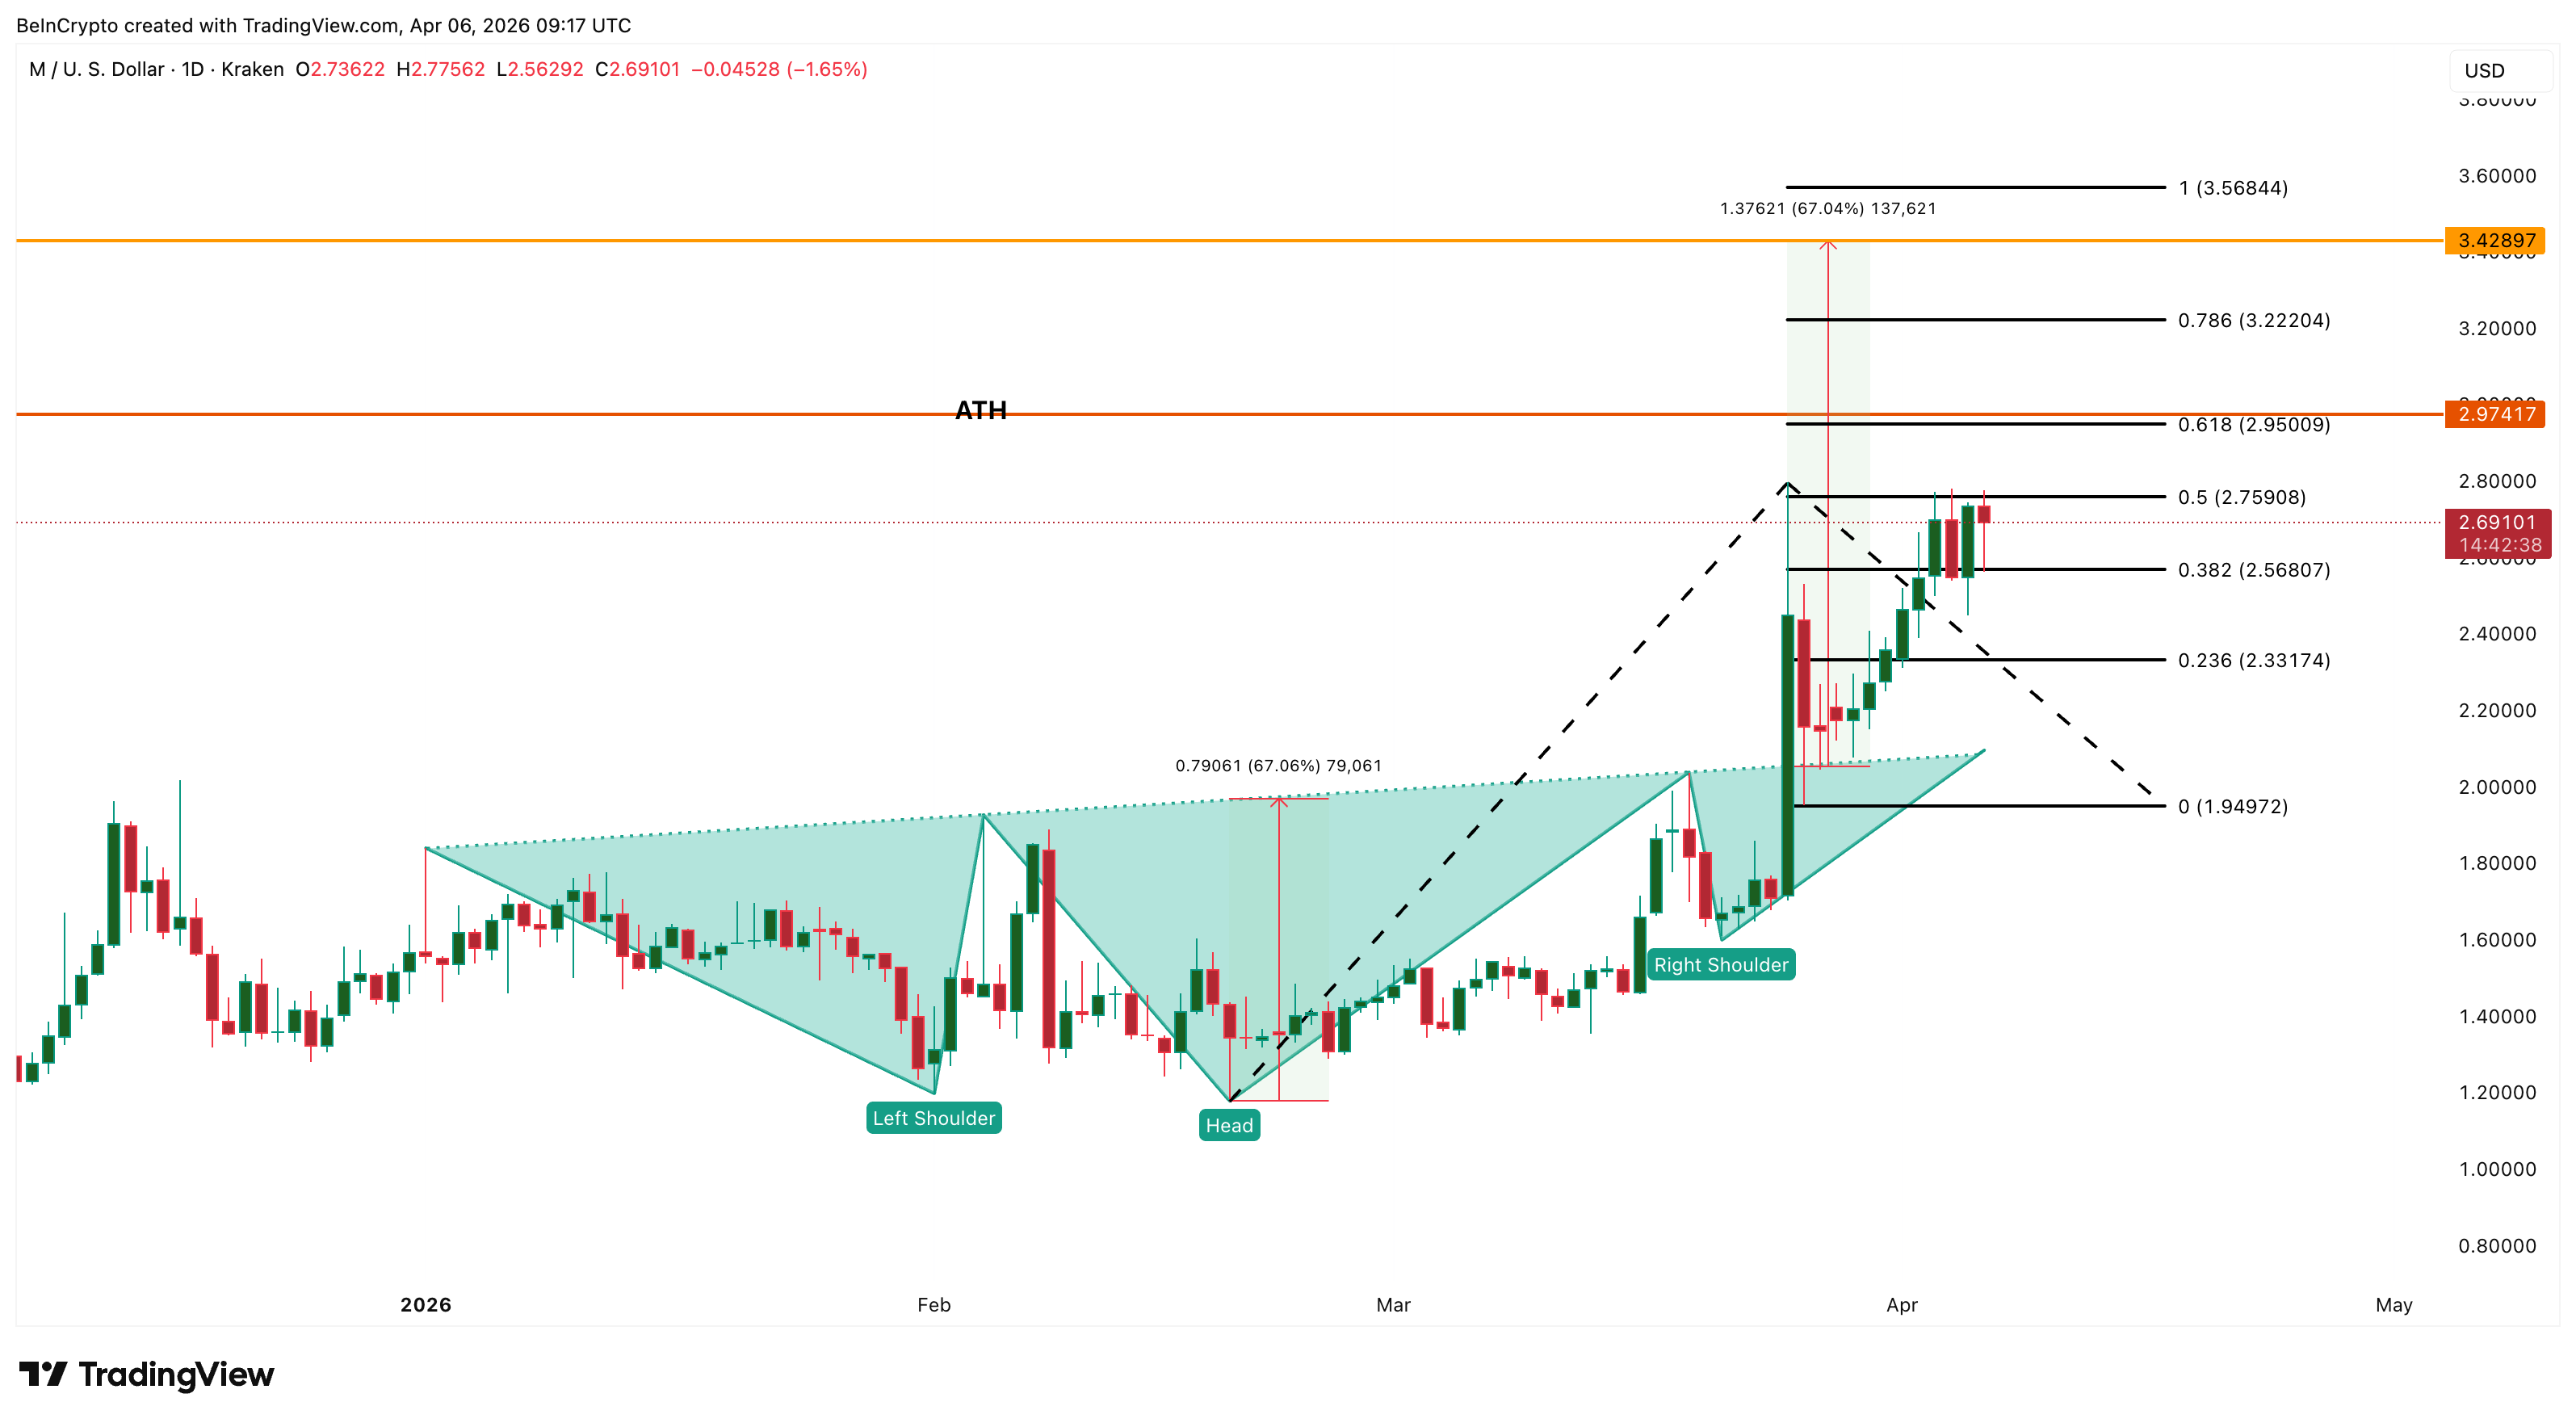
The immediate resistance for M is $2.75, which has capped the last several daily candles. A daily close above $2.75 opens the path to $2.95, followed by the ATH at $2.97. A move above that level enters uncharted territory with $3.22 and $3.42 as the next projected targets.
A daily close above $2.97 confirms a new all-time high with a $3.42 projection, while a failure to hold $2.33 would weaken the breakout structure.
LEO Token (LEO)
LEO Token (LEO), the native utility token of the Bitfinex exchange ecosystem. It trades at $10.12 on the daily chart, just 0.1% from its all-time high of $10.13. Among the three altcoins, LEO requires the smallest move to set a new record.
The reason LEO has been grinding higher while most tokens remain deep below their peaks is structural. Bitfinex parent company iFinex uses at least 27% of its monthly gross revenue to buy back and burn LEO tokens from the open market. That mechanism creates a permanent bid under the price that does not depend on market sentiment.
With war-driven crypto market volatility pushing Bitfinex trading volumes higher, the monthly burn rate has likely accelerated, compressing supply while demand remains steady.
The daily chart confirms an inverse head and shoulders pattern that broke out around March 20. The measured move from the breakout projects a 43.91% advance, targeting $13.27.
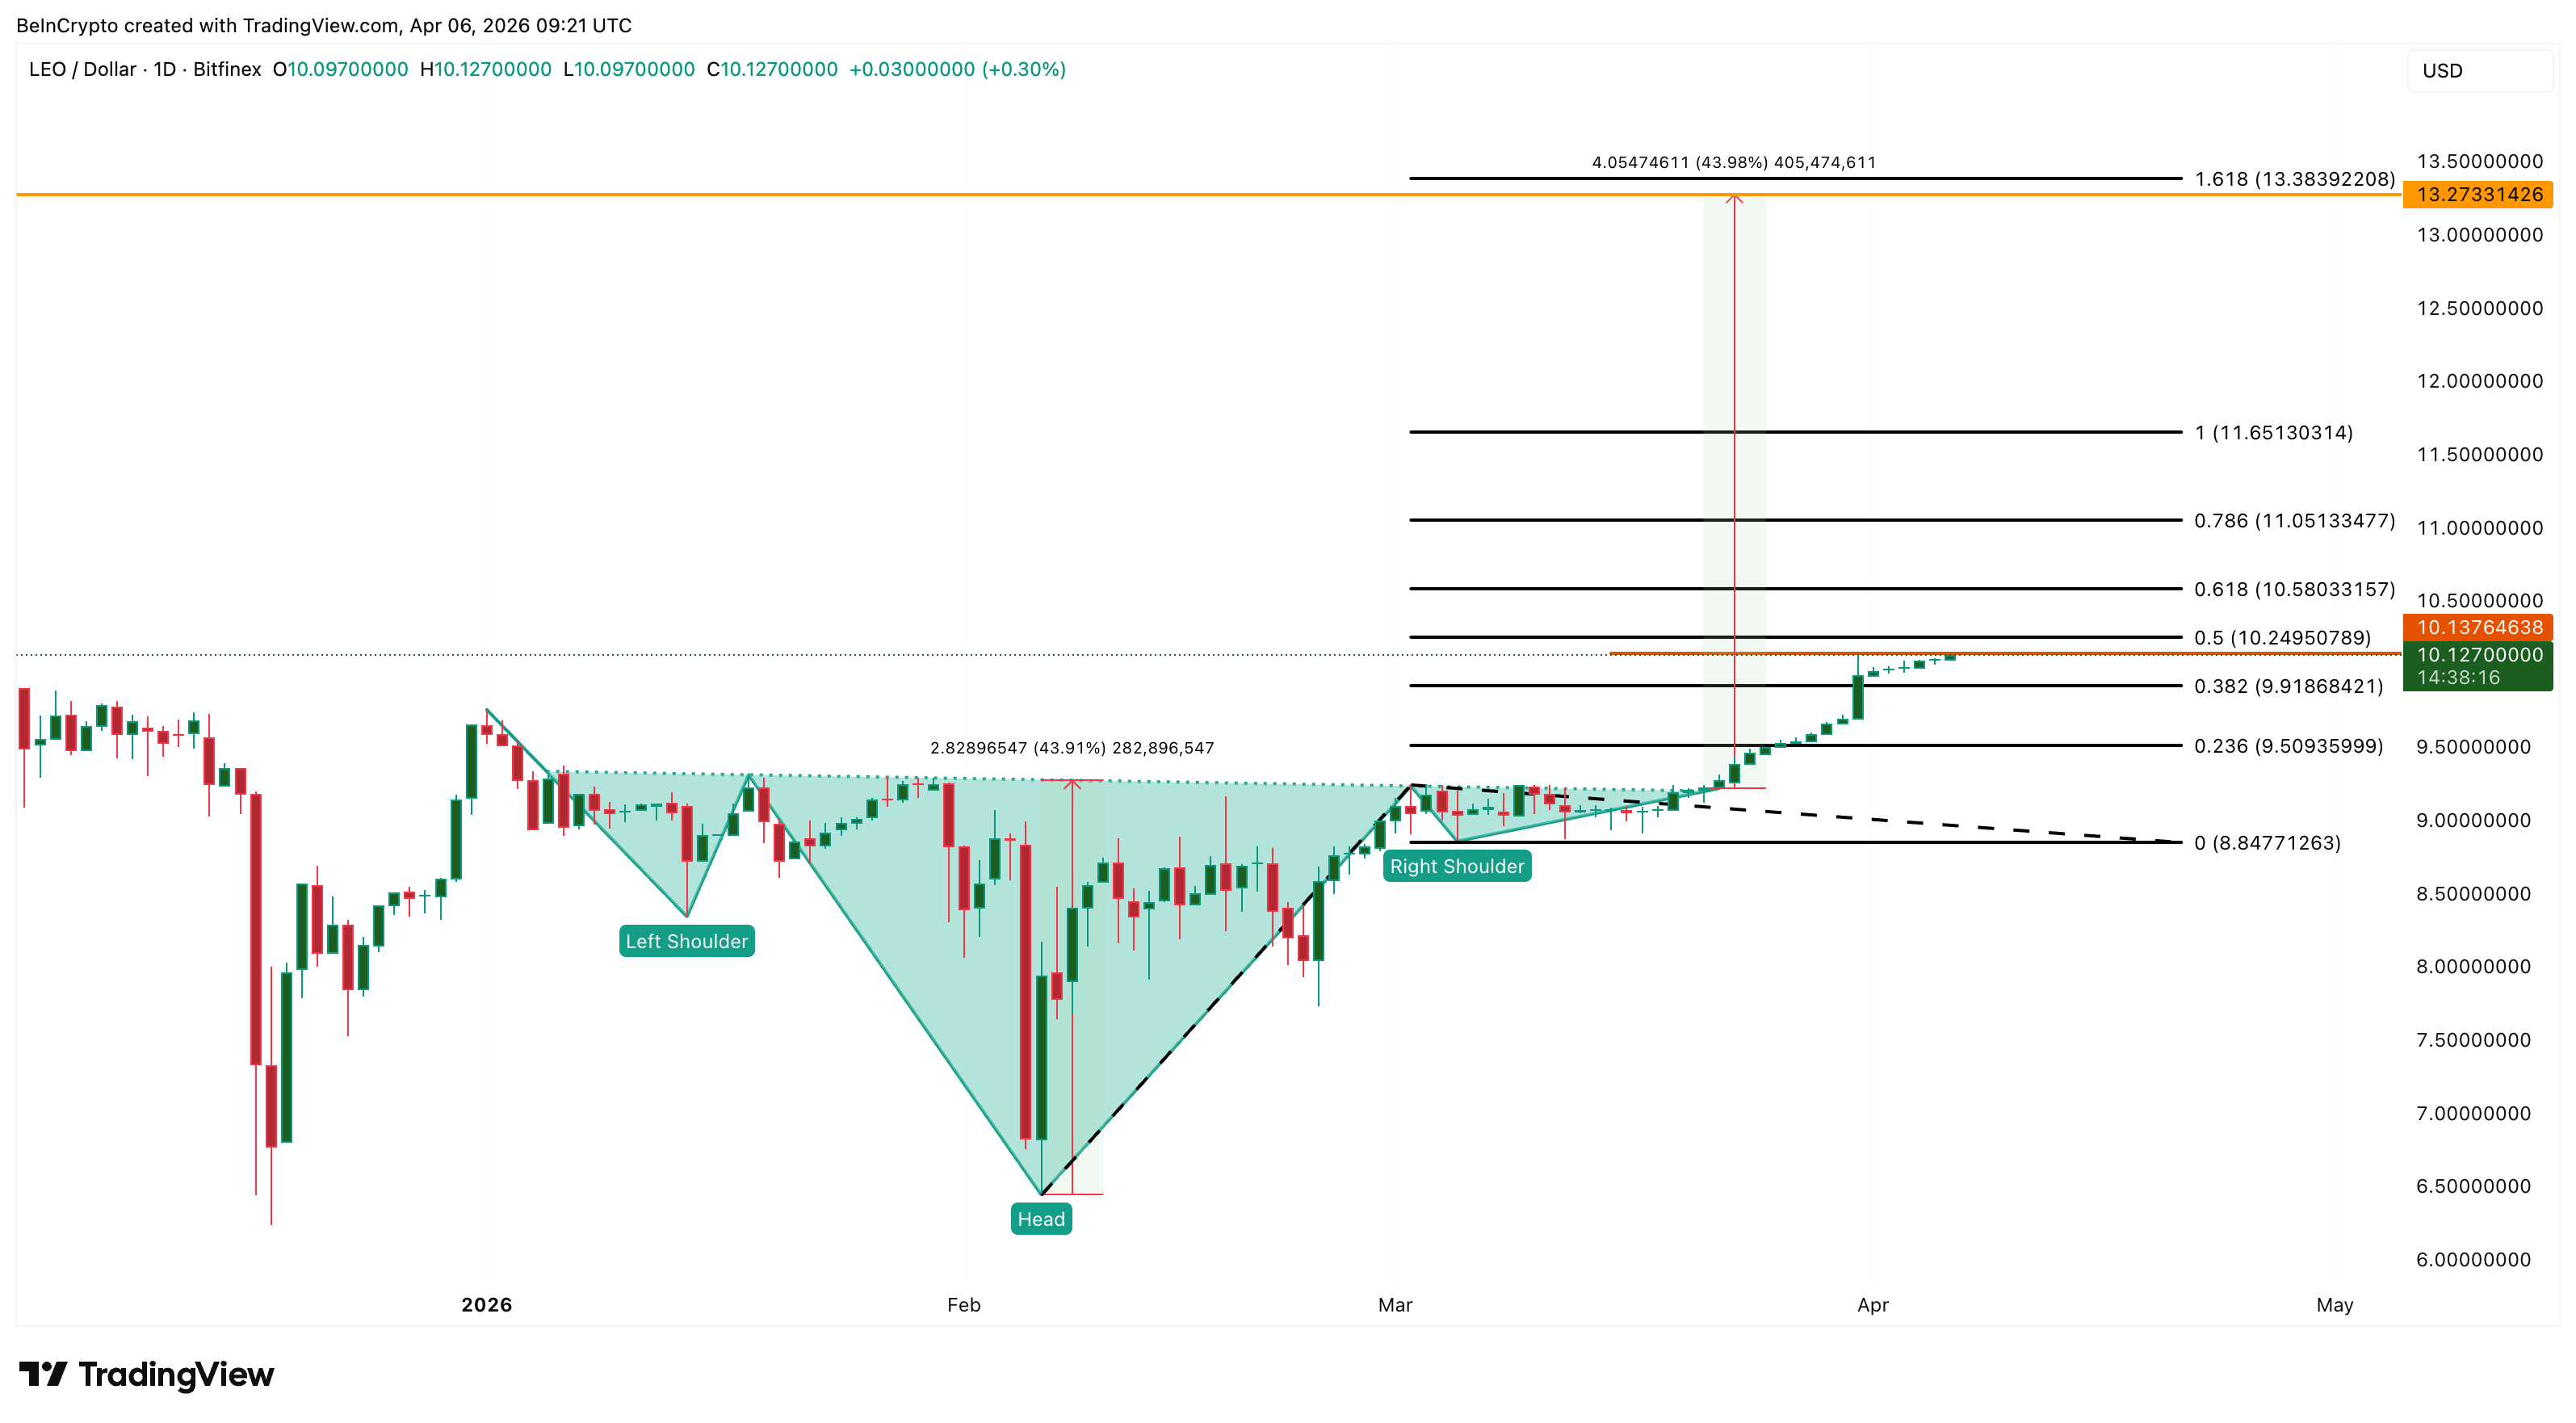
The immediate hurdles are $10.13 and $10.24. A move above $10.13 confirms a new all-time high. It also opens the path toward $10.58 and $11.05 at higher technical levels. The full pattern projection targets $13.27. On the downside, a fall below $9.91 would weaken the short-term structure, with $9.50 and $8.84 as lower supports.
The post 3 Altcoins That Could Hit New All-Time Highs in the Second Week of April 2026 appeared first on BeInCrypto.
The alternative city break to pricey Amsterdam you can easily get to from Cardiff
Trump threatens jail over Iran rescue operation leak

Polymarket to rebuild engine, launch native dollar stablecoin

Smart energy pays enters the US market, targeting scalable financial infrastructure

Why Israel is blocking foreign journalists from entering

Bitcoin: We’re Entering The Most Dangerous Phase

Bitcoin Live Trading: Gains While Others Panic! Big Move Soon?! EP1953

Stock Market falling reasons #equitymarket #financialfreedom #finance #financeworld #financenews

BajajFinserv Update #equitymarket #financialfreedom #nbstocksnew#financeshorts #stockmarket#finance
-

 NewsBeat4 days ago
Steven Gerrard disagrees with Gary Neville over ‘shock’ Chelsea and Arsenal claim | Football
-

 Business4 days ago
No Jackpot Winner and $194 Million Prize Rolls Over
-

 Fashion3 days ago
Weekend Open Thread: Spanx – Corporette.com
-

 Crypto World5 days ago
Gold Price Prediction: Worst Month in 17 Years fo Save Haven Rock
-

 Business18 hours ago
Three Gulf funds agree to back Paramount’s $81 billion takeover of Warner, WSJ reports
-
Crypto World6 days ago
Dems press CFTC, ethics board on prediction-market insider trades
-

 Sports2 days ago
India men’s 4x400m and mixed 4x100m relay teams register big progress | Other Sports News
-

 Business5 days ago
Login and Checkout Issues Spark Merchant Frustration
-

 Tech6 days ago
EE TV is using AI to help you find something to watch
-

 Sports6 days ago
Tallest college basketball player ever, standing at 7-foot-9, entering transfer portal
-

 Politics7 days ago
Should Trump Be Scared Strait?
-
Tech6 days ago
Daily Deal: StackSkills Premium Annual Pass
-

 Tech7 days ago
Flipsnack and the shift toward motion-first business content with living visuals
-

 Sports7 days ago
Women’s hockey camp eyes fitness boost, tactics ahead of WC 2026 campaign | Other Sports News
-

 Crypto World7 days ago
U.S. rule change may open trillions in 401(k) funds to crypto
-

 Tech6 days ago
How to back up your iPhone & iPad to your Mac before something goes wrong
-

 NewsBeat7 days ago
Newscast – Scott Mills Sacked By BBC
-

 Politics7 days ago
Usha Vance: Disney Hats Over MAGA Caps?
-
Crypto World7 days ago
Valinor raises $25m to put private credit on-chain
-

 Business7 days ago
Functional benefits brewing in coffee innovation
You must be logged in to post a comment Login