
Crypto World
XRP price prediction July 2026: $1 floor vs CLARITY

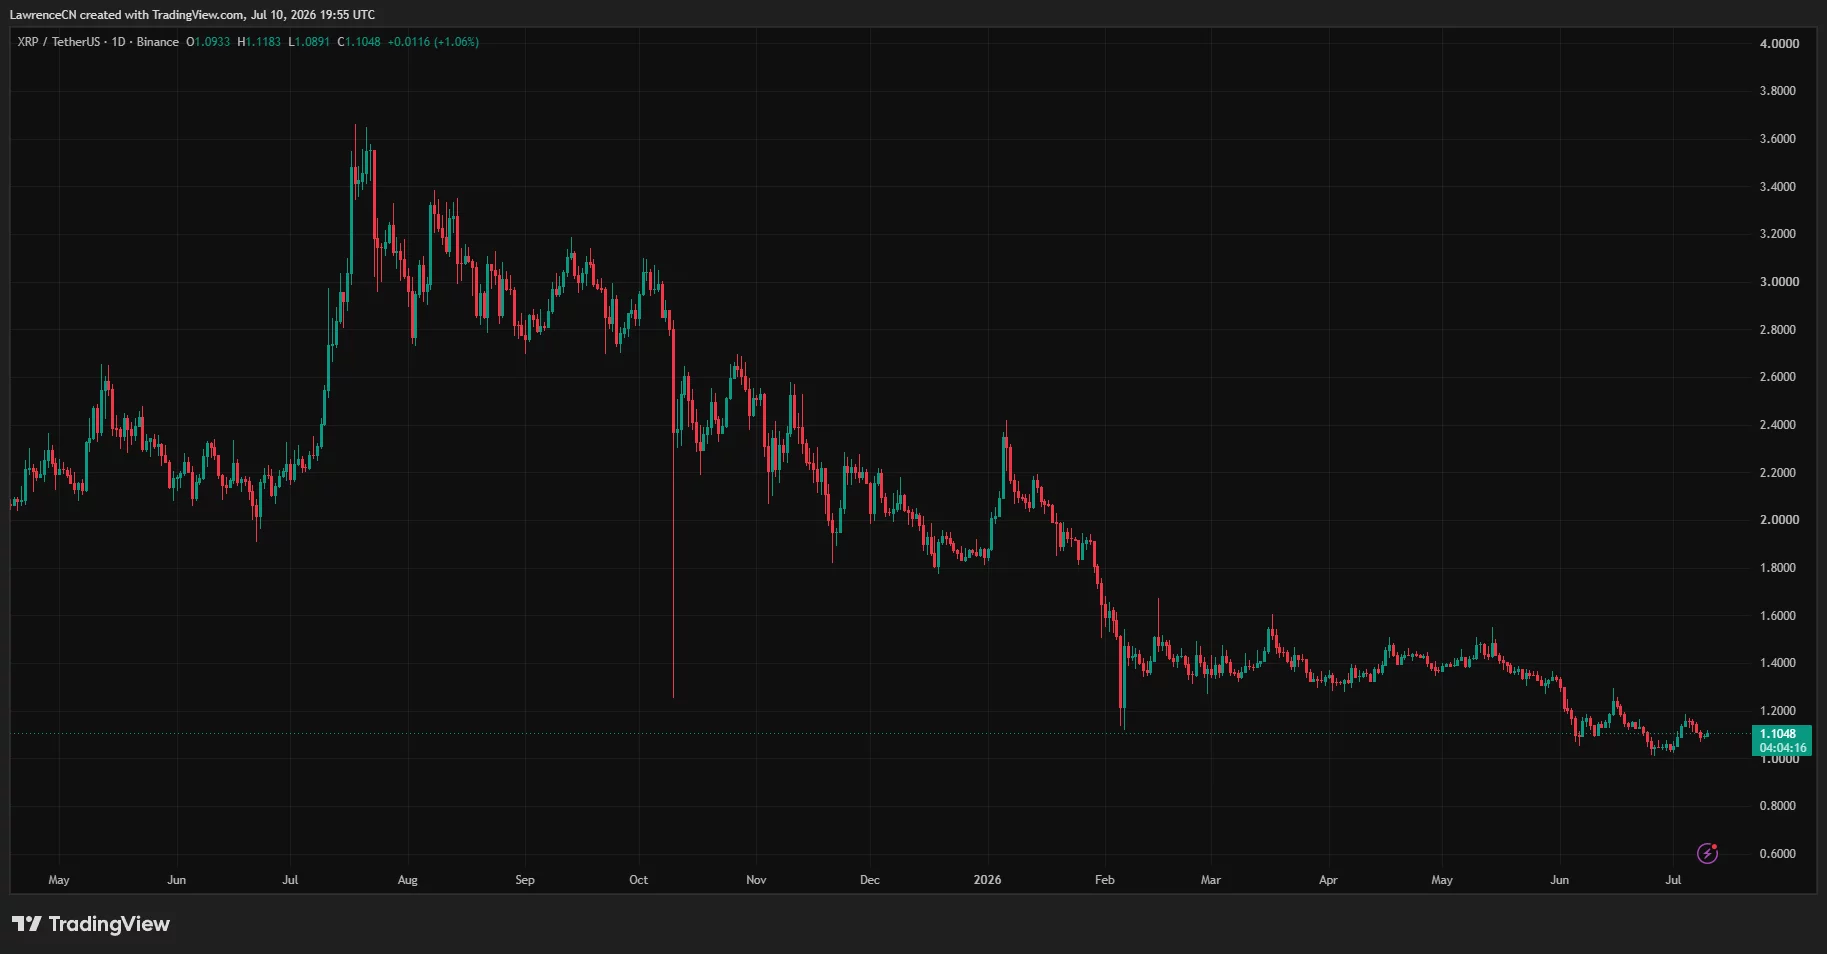
XRP spent the first half of 2026 defending the one level that matters, the $1 mark, while a wall of bullish fundamentals, ETF inflows, whale accumulation, and a finished lawsuit failed to move the price. Now a delayed act of Congress has become the single catalyst that could break the deadlock in either direction. This is the level, the tension between fundamentals and price, and the honest case on both sides for the month ahead.
Summary
- XRP remains trapped between $1 support and $1.20 resistance as bullish fundamentals struggle to lift the price.
- Progress on the CLARITY Act could unlock stronger institutional demand, while another delay may pressure the $1 floor.
- ETF inflows, whale accumulation, Fed policy, and broader crypto sentiment will shape XRP’s direction through July.
XRP (XRP) enters July 2026 trading near $1.14, and the number hides a standoff. For months, the token has done something that frustrates every holder watching the headlines: it has absorbed a steady stream of unambiguously bullish news, sustained ETF inflows, tripling whale accumulation, the long legal cloud finally lifted, and gone essentially nowhere, pinned in a range whose floor is the psychologically decisive $1.00 mark. The fundamentals say one thing, and the price says another, and the gap between them is the defining feature of XRP right now.
The catalyst that could finally resolve the standoff is not a product or a partnership but a piece of legislation. The market-structure bill that would settle how digital assets like XRP are classified in the United States, and with it the path to spot ETF conversions and deeper institutional access, has slipped from its expected timeline toward late July or August, and its progress or delay has become the swing factor traders are watching above all else. XRP sits, in other words, between a well-defended floor and a legislative catalyst, with fundamentals loaded on one side and a stubborn chart on the other, waiting for something to break the tension.
This prediction maps that standoff the way a trader would: the price levels that define the range, the strange disconnect between XRP’s strong fundamentals and its flat price, the bullish case built on flows and legislation, the bearish case built on the chart and the broader market, the analyst and prediction-market targets worth knowing, and the honest bottom line on a month that could stay boring or break hard. None of it is investment advice, and XRP’s history of violent moves means every level here can be overrun by a single headline.
The levels that matter
The map begins and ends with $1.00, because no level on XRP’s chart carries more weight. The token trades near $1.14, and the entire near-term structure organizes around the $1.00 to $1.06 support band, where a large concentration of XRP has accumulated and where buyers have repeatedly defended the line. Holding that band is the whole bullish premise; losing it changes the picture entirely.
On the downside, the immediate support sits around $1.08 to $1.10, the near shelf beneath the current price, and below it the decisive $1.00 to $1.06 zone, the floor whose defense has defined the range for months. A clean break below $1.00 would be more than technical; it would puncture the psychological line the entire holder base watches, and would open a path toward the $0.90 area and, if selling accelerated, the low $0.80s that mark the range’s worst case. Because so much rests on the round number, the reaction at $1.00 is the single most important thing to watch on any decline.
On the upside, the first resistance is the $1.18 to $1.20 area, the ceiling that has repeatedly capped rallies and that prediction markets treat as the key line for the month. Above it, clearing the low $1.20s would signal the range breaking upward, with the next meaningful hurdles near $1.30 and then the $1.50 to $1.65 zone that would mark a genuine trend change after months of grinding. The structure, in short, is a coiled range: a heavily defended floor at $1.00, a stubborn ceiling near $1.20, and a token compressed between them waiting for a catalyst, with the legislative calendar the most likely source of one.
The disconnect: strong fundamentals, flat price
The most important thing to understand about XRP right now is why it is not higher, because the bullish fundamentals are real and the flat price is the puzzle. Consider what has accumulated on the positive side of the ledger. Spot XRP ETFs have drawn sustained inflows over a multi-week stretch, real institutional money entering through the creation-and-redemption machinery that turns inflows into spot buying.
Whale accumulation has intensified, with large-wallet activity and exchange outflows rising sharply as big holders move coins into storage, the same accumulation-into-weakness pattern visible across the majors, the tradable float on exchanges falling toward multi-year lows. The legal uncertainty that shadowed XRP for years has resolved. And Ripple has continued stacking institutional wins across payments and custody. By the usual logic, this combination should have driven a substantial move, and it has not.
The explanation is partly that XRP does not trade in isolation. It remains correlated with the broader crypto market, and that market spent the first half of 2026 in a significant drawdown driven by the Federal Reserve and risk-off flows, the same macro pressure that pulled Bitcoin from the $90,000s toward $60,000.
In that environment, XRP’s token-specific tailwinds were fighting a market-wide headwind, and the result was a standoff: the bullish flows defended the floor while the bearish macro capped the ceiling, producing exactly the compressed range the chart shows. It is also partly that the market is waiting for the one catalyst that converts XRP’s fundamental progress into a structural demand shift, the legislative clarity that would unlock the next wave of institutional access, and until that arrives, the accumulated fundamentals sit as stored potential rather than realized price. The disconnect, in other words, is not evidence the bull case is wrong; it is evidence the bull case is waiting for a trigger the calendar has delayed.
The bullish case: flows, float, and the CLARITY catalyst
The case for an upside break rests on three reinforcing pillars. The first is the flow-and-float dynamic. Sustained ETF inflows represent real buying, and they are meeting a shrinking available supply as whales pull coins off exchanges into storage, a classic setup where steady demand meets contracting float and price becomes increasingly sensitive to any demand shock. If the accumulation continues and the float keeps thinning, the conditions for a sharp move higher build quietly beneath the flat price, needing only a catalyst to ignite.
The second pillar is that catalyst: the market-structure legislation. If the bill advances on its revised timeline, it would settle XRP’s regulatory classification in the United States and clear the path for spot ETF conversions and the deeper institutional participation that a defined legal status unlocks, the classification fight whose stakes reach across the entire market.
Because so much of XRP’s institutional demand is gated behind that clarity, its arrival is the specific event that could convert the stored fundamental potential into realized price, and the market’s attention to the legislative calendar reflects exactly that.
The third pillar is seasonal and technical: July has historically been one of XRP’s stronger months, and a token compressed against a defended floor with thinning float is structurally primed for an upside move if any catalyst breaks the range. Combine continued flows, a legislative green light, and favorable seasonality, and the bullish path toward the $1.20 ceiling and beyond becomes credible.
What the legislation would actually change
Because the entire bull case pivots on the market-structure bill, it is worth being precise about what its passage would and would not do, since the market’s fixation on it can blur into vagueness. The bill’s core function is classification: it would define whether a digital asset like XRP is treated as a commodity or a security under United States law, and assign clear jurisdiction between regulators accordingly. That sounds technical, and its consequences are concrete.
A definitive commodity-style classification would remove the regulatory overhang that has kept many institutions on the sidelines, clear the path for spot ETF products and their conversions to proceed without legal ambiguity, and let banks, asset managers, and payment institutions engage with XRP under rules they can actually follow instead of guessing at.
The reason this matters so much for XRP specifically is that XRP’s investment thesis is unusually institutional. Its core use case runs through payments, cross-border settlement, and the regulated financial institutions Ripple has spent a decade courting, which means XRP’s demand is gated behind regulatory clarity to a degree that more retail-driven assets are not.
A bank cannot build on an asset whose legal status is undefined, and much of the accumulated fundamental progress, the custody deals, the payment integrations, the institutional partnerships, converts into actual token demand only once the classification question is settled.
This is why the legislation functions as the swing factor: it is not just another headline but the specific key that unlocks the demand the other fundamentals have been building toward. It is also why a delay hurts more than it would for most tokens, because the stored potential cannot be realized until the gate opens, and every slip in the timeline extends the standoff the chart reflects.
Two caveats keep the analysis honest. First, legislative outcomes are binary and uncertain: the bill could advance, stall, or pass in a weakened form, and the market’s apparent assumption that clarity eventually arrives is a bet, not a certainty.
Second, even favorable passage would not produce instant demand; institutional adoption moves on quarterly timelines, through risk committees and compliance reviews, so the price effect of clarity would likely build over months instead of spiking on the announcement, the same slow procedural cadence that governs every institution’s entry into the asset.
The catalyst is real, in other words, but its payoff is a curve, not a switch, which matters for anyone expecting a single legislative headline to resolve the standoff overnight.
The fundamentals beneath the token
It is worth grounding the bull case in the specific fundamental progress that has accumulated, because the disconnect between that progress and the flat price is the month’s central puzzle. On the institutional side, Ripple has continued building the payments and custody business that gives XRP its distinctive use case, adding banking relationships and settlement integrations that deepen the token’s role in cross-border flows.
On the product side, the regulated stablecoin in Ripple’s ecosystem has grown into a meaningful settlement instrument, and the broader infrastructure around XRP, custody, tokenization, and institutional rails has matured steadily. On the market-structure side, the arrival of spot ETFs gave regulated capital a compliant path into XRP for the first time, and their sustained inflows are the clearest evidence that the demand is real.
The bearish counter to all of this is not that the fundamentals are fake but that they are already priced, or that they matter less than the market believes for a token whose price is ultimately set by supply, demand, and macro sentiment like any other.
A skeptic notes that XRP has a large supply, that some of the accumulated demand may be offset by steady selling from long-term holders and scheduled releases, and that fundamental progress has repeatedly failed to translate into price, which at some point becomes evidence about the relationship itself, not a temporary lag.
Both readings are live, and the honest synthesis is that XRP’s fundamentals have built a loaded setup whose realization depends on a catalyst and a cooperative macro, neither of which the token controls, which is exactly why the price sits where it does: potential energy waiting for a trigger, in a market not yet ready to price it.
The bearish case: the chart and the market
The case for continued weakness, or a downside break, is equally grounded. The first and simplest bearish point is that the range has held for months and the burden of proof is on the bulls: XRP has repeatedly failed to clear the $1.18 to $1.20 ceiling, and a token that cannot break resistance despite a wall of good news is a token whose buyers are exhausted at those levels, which often precedes a move down rather than up.
The disconnect between fundamentals and price cuts both ways, and the bearish reading is that if this much good news cannot lift the price, the selling pressure, much of it from the same steady supply the market must absorb, is stronger than the bulls admit.
The second bearish point is the macro and the legislative risk itself. XRP’s correlation with the broader market means a weak crypto tape, driven by a hawkish Federal Reserve at its late-July meeting or renewed risk-off flows, would pressure XRP regardless of its own fundamentals, and the same drawdown that capped the first half could extend into the summer.
The legislative catalyst is also a double-edged sword: a further delay, a watering-down of the bill, or a disappointing outcome would remove the very trigger the bull case depends on, and a market that has priced in eventual clarity could sell the disappointment, breaking the $1.00 floor and opening the path toward $0.90 and the low $0.80s. The bearish scenario, in short, is that the range resolves downward, either because the macro drags XRP with the market or because the awaited catalyst slips again and disappoints a market tired of waiting.
Three scenarios for July
Pulling the forces together produces three coherent paths for the month, organized around the two levels and the one catalyst.
The base case is the range holding. If the legislation stays in limbo and the macro neither rescues nor crushes risk assets, XRP most likely continues to grind between the $1.00 to $1.06 floor and the $1.18 to $1.20 ceiling, defending the round number on dips and stalling at resistance on rallies, exactly the compression that has defined recent months. This is the highest-probability path absent a catalyst, and it resolves only when the legislation or the macro forces a break.
The bullish scenario needs the catalyst. Advancement of the market-structure bill on its revised timeline, ideally alongside a stable-to-positive crypto tape and continued ETF inflows, could break XRP above the $1.20 ceiling, turn the thinning float into a demand-shock accelerant, and open the path toward $1.30 and the $1.50 to $1.65 trend-change zone. Favorable July seasonality adds a tailwind. This is the path the accumulated fundamentals have been building toward, and it activates on a legislative green light.
The bearish scenario breaks the floor. A hawkish Federal Reserve dragging the whole market down, a renewed risk-off wave, or, most pointedly, another legislative delay or a disappointing outcome could puncture the $1.00 line, trigger the psychological break the entire holder base watches, and open the path toward $0.90 and the low $0.80s. The cruelest version is the catalyst itself disappointing, since a market that has waited months for clarity could sell the letdown hard.
The targets on the table
The forecasts around XRP span an unusually wide range, reflecting the genuine uncertainty of a token waiting on legislation. Prediction-market data leans cautious for the short term, with traders assigning strong odds, around 70%, to XRP closing above $1.20 on the relevant horizon, meaningful odds of a close below $1.00, and only a small probability of a move to $2 or above in the near window, a spread that captures the market’s sense of a range more likely to hold than to break dramatically either way.
On the analyst side, one major bank cut its XRP forecast sharply, from $8 to $2.80, framing the reduction as a return to realism rather than a loss of faith, while maintaining a substantially higher longer-dated target, and the range of published targets runs from sub-$1 bearish cases through low-single-digit base cases to the double-digit forecasts that depend on full institutional adoption playing out.
The spread from a sub-$1 downside to double-digit bull cases is the honest picture, and it maps directly onto the legislative binary: the bullish targets largely assume the market-structure clarity arrives and unlocks institutional demand, while the bearish ones assume continued delay and macro pressure.
For July specifically, the levels matter more than the price targets: the realistic range centers on the $1.00 floor and the $1.20 ceiling, with a break of either level the signal that the standoff has resolved, and the far targets in both directions activating only if the range genuinely breaks.
What to watch as the month unfolds
For a reader tracking XRP through July, the signals worth monitoring are specific and mostly public. The legislative calendar sits at the top: any concrete movement on the market-structure bill, a committee vote, a floor schedule, a revised timeline, is the highest-impact news the token can receive, and its absence is itself information, since continued silence extends the standoff.
The $1.00 line is the second signal, and its behavior on any decline, whether buyers defend it as they have for months or whether it finally gives way, will tell more about the token’s near-term direction than any headline. The $1.20 ceiling is the mirror: a decisive close above it on volume would signal the range breaking upward before most forecasts caught up.
Beneath the levels, three flow-and-context series carry the real story. ETF flows are the clearest demand gauge, and a sustained acceleration or reversal there would move the odds materially. Exchange-reserve and whale-wallet data show whether the float keeps thinning, the quiet structural setup beneath the flat price.
And the broader crypto tape, driven by the same Federal Reserve meeting that dominates the Bitcoin outlook, is the macro backdrop that can override XRP’s own fundamentals in either direction. A reader who watches the legislative calendar, the two levels, and those three series has the full dashboard, and is positioned to interpret the month as it happens instead of reacting to it after the fact. XRP has spent months as a coiled spring; the value of the dashboard is that it shows, in real time, which way the spring is finally releasing.
The honest bottom line
XRP’s July 2026 is a coiled spring waiting for a trigger, and the trigger is on a calendar the market does not control. The token enters the month with genuinely bullish fundamentals, sustained ETF inflows, intensifying whale accumulation, thinning float, and resolved legal risk, all of which have failed to lift it out of a range because a market-wide drawdown has capped it and because the one catalyst that would convert fundamentals into price, legislative clarity, keeps slipping. The result is a compressed range between a heavily defended $1.00 floor and a stubborn $1.20 ceiling, most likely holding until either the legislation advances or the macro forces a break.
The single most useful thing to watch is the legislative calendar, because it is the swing factor that dwarfs the others: advancement toward the revised late-July or August timeline is the specific event that could ignite the accumulated fundamentals, while another delay or a disappointing outcome is the specific risk that could break the floor.
Beneath that, the $1.00 line is the number that matters; its defense the bull case intact and its failure the bear case realized. XRP has spent months proving that good news alone will not move it; July’s question is whether the one piece of news it is actually waiting for finally arrives, and honestly, the calendar, not any forecast, will answer it.
A closing word on the disconnect that runs through this entire outlook, because it is the most important thing for a holder to internalize. It can be maddening to watch a token absorb clearly good news and refuse to move, and the temptation is to conclude either that the news is meaningless or that the price is broken. Neither is quite right. What XRP is demonstrating is the difference between fundamental progress and the specific trigger that prices it, and for an asset whose demand is gated behind regulation, that trigger is legislative, binary, and outside anyone’s control.
The accumulated fundamentals are not wasted; they are stored, and stored potential is exactly what produces the sharp moves that follow long compressions, in either direction. The month ahead is less a question of whether XRP’s fundamentals are good, they are, than of whether the one catalyst they are waiting for finally arrives, and the discipline the situation demands is the patience to watch the calendar and the levels, not the noise, and to let the range’s eventual break, whenever and whichever way it comes, be the signal that the waiting is over.
XRP has been here before, coiled and waiting, and its history is one of long dormancy punctuated by moves that arrive without warning and travel far before anyone adjusts. That history counsels neither confidence nor despair, only readiness: the setup is loaded, the trigger is identified, and the timing belongs to a calendar in Washington, not a chart in a trading app.
Disclaimer: This article is for informational purposes only and does not constitute investment advice. Cryptocurrency markets are highly volatile, and you can lose your entire investment. Price levels, forecasts, and the status and timing of pending legislation reflect information current as of July 9, 2026, and are subject to change; verify current conditions before making any decision. Always do your own research.

Analysts warned that every major Bitcoin drop in 2026 coincided with Japan’s yen defense, backing the claim with charts that mark each intervention against BTC corrections.
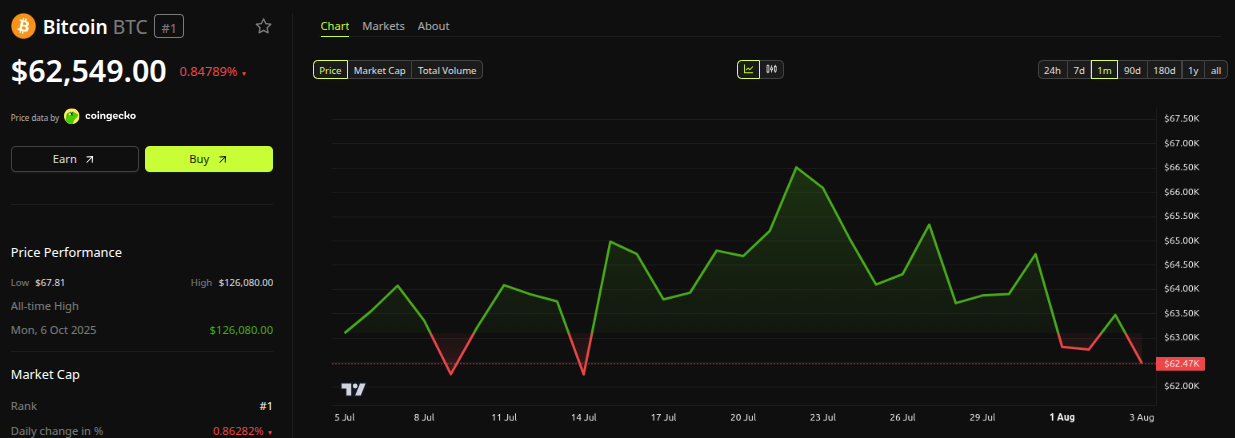
Bitcoin trades near $62,500 as analysts split over whether $50,000 comes next.

Top 3 Bitcoin Corrections That Matched Japan’s Yen Defense in 2026
The yen carry trade involves borrowing the Japanese currency cheaply to invest in higher-yielding assets, including cryptocurrencies. A sharp strengthening forces investors to close those positions.
Popular analyst Crypto Rover published a post overlaying BTC/USDT against the USD/JPY pair. Red circles mark intervention moments, linking them directly to Bitcoin’s declines.
The examples are specific:
- Between late January and mid-February, Bitcoin fell 35.43% alongside a notable move in the currency pair.
- From late April through June 10, the asset corrected by 26.28%, including an intermediate 9.34% drop, again aligned with yen-defense signals.
- The most recent case closed the pattern. Bitcoin faced renewed bearish pressure in late July as the yen approached its 40-year low near 164 per dollar.
Follow us on X to get the latest news as it happens.
Context arrived days later. Both governments officially confirmed a coordinated yen-buying intervention executed last Friday.
The scale was substantial. Japan reportedly spent around $59 billion on recent interventions, according to data from the Bank of Japan. This marks the first joint yen purchase between Tokyo and Washington since 1998, nearly three decades ago.
The bearish case has prominent backers. Another analyst, Ted Pillows, posted on August 2 that $50,000 could materialize if the CLARITY Act fails and the carry trade unwinds.
Ted also flagged a striking figure. The Bank of Japan spent nearly $32 billion during the previous week alone.
Why Some Analysts See the Opposite Outcome
Not every prominent voice shares that pessimism. Michaël van de Poppe called the yen chart the most important one to monitor. Both governments have partnered up to strengthen the currency, changing the calculus for dollar holders.
His argument inverts the logic entirely. If the dollar keeps falling while the yen strengthens, holding dollars carries more risk than it did in the previous period.
That shift would push capital out of government bonds. Liquidity would then flow toward risk assets, with Bitcoin among the primary beneficiaries. Van de Poppe had anticipated this earlier. He wrote that Bitcoin’s bull run would have started if those conditions materialized.
“Monday dump is happening on #Bitcoin. Probably we’ll go slightly lower and then we’ll turn back upwards,” Van de Poppe said on X.
Price context tempers both narratives. Bitcoin slipped below $63,000 in previous sessions and remains nearly 50% below its record high of $126,198, set in October 2025, according to BeInCrypto data.
The debate is now clearly framed. Crypto Rover is bearish, Ted sees a rapid unwind pushing Bitcoin toward $50,000, and Van de Poppe sees the opposite outcome. Orderly yen strengthening paired with a weaker dollar would channel liquidity into Bitcoin instead.
The market stays on alert for now. Bitcoin’s next direction may depend once again on how quickly and how far the yen strengthens.
Subscribe to our YouTube channel to watch leaders and journalists provide expert insights.
The post Is Bitcoin Price Heading to $50,000? Analysts Warn About The Yen Pattern appeared first on BeInCrypto.


Matt Prusak, president and interim chief financial officer of Trump-linked bitcoin miner American Bitcoin (ABTC), is leaving the company to join AI and energy infrastructure developer Giga Energy, marking another senior executive move toward the power sector that is increasingly underpinning both bitcoin mining and artificial intelligence.
Prusak said he will step down from American Bitcoin effective Aug. 4 and join Giga Energy as chief business officer and interim CFO.
He said in emailed comments that after “years building bitcoin businesses,” he was shifting “upstream to the power infrastructure now constraining both mining and AI compute.”
The departure reflects a broader shift as bitcoin miners reposition around AI and power infrastructure. As mining becomes increasingly commoditized and margins come under pressure, a growing number of miners are pivoting toward artificial intelligence infrastructure, repurposing their power, land and data center expertise to serve the surging demand for AI compute.
The shift has accelerated as hyperscalers race to secure electricity and capacity, allowing mining companies to diversify revenue beyond bitcoin production and tap the higher valuations being awarded to AI infrastructure businesses.
Crypto World
California’s diesel prices have jumped since the Iran war started, with ripple effects across the country

California is home to the highest fuel prices in the U.S. as well as the busiest containership port complex in the nation. So as the Iran war enters its sixth month and petroleum-product prices remain elevated, consumers across the U.S. could be hit with higher prices for a host of everyday products.
Nearly one-third of containership imports and exports travel through the San Pedro Bay port complex. In other words, before goods end up on shelves across the nation, they’re first hauled by trucks and trains paying California fuel prices.
Since the war in Iran began, much of the focus has been on oil itself, but experts say petroleum product markets are much tighter — especially when it comes to diesel.
“I think this refining challenge is going to be with the world for a while,” ExxonMobil CEO Darren Woods told CNBC on Friday.
“Even after the Strait opens up, we’ll see more products start to flow through the Strait, which is going to be critically important. But we’ve still got the Russia capacity that’s been lost, and we’ll have to see what the Chinese do with respect to exporting,” he added.
The combination of the war in Iran and Ukraine ramping up attacks on Russian refining infrastructure means the world is now short about 8% of global diesel demand, according to Lipow Oil Associates’ Andy Lipow.
Diesel is sometimes known as the workhorse of the American economy since trucks and trains that transport goods across the U.S. are powered by it. The U.S. is the world’s largest energy producer, but California’s fossil fuel industry has shrunk over the years and refiners have closed. The state also doesn’t have major fuel pipelines that connect it to other parts of the U.S., and has strict environmental regulations, all of which drive up prices at the pump.
The average price for a gallon of diesel in the U.S. is $5.36, according to AAA, but in California it’s $6.92, up from $5.10 prior to the war.
“[A] meaningful share of America’s supply chain pays West Coast fuel prices,” JPMorgan analysts led by Natasha Kaneva said in a June note to clients. “These prices influence freight costs, transportation margins, and ultimately the delivered cost of goods nationwide,” the firm added.
Watch the video above to hear more about how California’s fuel prices trickle through the U.S. economy.
— CNBC’s Macklin Fishman contributed reporting.


Hashdex said it will liquidate its eponymous spot-price Bitcoin exchange-traded fund this month, distributing the cash to all remaining shareholders and selling the fund’s roughly 225 BTC holdings.
In a filing on Monday, the fund issuer said the decision was made after evaluating factors including trading liquidity, operating costs and investor interest. The 200,000 shares, which have traded on NYSE ARCA under the DEFI ticker since March 2024, have net assets of $14.25 million, according to the fund’s website.
Late to the game, which saw the first of 10 other competing BTC ETFs debut months ahead of it, analysts saw opportunity at a time when BTC was trading for the then-all-time high of more than $73,000.
“The getting is so good right now I could see this one getting some bites (if the fee is competitive) despite being so late,” said Bloomberg Senior ETF analyst Eric Balchunas in a March 27, 2024 post.
Originally launched in 2022 as a Bitcoin futures ETF, Hashdex Bitcoin Futures ETF, its highest asset level was $17.54 million, reached on May 9, 2025, according to data tracker SoSoValue. The next largest ETF among the US-traded BTC issues is WisdomTree Bitcoin Trust (BTCW), with $140.37 million in net assets as of Friday’s market close.
Related: Bitcoin may find bear market bottom in August: 10x Research
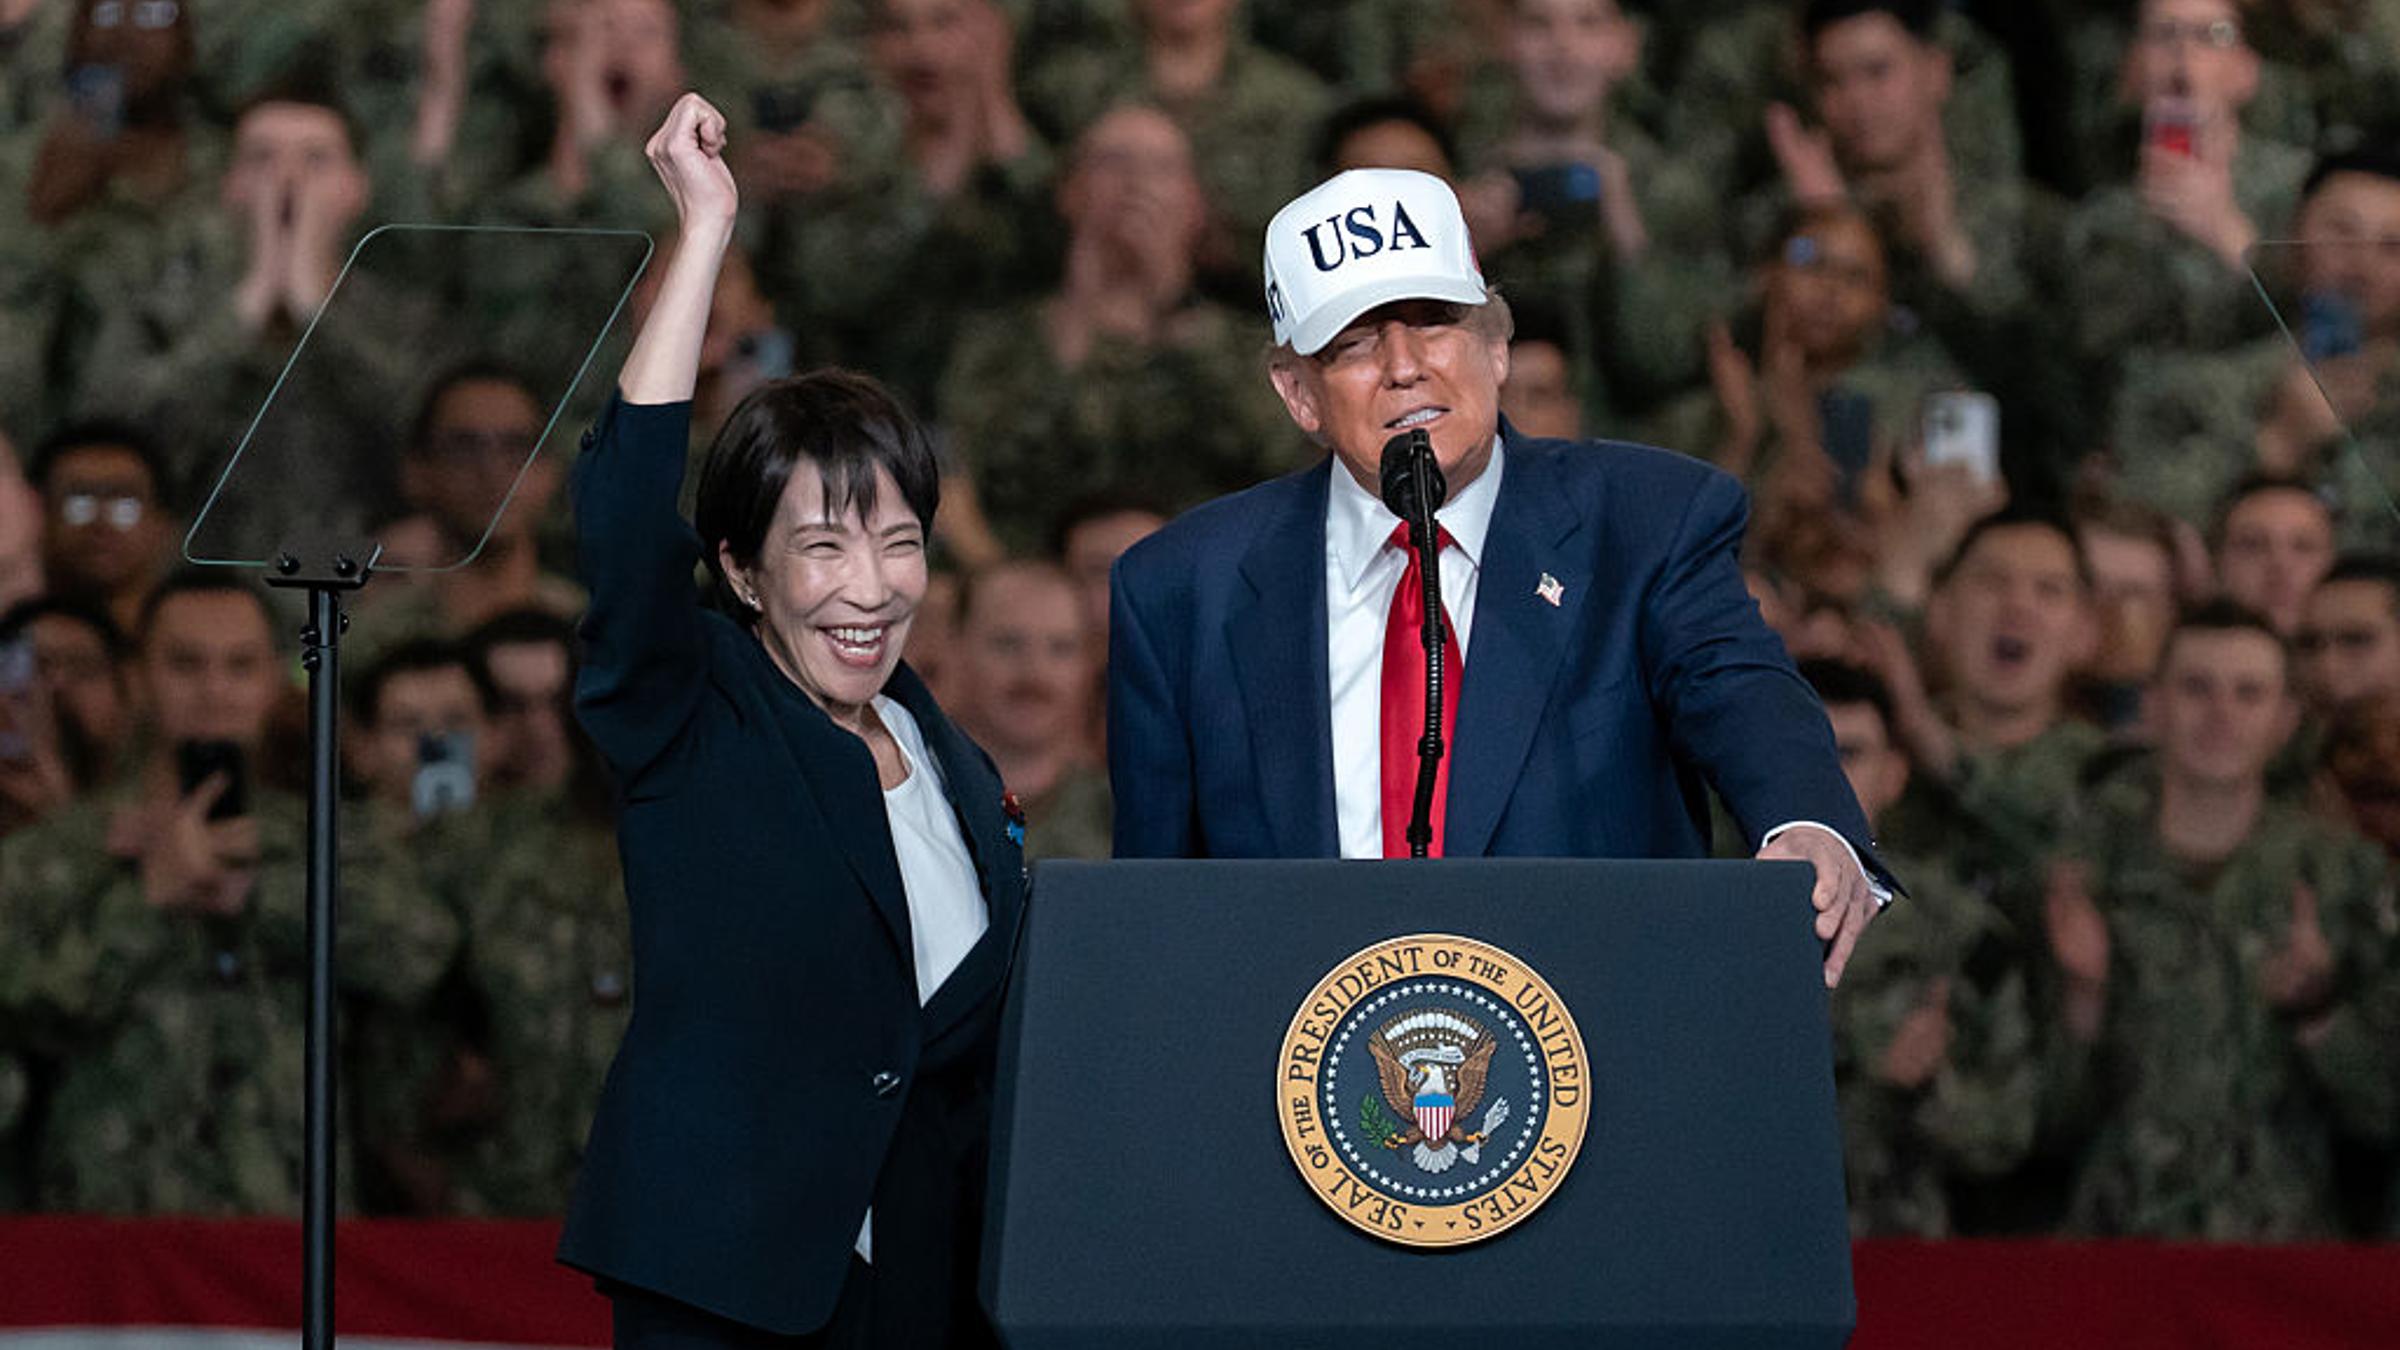
When asked why the United States intervened to support the Japanese currency, U.S. President Donald Trump told reporters aboard Air Force One over the weekend that the U.S. is “always there” for Japan.
“They have a weakening yen, and they wanted a little bit of help,” he said. When questioned over what the U.S. is “getting out of that arrangement,” Trump replied “financial benefit,” but emphasized it’s also “good for the world economy.”
What is behind the fall in the yen?
Japan had already expressed “serious concern” over the yen’s rapid depreciation in March and conducted unilateral intervention between April 28 and May 27.
Despite those efforts, the currency continued to weaken, with the yen sliding to 163.73 per dollar on Thursday before rebounding to 157.57 on Friday.
One reason a stronger yen matters is Japan’s dependence on imported energy. According to the International Energy Agency, Japan remains heavily reliant on imported oil and gas, particularly from the Middle East.
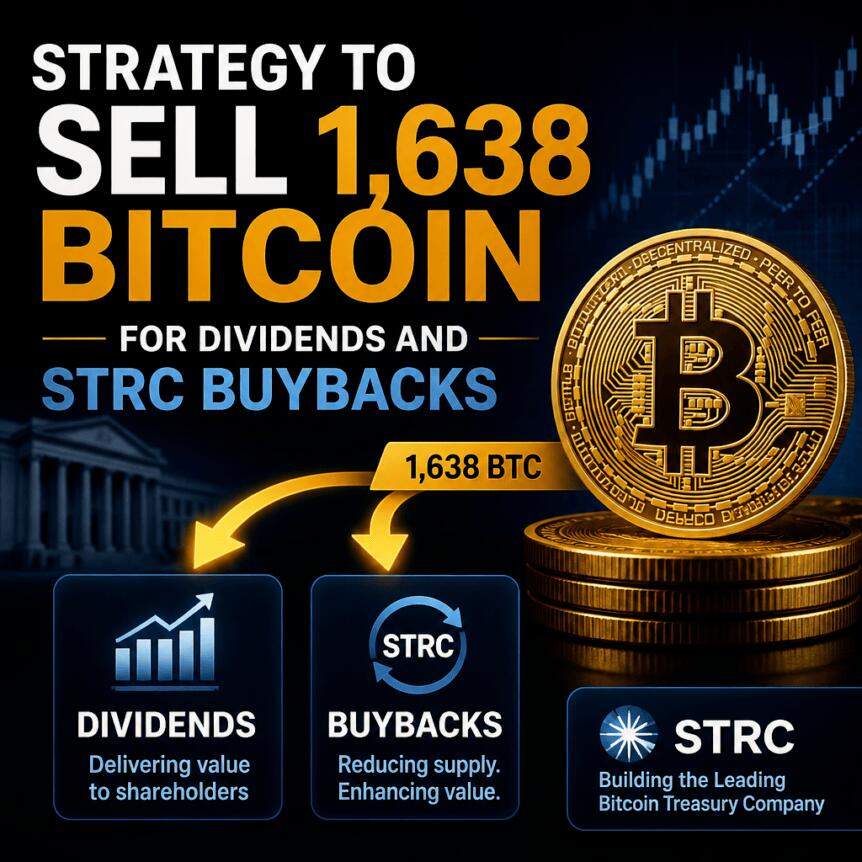
Strategy, the publicly traded Bitcoin holding company formerly known as MicroStrategy and led by chairman Michael Saylor, disclosed another sizable Bitcoin sale in an SEC filing. In the period from July 27 through Sunday, the company sold 1,638 BTC and used the proceeds to support capital-market obligations tied to its preferred stock financing structure.
According to the company’s Monday 8-K filing, the sale totaled $104.7 million at an average price of $63,957. Of that amount, $52.4 million was allocated to dividend payments on its STRC preferred stock, while $52.3 million funded STRC share repurchases.
Key takeaways
- Strategy sold 1,638 Bitcoin from July 27 through Sunday, generating $104.7 million, per an SEC 8-K.
- Dividend funding and STRC buybacks accounted for nearly all sale proceeds, underscoring how Bitcoin liquidity is being used to manage preferred-stock obligations.
- The company says it now holds 842,138 BTC, bought at an aggregate cost of $63.5 billion.
- Strategy also raised $290.6 million through MSTR share sales during the same period, increasing its US dollar reserve to $4 billion as of Sunday.
- STRC trades below its $100 target value—something investors may watch because it can affect the attractiveness and efficiency of future STRC fundraising.
Bitcoin sales feed dividends and STRC repurchases
In the latest disclosure, Strategy characterized the July 27-to-Sunday transaction as one of its larger BTC sales for the year. The company’s filing indicates this was its second-largest Bitcoin sale of 2024.
Crucially, the proceeds were not used for general corporate purposes. Instead, they were split between two items linked to STRC: dividend payments on the preferred stock and STRC repurchases. Together, those allocations amounted to just over $104.7 million, leaving little room for other uses from this tranche.
Strategy’s total Bitcoin balance after the sale stands at 842,138 BTC, with the company reporting an aggregate acquisition cost of $63.5 billion.
How this compares with earlier reported BTC sales
The latest sale follows other previously disclosed events that frame Strategy’s approach to managing its capital structure.
Earlier coverage noted that Strategy sold 3,588 BTC for about $216 million on July 6. The company also disclosed that it sold 32 Bitcoin in early June—its first reported BTC sale since a 2022 tax-loss transaction.
While each sale reduces the company’s Bitcoin exposure, the repeated pattern of tying sale proceeds to STRC-related obligations suggests Strategy is treating Bitcoin liquidity as part of a broader financing and cash-management playbook rather than treating every sale as an isolated departure from its prior accumulation stance.
Cash buffer grows as USD reserve rises to $4 billion
Alongside the BTC sale disclosure, Strategy reported raising additional funds through MSTR share sales during the same period. According to the 8-K, it raised $290.6 million, with multiple allocations.
The filing states that $250 million of the MSTR proceeds was used to increase Strategy’s US dollar reserve, which stood at $4 billion as of Sunday. It also reports that $28.9 million funded STRC repurchases and $11.7 million was added to the company’s cash balance.
In a post on X on Monday, Michael Saylor said Strategy repurchased $81.2 million worth of STRC stock and extended its US dollar “runway” by 57 days to 2.3 years.
STRC trading below target and what that may imply
Strategy’s financing mechanism includes its perpetual preferred stock, STRC. Market data cited in the report suggests STRC was trading at $89.40 during Monday’s pre-market session, or about 10.6% below its $100 target value, according to Yahoo Finance data.
In the same period, the company’s common stock—MSTR—was indicated to have declined roughly 0.9% in pre-market trading, based on Yahoo Finance data referenced in the article.
Trading below STRC’s intended par has potential consequences for Strategy’s capital strategy. If STRC remains below target value, investors may view future fundraising through STRC sales as less efficient for Strategy—because selling preferred stock at a discount typically brings in fewer dollars per unit sold relative to the target. That, in turn, can increase the importance of the company’s dividend policy to attract buyers and provide support to STRC pricing.
Earlier comments from CryptoQuant CEO Ki Young Ju had urged Strategy to pause Bitcoin purchases and replenish cash reserves after dividend coverage deteriorated. In a June 24 X post, Ju said the company should “pause Bitcoin purchases, rebuild cash reserves, and adopt a systematic framework for purchase timing.” Earlier reporting in the same context noted that dividend coverage had fallen to 14 months from seven years.
Strategy has previously responded to these concerns by laying out a framework for capital allocation. A June 29 8-K filing described a capital framework allowing Bitcoin sales to fund dividends, raised the annual dividend rate on STRC preferred stock to 12%, and disclosed that the US dollar reserve had grown to $2.55 billion.
What investors should watch next is whether the new $4 billion USD reserve and the disclosed approach—using Bitcoin sales to service STRC dividends and repurchases—continues alongside STRC trading conditions, particularly how far STRC remains below target and whether Strategy’s dividend and preferred-stock buyback activity accelerates or slows in subsequent filings.
Hashdex will close and liquidate its US-listed Bitcoin ETF, DEFI, after the fund struggled to attract enough assets and trading activity to remain viable.
Summary
- DEFI held approximately $14.7 million in assets as of July 30.
- The fund’s final trading day is Aug. 17, followed by its NYSE Arca delisting.
- Remaining shareholders should receive a cash liquidation payment around Aug. 28.
- Hashdex’s separate $206.8 million NCIQ crypto index ETF remains active.
DEFI will stop trading on Aug. 17
According to a WSJ report, asset management company Hashdex said the Hashdex Bitcoin ETF, which trades on NYSE Arca under the DEFI ticker, will stop trading after the market closes on Aug. 17. The company will then begin liquidating the fund’s assets and delist its shares.
The fund will also stop accepting creation orders from authorized participants after that date. Investors can continue buying and selling shares through their brokers until the final trading session, although market prices may differ from the fund’s net asset value as the closure approaches.
Hashdex attributed the decision to several factors, including the fund’s asset base, trading liquidity, operating expenses and investor demand. DEFI managed about $14.7 million as of July 30, placing it among the smaller US spot Bitcoin products.
The fund’s website listed a net asset value of $71.32 per share and a closing price of $71.15 as of July 31. DEFI normally invests at least 95% of its assets in spot Bitcoin, with the remainder available for cash, cash equivalents, and CME-listed Bitcoin futures.
Shareholders will receive cash after liquidation
Investors who continue holding DEFI shares after the final trading day will not receive Bitcoin. Instead, the fund will sell its holdings and distribute the remaining proceeds in cash after deducting its liabilities and liquidation costs.
Hashdex expects to make the distribution around Aug. 28. The amount shareholders receive will depend partly on Bitcoin’s price while the portfolio is being liquidated, meaning the final payment may differ from DEFI’s net asset value before trading ends.
The liquidation could also create tax consequences for US investors. A cash distribution may be treated as a taxable disposal, depending on the shareholder’s cost basis, account type and individual circumstances.
Investors who sell their shares before Aug. 17 will receive the prevailing market price rather than the final liquidation value. Trading volume and the spread between bid and ask prices could become more important as the fund approaches delisting.
Hashdex faced heavy competition from larger Bitcoin ETFs
DEFI entered the US spot Bitcoin ETF market through a conversion of an existing futures-based product. The fund began holding spot Bitcoin in March 2024, more than two months after the SEC approved the first wave of spot Bitcoin ETFs in January.
That timing placed DEFI behind larger competitors that had already accumulated substantial assets and trading volume. Its relatively small asset base made it harder to compete on liquidity, despite charging a 0.25% expense ratio.
The closure does not signal Hashdex’s exit from the US crypto ETF market. Its separate Hashdex Nasdaq CME Crypto Index ETF, trading under NCIQ, held about $206.82 million in net assets as of July 31.
NCIQ currently provides market-cap-weighted exposure to Bitcoin, Ethereum, XRP, Solana, Cardano, Chainlink, Stellar and Bitcoin Cash. Bitcoin represented 78% of its portfolio as of July 27, while Ethereum accounted for 12.2%.
Hashdex also reduced NCIQ’s annual management fee from 0.50% to 0.25% in March. The fund was renamed from the Hashdex Nasdaq Crypto Index US ETF in January but retained its existing ticker.
DEFI investors face three remaining dates
DEFI shareholders now face a short liquidation timeline. Aug. 17 will be the final day to sell shares on NYSE Arca and the cutoff for new creation orders. Hashdex will then unwind the portfolio before making the expected cash payment around Aug. 28.
Bitcoin price changes during that period will affect the fund’s remaining assets and, in turn, its final distribution. Investors who retain their shares through liquidation should also expect the position to disappear from their brokerage accounts once the cash payment is processed.
The closure applies only to DEFI and does not affect NCIQ or Hashdex’s other crypto investment products.


South Korean cryptocurrency exchange Bithumb said Monday it plans to apply for a preliminary listing review in 2027 and complete an initial public offering in 2028.
Bithumb said it has reorganized its business structure, including spinning off Bithumb Asset, to clarify responsibilities across its business units and reduce potential conflicts of interest ahead of the listing review.
The exchange said its preparations will include upgrading internal controls and shifting from domestic accounting standards to K-IFRS, the international accounting framework used by listed companies in South Korea.
Bithumb said the timetable could change depending on market conditions and the review schedules of relevant authorities.
The exchange is one of five South Korean platforms that support fiat currency trading through real-name bank accounts, offered through its partnership with KB Kookmin Bank.
Bithumb’s listing push comes as rival South Korean exchanges deepen their ties with traditional finance and technology groups. Mirae Asset Consulting took control of rival exchange Korbit on July 23, while Upbit operator Dunamu is pursuing a share-swap deal that would make it a wholly owned subsidiary of Naver Financial, subject to regulatory and shareholder approval.
Related: Kiwoom eyes Bithumb stake as Korean brokerages push into crypto: Report
Bithumb’s 620,000 BTC crediting error
In a February promotional error, Bithumb mistakenly credited customer accounts with balances totaling 620,000 Bitcoin instead of distributing 620,000 Korean won in cash rewards. Bithumb recovered 99.7% of the erroneous credits, though customers sold about 1,788 BTC before accounts were frozen.
At a Feb. 11 National Assembly parliamentary hearing, Bithumb CEO Lee Jae-won said the exchange’s process for checking the planned distribution against its actual holdings had failed and that the promotional amount had not been earmarked in a separate account.
Its IPO preparations also come as two Bithumb-linked listed companies face continuing audit and listing problems. Vidente, a major Bithumb shareholder, and Bucket Studio, which indirectly controls Vidente, have had trading in their shares suspended since March 2023 over audit and other listing issues.
According to Yonhap news agency, Bucket Studio appointed a former police official as its standing auditor in June, while Vidente plans to appoint a former National Tax Service official to the same role. South Korea’s Government Public Service Ethics Committee cleared both hires after finding no close relationship between the officials’ previous duties and their new roles.
Magazine: The 100x obsession: Fundamentals grow in importance as crypto matures
Bitmine Immersion Technologies added 10,399 ETH to its treasury and repurchased another 4.5 million shares, but BMNR stock fell toward $17 as investors weighed its mounting unrealized losses.
Summary
- Bitmine acquired 10,399 ETH, lifting its holdings to 5,797,813 ETH.
- The company now controls about 4.8% of Ethereum’s total supply.
- Bitmine repurchased 4.5 million BMNR shares during its third consecutive week of buybacks.
- BMNR traded near $17.06, with technical indicators showing weak trend strength.
Bitmine’s Ethereum holdings approach 5.8 million ETH
Bitmine said it acquired another 10,399 ETH over the past week, continuing the accumulation strategy it adopted last year. The purchase increased its total holdings to 5,797,813 ETH, equivalent to approximately 4.8% of Ethereum’s circulating supply.
The latest purchase followed Bitmine’s acquisition of 9,946 ETH during the previous week. Together, the transactions added more than 20,000 ETH to the company’s treasury within two weeks.
Chairman Tom Lee linked the continued accumulation to Ethereum’s recent performance against US technology stocks. He said ETH outperformed the Nasdaq 100 by 25% during July, its widest margin since July 2025.
“This is the largest outperformance since July 2025, and we believe it is reflective of the strengthening fundamentals of crypto.”
Lee noted that ETH climbed from $2,375 in July 2025 to $4,057 by the end of the following month. However, past performance does not guarantee that Ethereum or BMNR will repeat that move.
Bitmine has maintained its accumulation strategy despite the broader crypto downturn and the paper losses attached to its holdings. DropsTab estimates that the company has an unrealized loss of approximately $8.8 billion on its Ethereum position.
Staked ETH could generate $247 million annually
Bitmine has also placed most of its Ethereum treasury into staking. The company reported 4,917,189 ETH staked, representing nearly 85% of its total holdings.
At the stated valuation, the staked position is worth about $9.2 billion. Bitmine projects that it could generate approximately $247 million in annualized staking revenue.
Staking provides the company with ETH-denominated income while it holds the asset on its balance sheet. However, that revenue may fluctuate with Ethereum’s staking yield, validator performance and the market value of ETH.
The strategy also means BMNR investors are exposed to several overlapping risks. These include Ethereum price volatility, the company’s cost basis, dilution from capital raises and operational risks associated with staking such a large position.
For US investors, BMNR offers equity-market exposure to Ethereum without requiring direct token custody. Unlike a spot Ethereum exchange-traded fund, however, the stock also carries corporate management, financing and capital-allocation risks.
BMNR buyback enters its third consecutive week
Bitmine repurchased 4.5 million common shares during the past week, marking the third straight week of purchases under its buyback program.
The company has now bought back more than 16 million shares. Management said it considers BMNR attractively valued relative to its assets and long-term Ethereum strategy.
Share repurchases reduce the number of outstanding shares when they are retired, potentially increasing each remaining shareholder’s proportional claim on the company. Their impact depends on the price paid, the source of the funds, and whether new stock issuance offsets the reduction.
Lee argued that periods of strong monthly ETH performance against the Invesco QQQ Trust have historically been followed by BMNR outperforming Ethereum during the next month. That relationship remains a company observation rather than a guarantee of future returns.
The buyback may provide some support for BMNR, but investors have yet to respond positively to the latest Ethereum purchase and repurchase announcement.
BMNR stock struggles with resistance near $17.15
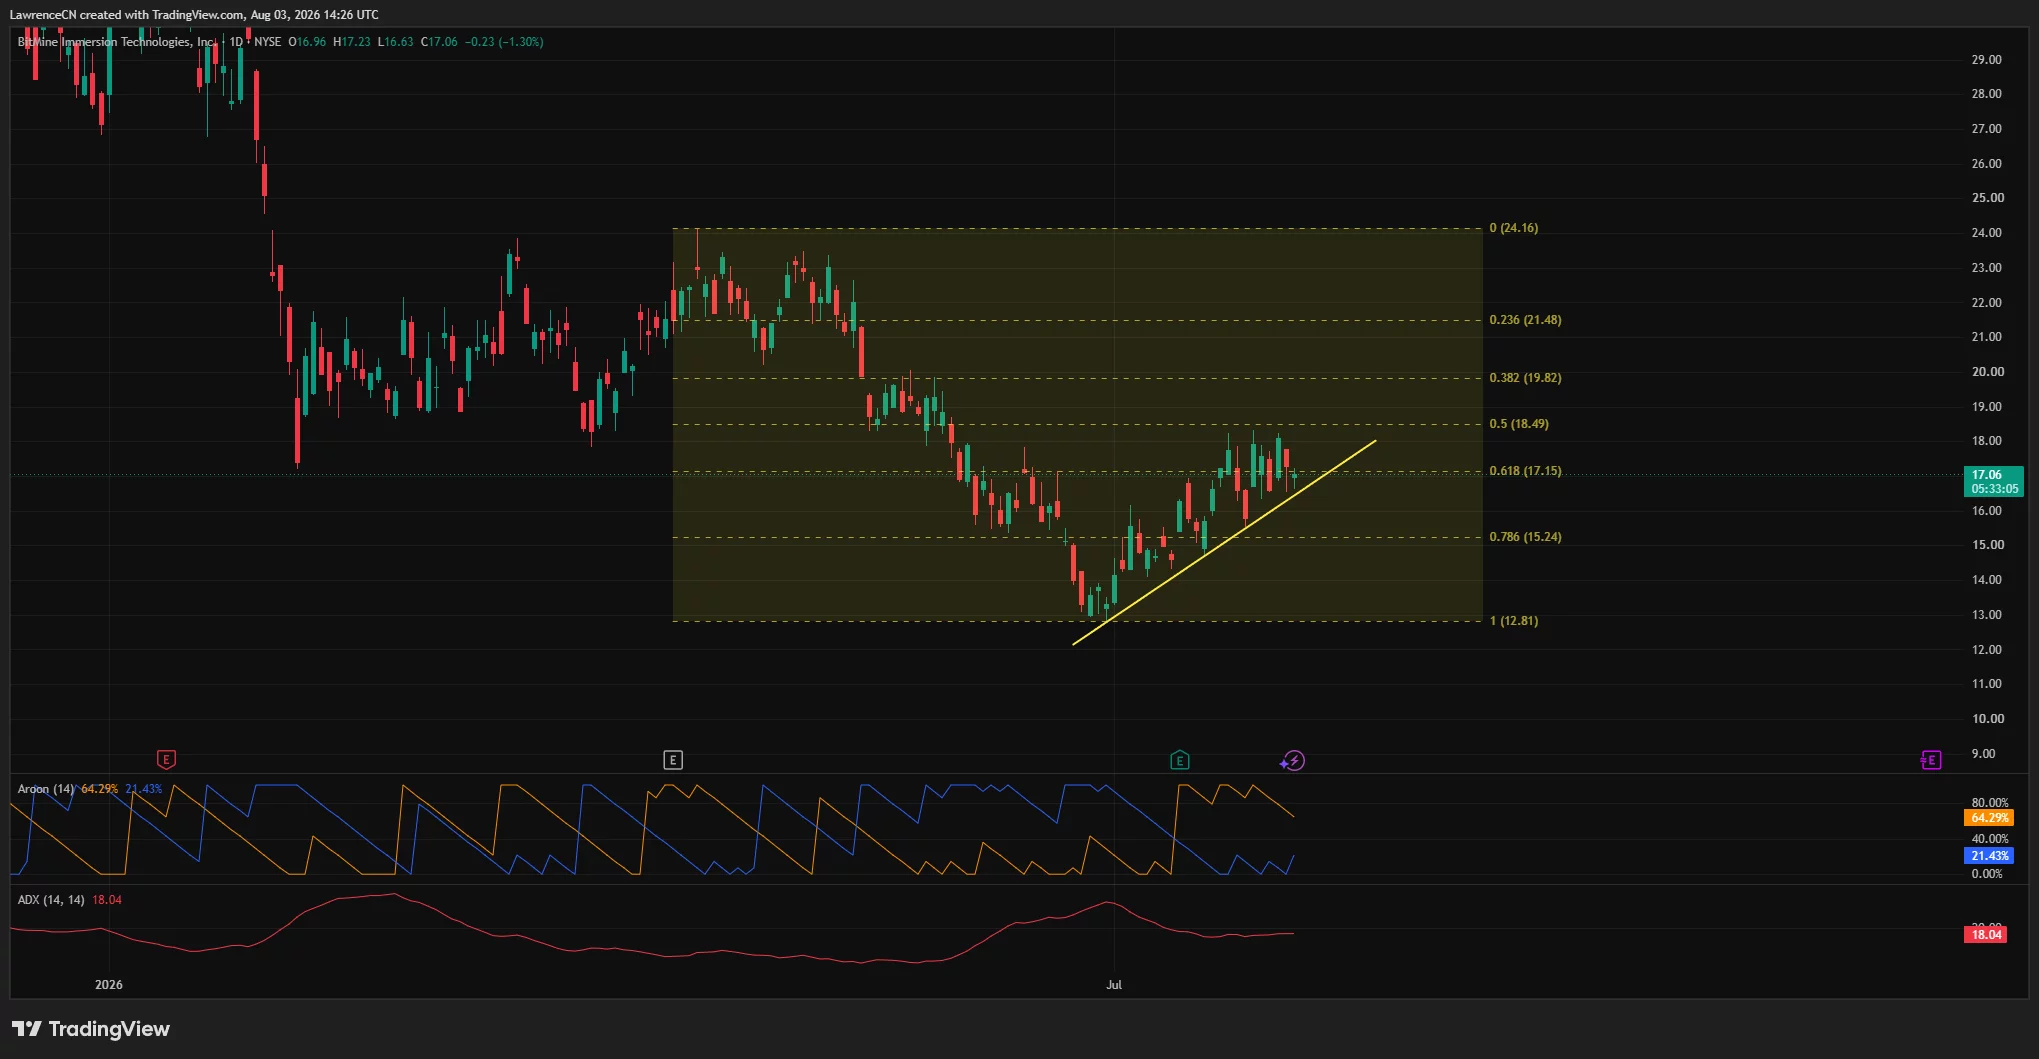
BMNR traded near $17.06 on Aug. 3, falling about 1.3% on the daily chart. The stock recorded an intraday high of $17.23 and a low of $16.63.
BMNR price is testing the 61.8% Fibonacci retracement at $17.15, which is acting as the immediate resistance level. A daily close above that mark could allow BMNR to challenge $18.49, corresponding to the 50% retracement level.
The next resistance sits at $19.82. A stronger recovery beyond that level could bring $21.48 into focus, although the stock would need greater momentum and trading volume to sustain such a move.
BMNR remains above an ascending trendline drawn from its June low near $12.81. That structure suggests the short-term recovery has not failed, but the stock has struggled to build momentum above $17.
Aroon readings of 64.29% and 21.43% favor the recent recovery attempt. However, the average directional index stands at 18.04, below the commonly watched 20 threshold, indicating that the prevailing trend remains weak.
A rejection at $17.15 could send BMNR back toward the rising trendline around $16. Stronger support sits at the 78.6% Fibonacci level of $15.24. A decisive break below that area would weaken the recovery structure and increase the risk of another test of $12.81.
Disclosure: This article does not represent investment advice. The content and materials featured on this page are for educational purposes only.

Bitcoin begins the first full week of August trading around the $63,000 area as traders look past a difficult macro calendar and focus on a fresh, ongoing catalyst from within the crypto ecosystem. Sentiment is being tested by the fallout from a Coldcard wallet hack, while broader markets await key US data and geopolitical signals that can swing risk assets.
At the same time, investors are weighing whether August will follow the bearish script that has marked prior cycles. Even with July ending higher, analysts point to technical resistance and liquidation zones that could amplify downside if momentum fades.
Key takeaways
- Bitcoin is hovering near $63,000 as traders digest the continuing Coldcard hardware wallet incident and its effects on flows.
- Crypto market participants say US nonfarm payrolls—due Thursday—may drive volatility depending on how labor strength and unemployment evolve.
- Oil prices slid after President Donald Trump signaled potential movement on an Iran-related deal, adding to macro uncertainty for risk assets.
- Long-term holder behavior appears consistent with accumulation, even as near-term traders warn that resistance could keep August pressured.
- CoinGlass and other technical observers highlight the 50-month EMA around $65,827 as a key barrier, while derivatives positioning points to liquidation risk near $64,200.
Why Treasury and FX policy still matters to crypto
The week’s macro backdrop is shaped not only by upcoming US economic releases, but also by renewed attention to how dollar liquidity and Treasury market stress can spill into global financial conditions. According to QCP Capital, the US and Japan executed a rare coordinated foreign-exchange intervention last week, designed to support the yen after it neared levels around 164 per USD, based on TradingView data.
QCP Capital emphasized that the operation’s mechanics matter: the New York Fed acted as a fiscal agent using the Federal Reserve’s Foreign and International Monetary Authorities (FIMA) repo facility, rather than reflecting a Federal Reserve monetary-policy decision. In QCP’s view, that distinction highlights how institutions outside the FOMC can still move liquidity and influence broader conditions.
Further, industry commentary cited a desire to reduce the risk of Japan selling large quantities of US Treasuries, which could otherwise disrupt the dollar environment. Louise Loo of Oxford Economics told CNBC that volatile conditions tied to potentially fiscally aggressive policies in Japan could extend into US Treasury markets, destabilizing the dollar.
In a post on X, Treasury Secretary Scott Bessent also argued the FIMA facility could be used again, describing it as an “important backstop” and encouraging that it be “upsized” in coming months. For crypto traders, the practical takeaway is that interventions affecting FX and Treasury-market liquidity can quickly shift risk appetite—often before any direct crypto-specific news lands.
US payrolls, oil, and the Iran signal: the risk-asset checklist
For digital-asset markets, the next major swing factor is Thursday’s nonfarm payrolls release. Earlier in this cycle, weaker-than-expected labor numbers put pressure on expectations for how aggressively the Federal Reserve might move on rates, a dynamic that coincided with a reaction in Bitcoin when June payroll data came in well below forecasts, as Cointelegraph previously reported.
Market positioning for Thursday remains mixed. Continuum Economics, for example, expects July nonfarm payrolls to rise by 120k overall (and 110k in the private sector), while also projecting unemployment will edge up to 4.3% from 4.2%. The firm’s forecast also notes average hourly earnings rising by 0.3% in line with its trend, according to its published preview.
Beyond labor data, traders are monitoring signals related to US-Iran de-escalation. On Sunday, President Donald Trump posted on Truth Social that he had agreed to cancel further strikes on Iranian territory “subject to being able to rapidly make a DEAL,” adding language about potential opening of the Strait of Hormuz and an end to Iran’s nuclear threat. Oil responded quickly, with both WTI and Brent down by more than 8% on Monday.
For crypto markets, the relevance of oil is straightforward: sustained moves in energy prices often feed into inflation expectations and, by extension, interest-rate expectations. When the path of rates is uncertain, risk assets—including Bitcoin—tend to trade with sharper sensitivity to macro surprises.
Coldcard hack: exchange inflows rise, but not in an outsized way
On the crypto side, one of the most immediate concerns remains the Coldcard wallet hack. Earlier coverage cited a “low-entropy bug” in Coldcard hardware wallets, with theft activity continuing for multiple days. Galaxy Research’s Alex Thorn advised Coldcard users to move funds “ASAP” and suggested using higher transaction fees to reduce the time spent interacting with the wallets.
Yet exchange flow data suggests the reaction is not turning into a broad, panic-driven transfer into trading venues. According to CryptoQuant, net exchange inflows were 34,932 BTC on Friday and 8,768 BTC on Sunday. CryptoQuant’s data framing indicates the inflow volume, while meaningful on certain days, aligns with typical levels seen during the month rather than representing a one-off liquidation wave.
What did change more noticeably was the number of inbound transactions. CryptoQuant data shows exchanges received 31,217 inbound BTC transactions on Friday, dropping to 19,537 on Sunday. CryptoQuant head of research Julio Moreno attributed the influx mainly to transactions between 1 and 10 BTC, which he said had their highest daily total since early February.
Separately, CryptoQuant reported that on a rolling 30-day basis Bitcoin long-term holders remain in a broad accumulation phase. In its analysis, the BTC LTH Accumulation & Distribution indicator showed LTH supply inflow around 220.4K BTC, implying ongoing inflow into long-term holdings outweighs distribution back to the market.
That combination—exchange activity rising in transaction count, but long-term holders still accumulating—suggests the market is processing the incident through behavior that is more nuanced than a simple rush to sell.
August caution: resistance levels and leverage-built downside
Even as Bitcoin finished July about 7.4% higher, traders are preparing for a difficult August. CoinGlass data shows monthly performance for BTC/USD came in slightly below its 2025 result, but the broader narrative remains that downside pressure can return during August, consistent with patterns some analysts associate with prior midterm-era behavior.
Rekt Capital pointed to the 50-month exponential moving average as an ongoing ceiling, stating on X that the 50-month EMA continues to act as resistance. That level is near $65,827, and the expectation is that repeated rejections could set up further downside continuation.
Derivatives positioning adds another layer of near-term risk. CoinGlass data tracking clusters of high-leverage BTC bets highlighted $64,200 as a potential area where forced liquidations could occur if price moves higher against leveraged positions.
On the other end of the spectrum, quant analyst David Eng described Bitcoin as “sitting on its long-term statistical floor” around $63,000, referencing a power law framework that expects price to grow as a power of time. While such models do not guarantee short-term price direction, they help explain why some participants remain willing to accumulate near specific long-horizon reference points.
With long-term holders accumulating quietly while near-term technicals and leverage maps warn of friction, the next macro prints and any follow-through from the Coldcard incident will likely determine whether August breaks from prior weakness—or extends it.
Traders should watch Thursday’s nonfarm payrolls for cues on rates and risk appetite, while also tracking whether Coldcard-related wallet activity continues to translate into exchange selling or stays contained to transaction-level spikes; the answer could shape how quickly Bitcoin sheds or absorbs this month’s technical pressure.

Box Office: ‘Spider-Man: Brand New Day’ swings record North American opening weekend
EasyJet aligns Apollo and Castlelake deadlines as bidding war nears climax

Is Bitcoin Price Heading to $50,000? Analysts Warn About The Yen Pattern


-

 Business5 days ago
Why Trees Belong on the Risk Register
-

 Fashion3 days ago
Weekend Open Thread: Wit & Wisdom
-

 Politics3 days ago
Meta enters AI-training agreement with far-right ‘propaganda rag’ Newsmax
-
 Entertainment6 days ago
‘Stargate’ Creator’s New Sci-Fi Series Returns for Season 3 Tomorrow
-
 Crypto World2 days ago
MicroStrategy Post-Earnings CLARITY Act Push Could Add New Catalyst for Its Stock
-

 Politics6 days ago
The Part of the Electric Transition Nobody Wants to Discuss
-

 Business5 days ago
Major shareholder moves on Canyon
-

 Crypto World2 days ago
XRP Ledger v3.3.0 brings five institutional features
-

 News Videos4 days ago
Bitcoin Enters the 3rd Stage of the Bear Market
-

 Crypto World6 days ago
Kraken Enables Retail Access to Jersey Mike’s IPO via Tokenized Shares
-

 Tech7 days ago
New macOS Sequoia & Sonoma security updates for older Macs
-

 Politics4 days ago
Luke Littler’s dominance sparks GOAT debate
-

 News Videos6 days ago
Claude: Build Financial Dashboards in Minutes (2026)
-

 Business6 days ago
Johnson & Johnson agrees to $5.5B settlement over talc cancer claims
-

 Sports4 days ago
Seema Kaliramna Wins Discus Throw Bronze, Takes India’s CWG Medals Tally To 17
-

 Crypto World1 day ago
Crypto PAC spending tops $2M in Michigan House race
-

 Business3 days ago
Trump Announces Hamas Disarmament Agreement as Iran Strikes Kuwait Air Base and US Attacks Pause Overnight
-

 Crypto World3 days ago
New York sues Kalshi over prediction market gambling
-

 Tech5 days ago
Gemini can now summarize the messiest comment threads in Google Docs
-

 Tech1 day ago
ESET tracks rise in malicious AI skills and adaptable malware
You must be logged in to post a comment Login