
Crypto World
XRP price tests $1.06 as open interest hits six month low

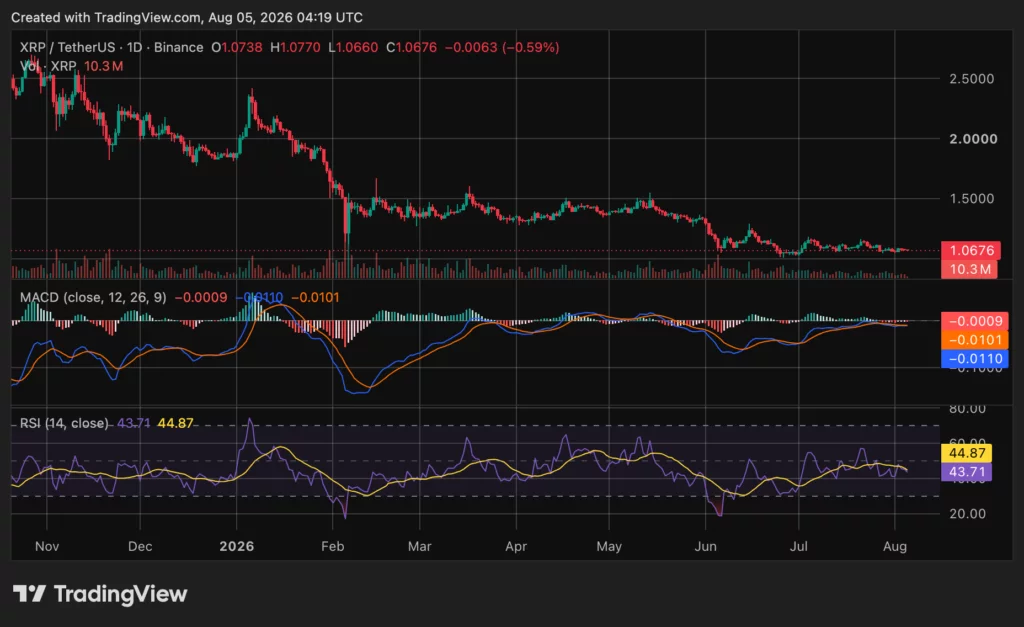
XRP extended its decline on Aug. 5, 2026, trading near $1.07 as buyers struggled to move the token away from its lower range.
Summary
- XRP trades near $1.07 as weak momentum keeps the token pinned above crucial technical support.
- CoinGlass data shows open interest near $2.25 billion after leveraged positions continued unwinding across exchanges.
- CryptoQuant sees balanced liquidations and neutral funding, suggesting positioning reset rather than forced capitulation currently.
- U.S. spot XRP ETFs reportedly logged four consecutive inflow days despite the token’s weak price.
- A sustained break below $1.05 could expose $1.00, while $1.10 remains the first recovery hurdle.
crypto.news data showed XRP down about 0.9% over 24 hours, with trading volume near $911.7 million and market capitalization around $66.7 billion. XRP remained the sixth largest cryptocurrency.
The decline left XRP close to the $1.05 to $1.06 area that has repeatedly attracted buyers since late June. However, momentum indicators, spot flows and derivatives positioning offer little evidence of a confirmed recovery.
The current setup is not a typical liquidation collapse. Leverage has declined, funding remains close to neutral and liquidations have been relatively balanced. These conditions may reduce the risk of an immediate forced selloff, but they also show that traders have limited conviction in a rebound.
XRP price remains trapped near its lower range
The supplied XRP/USDT daily chart shows a broad decline from above $2.50 to around $1.0676. Recent candles have formed a narrow consolidation close to the bottom of that move. XRP has not established a sustained recovery above $1.10, leaving the short term structure weak.
The relative strength index stood at 43.71, below both the neutral 50 level and its moving average of 44.87. The reading shows that buying momentum remains limited, although XRP has not entered deeply oversold territory on the daily chart.
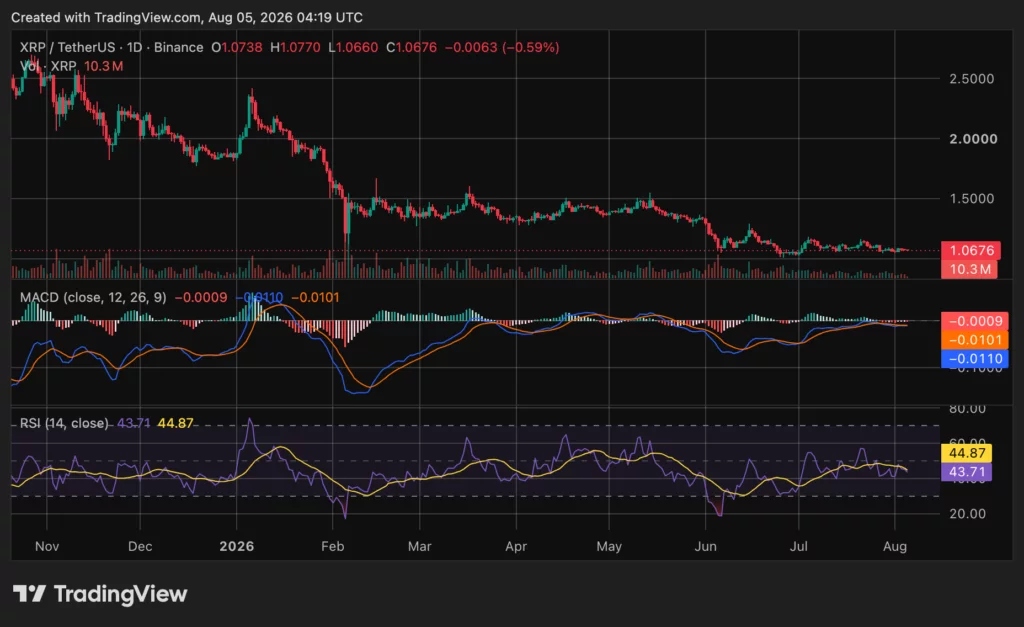
MACD also remains mildly bearish. The MACD line was near negative 0.0110, below the signal line around negative 0.0101. The histogram remained slightly negative at about negative 0.0009. The small difference between the lines points to weak downside momentum rather than a sharp acceleration.
The immediate technical test sits between $1.05 and $1.06. A daily close below that range could expose the psychological $1 level and the late June lows around $1.01. XRP briefly broke the $1.05 area on July 28 before buyers returned. The earlier decline also pushed the four hour RSI into oversold territory, but that reading did not create a lasting reversal.
A recovery above $1.10 would provide the first evidence that buyers are regaining control. XRP would then need to clear the $1.13 to $1.15 region, which has repeatedly limited advances since June.
Analyst Ali Charts described $1.06 as the deciding level. His upside estimates of “$1.35 and $1.64” depend on XRP holding support and confirming a recovery. His downside levels of “$0.80 and potentially $0.62” require a clear breakdown. Neither path has been confirmed.
Other social media forecasts calling for “$23” or “$50+” are highly speculative. Those targets sit far above the current price and are not supported by present momentum, verified institutional forecasts or an established breakout structure.
Lower leverage points to a quiet positioning reset
CoinGlass data showed XRP futures volume near $1.35 billion and total derivatives open interest around $2.25 billion at the time of reporting. The price on the platform stood near $1.067. The supplied data snapshot showed volume falling 10.27% and open interest declining 5.59% over 24 hours.
Falling price and falling open interest usually mean traders are closing positions rather than adding aggressive new shorts. This can reduce the fuel available for large liquidation driven moves. It does not, however, establish that spot buyers are ready to take control.
A separate CryptoQuant analysis found that its XRP open interest measure had fallen into a six month range low between 362 million and 369 million. The estimated leverage ratio also declined toward 0.139 to 0.142, close to the lowest reading during the same period.
CryptoQuant contributor CryptoOnchain also noted that funding remained between roughly negative 0.009 and positive 0.010 during the latest decline. Long and short liquidations alternated rather than producing a one sided cascade. The analyst interpreted the structure as a positioning reset rather than forced capitulation.
Network valuation also compressed faster than reported transaction activity. CryptoOnchain said the network value to transactions ratio fell 42.7% compared with its three month average, while transaction count declined 23.3%. This may indicate that market valuation weakened faster than ledger usage, but it does not provide a reliable timing signal for a price reversal.
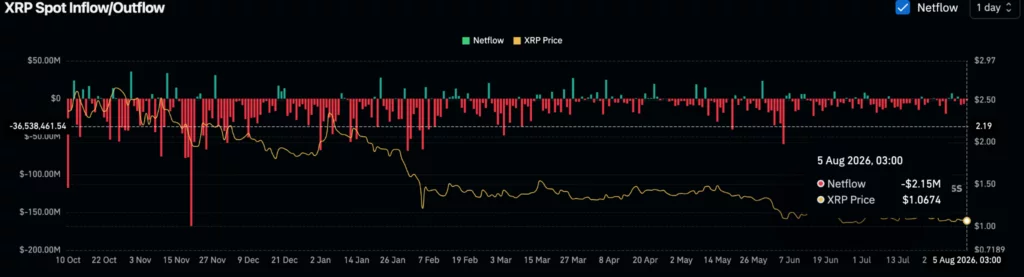
The supplied CoinGlass spot flow chart recorded a net outflow of about $2.15 million on Aug. 5. Recent negative readings have been smaller than the large outflow spikes recorded in late 2025. Selling pressure appears less intense, but sustained positive flow would offer stronger evidence that demand is improving.
U.S. XRP demand has not produced a breakout
U.S. spot XRP exchange traded funds have continued attracting capital despite weak price performance. Recent flow data reportedly showed four consecutive inflow sessions totaling about $15.4 million.
XRP nevertheless remained near $1.08 during that period, showing that the purchases were not large enough to overcome selling elsewhere in the market.
As crypto.news reported in an earlier analysis, five U.S. spot XRP funds launched between November and December 2025 and had attracted roughly $1.5 billion by mid 2026. The funds created a new regulated source of demand, but XRP remained confined to a range around $1.00 to $1.13.
This divergence suggests that ETF inflows alone have not been enough to change the wider trend. Fund purchases must compete with token sales, exchange activity, derivatives hedging and weaker demand across offshore spot markets.
Regulated derivatives activity provides another U.S. market signal. CME Group data showed activity across its standard XRP futures contracts, while the settlement page listed prior day open interest of 6,894 contracts. CME contract data cannot be compared directly with CoinGlass totals because the products use different contract sizes and reporting methods.
The legal risk surrounding Ripple has also changed. The SEC and Ripple dismissed their appeals in August 2025. The district court’s final judgment remained in force, including a $125.04 million penalty and an injunction concerning future registration violations. The dismissal removed the active appeal, but it did not erase the court’s findings involving Ripple’s institutional sales. The SEC litigation release confirms that status.
Wider U.S. legislation remains unresolved. The CLARITY Act has reached the Senate calendar, but it still requires sufficient floor support, reconciliation with other legislative text and presidential approval. Seven Democratic senators said in July that the Republican proposal still fell short on several matters, and no final Senate vote had been confirmed by Aug. 5.
A confirmed vote or renewed delay could influence sentiment toward XRP and other U.S. traded digital assets. It would not, by itself, guarantee a sustained price move.
Ripple developments have not changed near term momentum
Ripple announced strategic investments in ZILO and Licuido on Aug. 3. The companies plan to add transfer agency, token issuance, trading and collateral tools to Ripple’s institutional infrastructure on the XRP Ledger. Ripple did not disclose the investment amounts or financial targets. The official company announcement described RLUSD as a settlement asset for tokenized fund transactions.
As crypto.news reported in related coverage, the investments support Ripple’s broader move into tokenized capital markets. They have not yet produced disclosed revenue, transaction volume or XRP demand that can be tied directly to the token’s price.
The XRP Ledger also faced a validator manifest flood in late July. Developers released xrpld version 3.2.1 to restrict the processing and storage of untrusted manifests. The ledger continued closing normally, and no confirmed loss of funds or altered transactions was reported. Node operators were urged to install the update.
The next price signal will likely come from the market itself. Traders will watch whether XRP can hold $1.05, reclaim $1.10 and build stronger volume above $1.15. Open interest should also stabilize without price making new lows. Continued ETF inflows would be more constructive if they coincide with positive spot flows and stronger momentum.
A break below $1.05 would keep $1.00 exposed. A confirmed daily recovery above $1.15 would weaken the immediate bearish structure. Until either event occurs, XRP remains in a low conviction range with reduced leverage and limited bullish confirmation.
FAQs
Is XRP oversold?
Not on the supplied daily chart. Its RSI near 43.71 remains below neutral but above the conventional oversold level of 30. Shorter time frames have reached oversold readings during recent declines, although those readings did not confirm a lasting bottom.
Does falling open interest support an XRP recovery?
It can reduce liquidation risk because fewer leveraged positions remain open. A recovery still requires stronger spot demand, improving momentum and price confirmation above resistance.
Why have XRP ETF inflows not lifted the price?
ETF demand represents only one part of the market. It can be offset by direct token selling, hedging, weak offshore demand and distributions from existing holders.
What are the main XRP levels to watch?
The immediate support range is $1.05 to $1.06, followed by $1.00. Initial resistance sits near $1.10, with stronger confirmation required above $1.13 to $1.15.
Disclosure: This article does not represent investment advice. The content and materials featured on this page are for educational purposes only.


Bitcoin activity has surged sharply over the past week, with 712,000 addresses active in the past seven days, according to Santiment’s findings. That marks a three-month high.
Whale activity also hit a five-month high. 61,800 transactions worth more than $100,000 were recorded during the period.
Coldcard Fallout Drives Network Activity
Santiment flagged the recent security incident involving Coldcard hardware wallet as the obvious catalyst behind the rise in activity. Reports linked the late-July attacks to weak keys generated by affected devices. Santiment estimates losses at above 2,055 BTC, or about $130 million. It said affected users rushed to move funds, consolidate wallets and reduce their exposure.
Meanwhile, Galaxy Research identified that the tokens were stolen from 7,300 addresses across three confirmed waves of attacks. It also found 14 smaller security incidents. The firm also said the exploits linked to an issue affecting seeds generated on Coinkite’s Coldcard Mk3, Mk4, Mk5 and Coldcard Q firmware versions.
Coinkite later released emergency firmware updates for all affected models and confirmed destroying the remaining vulnerable inventory. The issue became public on July 30. The incidents appeared to involve automated, programmatic sweeps, with possible assistance from large language models.
Galaxy Research said it suspects the losses could be higher if a potential fourth wave of attacks is confirmed. The firm, however, did not receive specific confirmation from victims.
Santiment also warned that Bitcoin volatility could remain elevated over the next few weeks. Fear could push retail investors to sell. At the same time, continued whale accumulation and “security-driven” movement of coins could reduce liquid supply over the coming months if stronger holders continue absorbing the panic.
Cash-Out Hurdles
The stolen Bitcoin may not be easy to turn into cash, Trace Finance co-founder and CTO Leone Parise told CryptoPotato. On the monetization prospects of the stolen funds, Parise said,
“Not at anything close to face value. These are the most heavily surveilled UTXOs in BTC’s history: dormant for years, then moved in a burst, which is exactly the kind of signature that makes clustering trivial. Bitcoin can’t be frozen, but every regulated on-ramp can refuse these coins.
That leaves mixers, cross-chain bridges, OTC desks in weak jurisdictions, and peer-to-peer channels, all of which cost real money and introduce counterparty risk. They’ll extract a fraction, over years, with heavy leakage. $100M on-chain is not $100M in the bank.”
The post Bitcoin (BTC) Whales Are Moving Big as Coldcard Chaos Sends Shockwave appeared first on CryptoPotato.


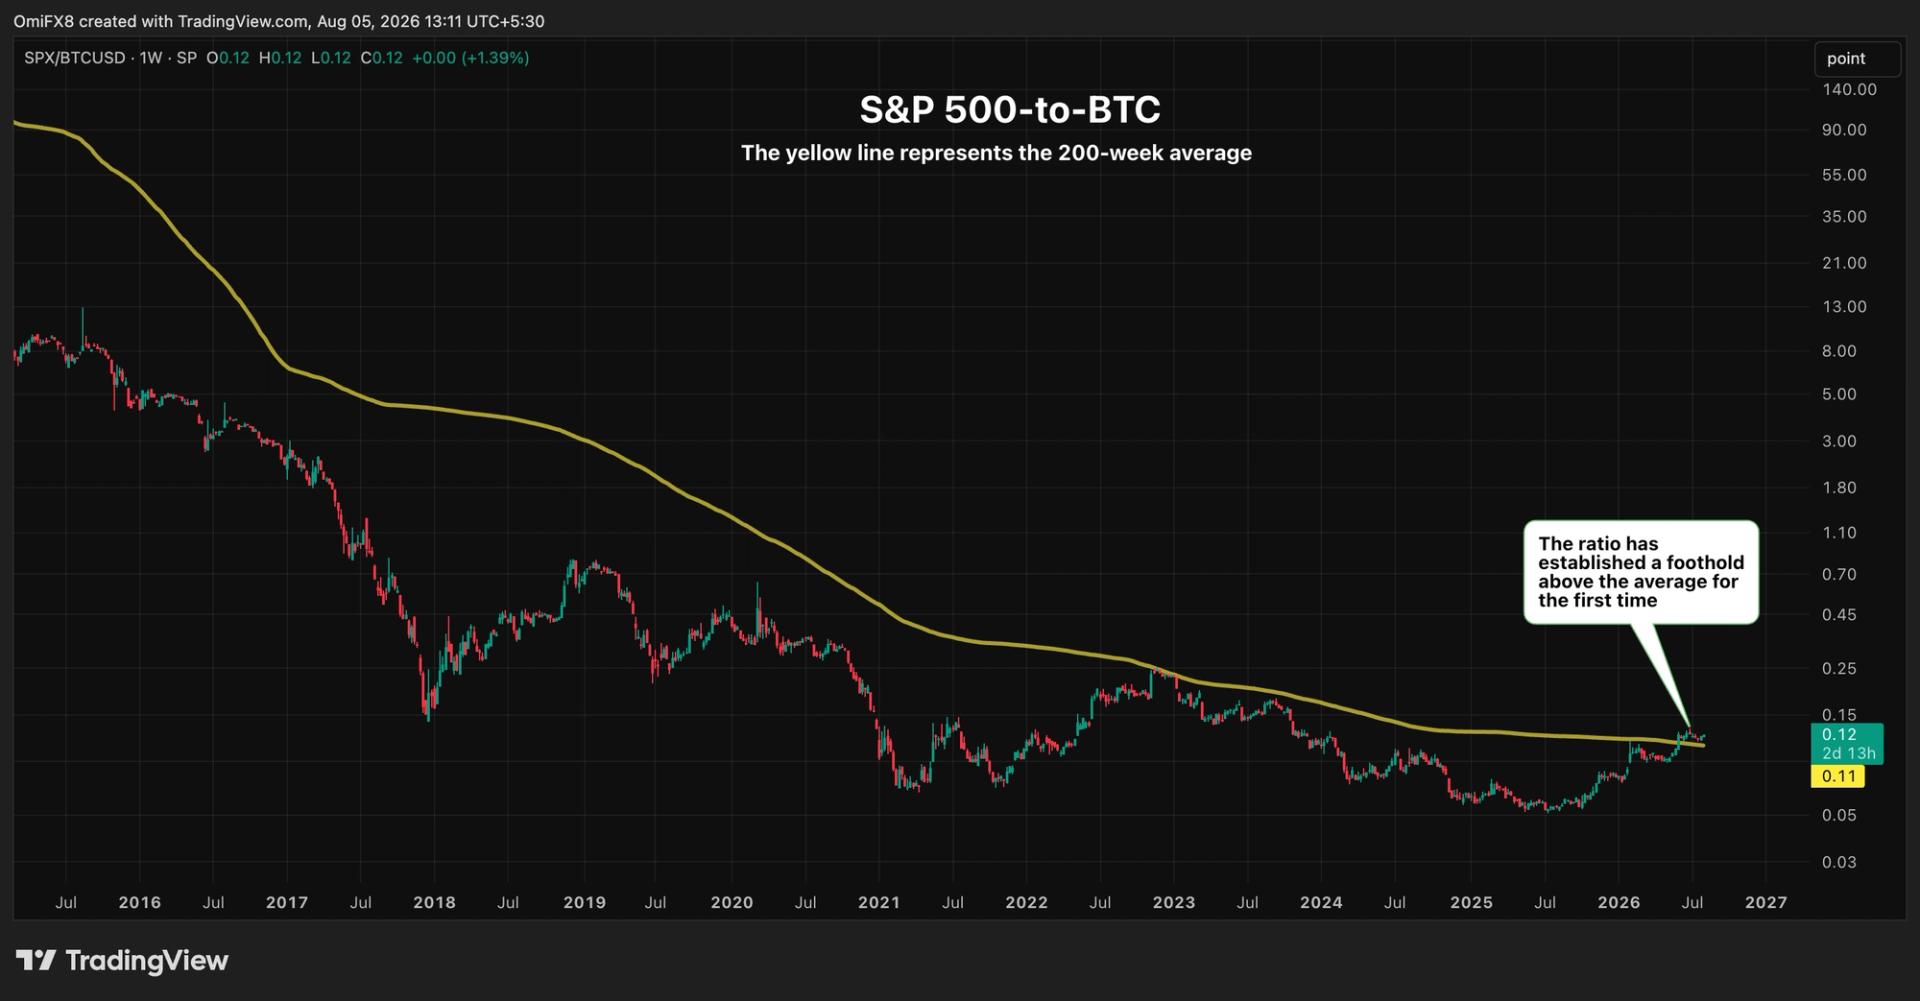
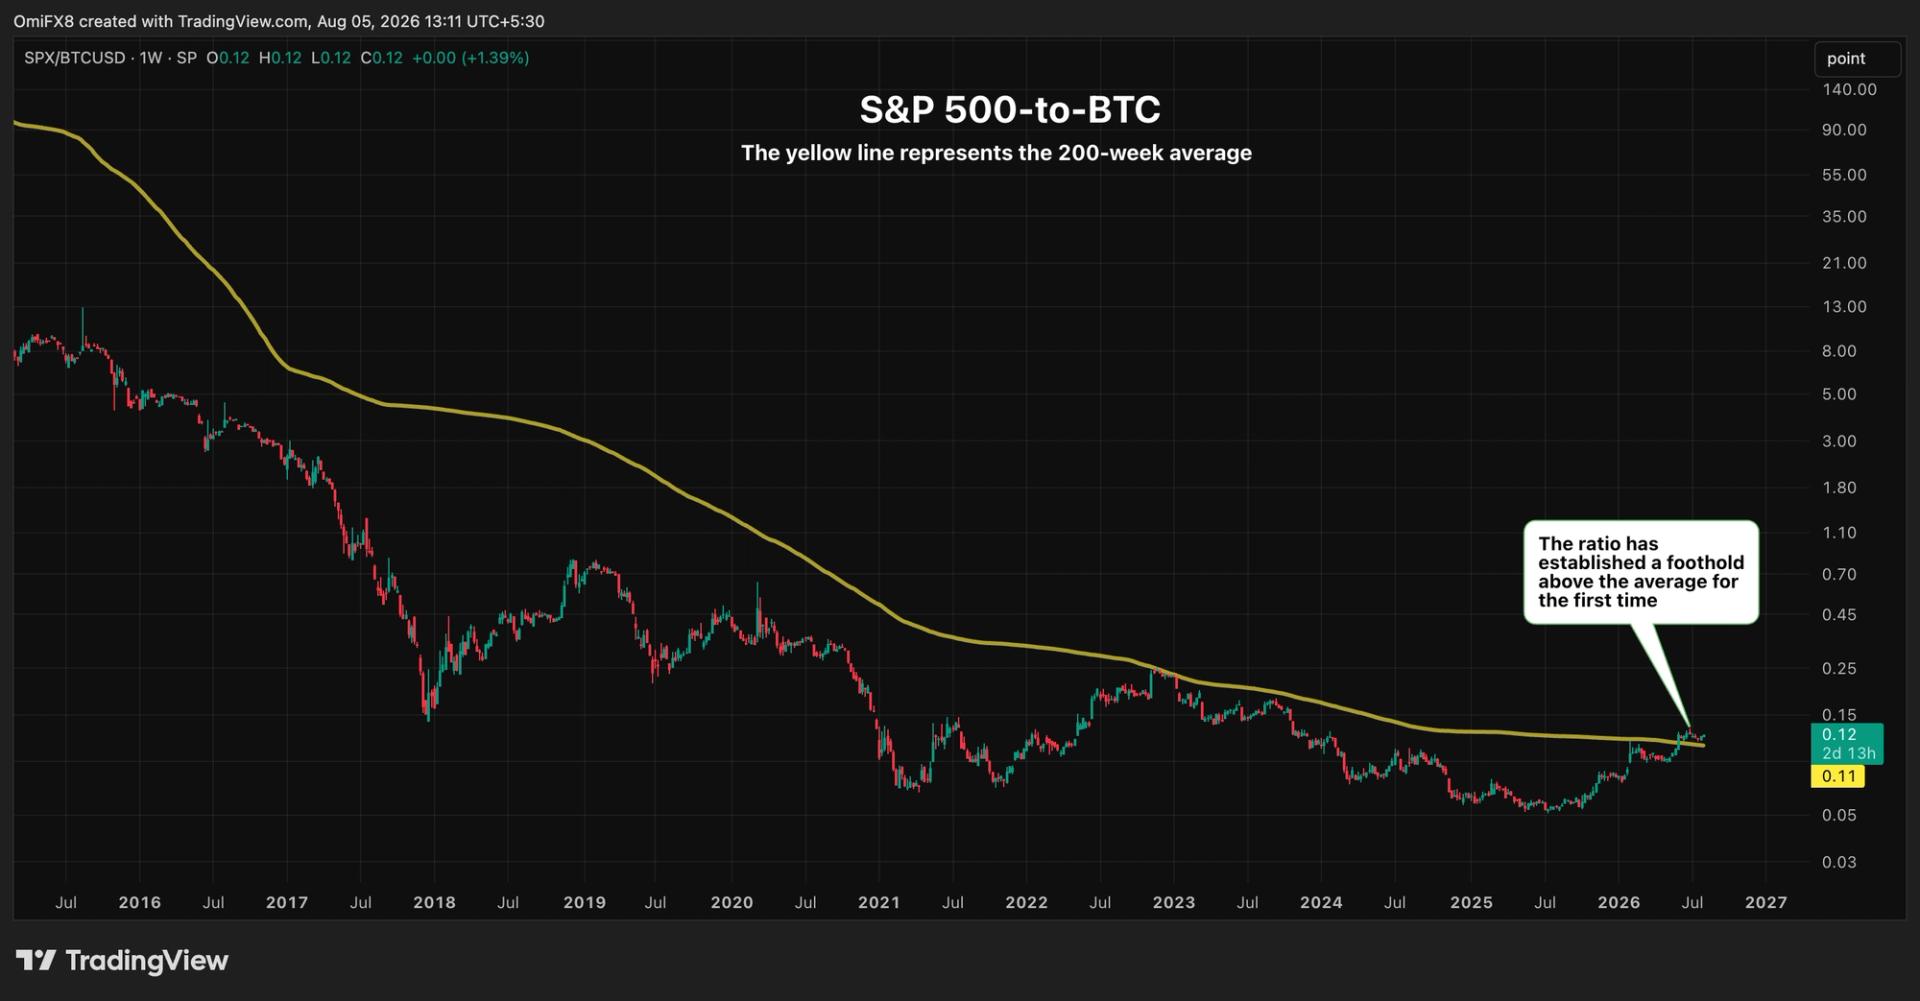
For years, bitcoin trounced stocks and most other assets, and supporters pointed to that outperformance as proof it was the best store of value around. Now, one chart suggests that edge may be fading.
That chart is the S&P 500-to-bitcoin ratio. It measures how much bitcoin it takes to buy the index. Today it takes roughly 0.12 BTC, versus more than 300 BTC in 2012. The ratio moved largely lower in a steep downtrend since BTC’s inception in 2010, with the 200-week simple moving average, a barometer of long-term trend, acting like a ceiling holding a ball underwater. There were brief instances of stocks outperforming BTC, lifting the ratio, but never beyond that average.
Until now.
In recent weeks, the ratio hasn’t just topped the 200-week average, it’s established a firm foothold above it, clearly visible on the far right of the chart above. It’s not isolated to the S&P, either. The Nasdaq/BTC ratio is showing the same first-ever crossover above the 200-week average.

What is the single most important action you think the public, or a specific company or government, needs to take in the next year to advance the climate agenda?
The single most important action we need in the next year is for utilities, governments, and companies—especially hyperscalers—to recognize and invest in households as energy infrastructure. We are living through the convergence of three forces: unprecedented load growth, a worsening affordability crisis, and the urgency of climate action. Household upgrades are the fastest way to add capacity to the grid, lower costs for families, and reduce emissions. Our latest analysis shows upgrading households to efficient electric devices could offset all projected data center demand growth over the next five years.
Treating households as energy infrastructure is not just a climate strategy, it is the pathway to reconciling affordability, reliability, and decarbonization while renewing the bonds of community. Once we lean into that work, the solutions—policy interventions, demand aggregation, and durable private investment—will come rushing through.
What’s one sustainability effort you personally will try to adopt in the next year?
This year I want my family to lean less on our gas car, which has basically become our “peaker plant” whenever kids’ activities pile up; tennis, flag football, soccer, two different school dropoffs—parents know this drill. We already have an EV, our daily driver, but the gas car sneaks into the mix more than I’d like. Maybe this will be the year that we fully retire that peaker plant and become a full EV household. At the same time our family has really taken to composting with the Mill Food Recycler. It really taught me how fast a new habit can stick. It’s become so normal in our house that “just mill it” is now a verb. The persuasion campaign for my own parents to follow suit is underway.
What is a climate solution that isn’t getting the attention or funding it deserves?
A climate solution that doesn’t get nearly enough attention is insurance. As climate impacts intensify, the models we use to insure risk are breaking down, leaving households, small businesses, and entire communities exposed. In many parts of the country, families are already losing access to affordable homeowners’ insurance because of wildfire, flood, or storm risk. Without viable insurance, communities can’t build resilience, families can’t protect their assets, and entire local economies are destabilized.

Arthur Hayes, the former co-founder of BitMEX, is warning that today’s surge in AI infrastructure spending could sow the seeds of a renewed credit crunch—one he believes may ultimately send Bitcoin to highly elevated levels.
In a Tuesday blog post, Hayes argued that the boom is being treated by investors as a high-growth technology earnings story, when he views it more like leveraged real estate. He expects lenders to fund aggressive data-center and power buildouts, only for a slowdown in AI-related capital expenditure to reveal weaker borrowers. From there, Hayes suggested, a government liquidity response could reintroduce significant risk assets into the broader market, with Bitcoin potentially rallying far beyond current ranges.
Key takeaways
- Hayes frames AI infrastructure expansion as a “credit story” rather than an “earnings story,” drawing a parallel to the 2008-style credit cycle.
- He expects banks to finance data-center construction and believes the exposure will become clearer when AI spending growth cools.
- Hayes said Bitcoin could churn in a range of $60,000 to $70,000, with downside risk to $50,000 before any credit-driven recovery.
- He forecast Ether could reach $5,000 by year-end and said his firm Maelstrom plans to accumulate while selling out-of-the-money ETH puts.
- Recent reporting highlights the scale of future AI data-center lease commitments, underscoring the leverage embedded in the buildout.
Hayes’ “AI is real estate” credit-cycle warning
Hayes’ latest argument centers on how the AI buildout is financed. In his view, spending on data centers and power infrastructure is not the same as investing in product-driven technology growth. Instead, he characterizes it as a leveraged commitment that resembles property finance—where cash flows depend on demand staying strong and credit remaining available.
That distinction matters because credit cycles can turn quickly when expectations are met too early or when capital expenditure slows. Hayes’ thesis is that lenders will continue extending funding while projects are still ramping, but problems may surface after AI capital expenditures weaken and borrowers face difficulty servicing obligations. In that scenario, he expects liquidity measures from policymakers to follow—potentially injecting fresh capital into financial markets.
From 2008 comparisons to Bitcoin’s speculative path
Hayes directly compared the dynamic to 2008, calling the AI boom a “credit story like 2008 and not an earnings story like 2000.” He stressed that the key driver for crypto, in his framing, would not be fundamental “earnings” growth from the AI sector itself, but rather the liquidity response that could follow a credit deterioration.
In the meantime, he outlined a near-term technical-style range for Bitcoin. Hayes said BTC could remain between $60,000 and $70,000, with potential downside to $50,000, before any recovery tied to the credit cycle and government liquidity response. He also floated the prospect that, if the cycle plays out as he expects, Bitcoin could eventually be driven to $1 million or higher.
It’s important to note that Hayes’ scenario is inherently speculative. The argument depends on a specific chain: overbuilding in AI infrastructure → weaker borrowers → a credit crisis → policy liquidity support → renewed inflows into risk assets like Bitcoin. While the general linkage between credit conditions and market liquidity is a recurring theme in macro finance, the timing and magnitude Hayes suggests remain uncertain.
What changes, and how Hayes positions within the market
Hayes’ outlook includes both a macro forecast and an options-and-positioning angle. He predicted Ether (ETH) would reach $5,000 by year-end and said Maelstrom intends to build a “significant position” while simultaneously selling out-of-the-money ETH put options. The structure signals a willingness to hold exposure while collecting premium that could cushion downside—though the payoff depends on where ETH trades relative to the strike prices and volatility conditions.
His thinking also builds on earlier public comments about how AI competition and capital allocation could affect crypto liquidity. On May 13, Hayes said US-China competition in AI would encourage bank lending and fiat creation—an environment he argued could benefit Bitcoin. On June 4, he previously said he sold HYPE and NEAR after warning that major AI-related listings could divert capital away from crypto.
Taken together, the throughline is that Hayes sees crypto’s near-to-medium term direction as sensitive to macro and liquidity flows, not just to crypto-native fundamentals. Where AI spending is framed as a credit lever, the opportunity for crypto comes from the knock-on effect: whether the broader system expands liquidity—or contracts it under stress.
Why leverage in AI infrastructure is getting attention
Hayes’ caution about financing risk comes as reporting has begun to quantify the scale of commitments behind the AI buildout. According to Reuters, Microsoft, Meta, Oracle, Amazon, and Alphabet have committed about $1.09 trillion to leases that have not yet commenced, largely for data centers. Reuters noted that this figure cannot be treated as a straightforward debt total because it reflects undiscounted payments spread across multiple years.
Still, Reuters highlighted that the commitments are nearly four times the roughly $285 billion in lease liabilities already recognized by the same companies. The gap matters because off-balance-sheet commitments can become a stress point if operating assumptions weaken, especially if the buildout timing and actual demand for capacity diverge.
Reuters also pointed to uneven strain across firms. A separate Reuters analysis cited that Oracle’s debt was about 4.3 times its earnings before interest, taxes, depreciation, and amortization, while Alphabet, Amazon, Microsoft, and Meta had ratios below one. Reuters further quoted S&P Global analyst Andrew Chang, who said Oracle’s data-center leases run for 15 to 19 years, while customer contracts last no more than five years—creating a mismatch that could increase risk if customers do not renew or expand on the expected schedule.
For crypto investors tracking Hayes’ thesis, the relevance is straightforward: if the AI infrastructure ramp becomes a drag on credit and financing markets, it could translate into broader liquidity constraints. Conversely, if policymakers respond aggressively to maintain stability, that same liquidity could later flow back into speculative assets—where Bitcoin has historically captured attention during risk-on phases.
Going forward, market participants will likely watch whether AI infrastructure spending and financing conditions begin to show signs of strain, and whether policy-makers move to support credit markets if they do; Hayes’ case hinges on that transition from construction optimism to a liquidity-driven response. Until there is clear evidence of a slowdown in capital expenditure or credit stress in the real economy, his BTC range and $1 million-plus scenario remain a high-volatility narrative rather than a confirmed forecast.
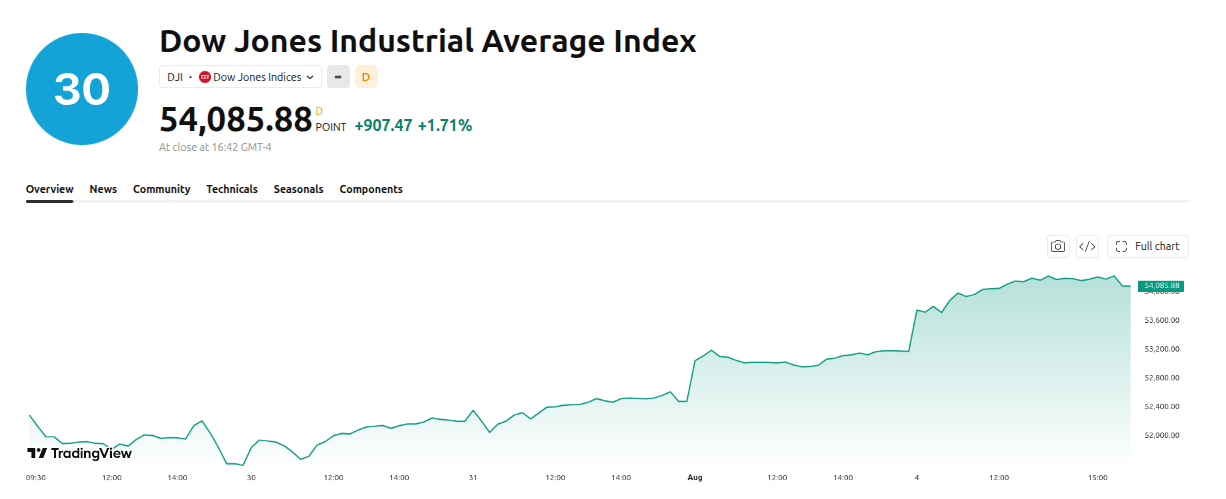
The Dow Jones and S&P 500 both closed at record highs on Tuesday, driven by optimism over progress toward fully reopening the Strait of Hormuz.
Crude fell roughly 5% amid diplomatic signals, easing inflationary pressure that had capped equities for months.
The Diplomatic Signals Behind Wall Street’s Record Session
The Strait of Hormuz is a narrow waterway handling a substantial portion of global seaborne oil and liquefied natural gas shipments. Its status has shaped market sentiment since February.
The numbers reflected a broad risk appetite. The Dow Jones rose 1.71%, or 907 points, to 54,085.88, while the S&P 500 advanced 1.79% to 7,736.52.
Follow us on X to get the latest news as it happens.

That marked the S&P’s first closing record since early July. The technology-heavy Nasdaq Composite outperformed both, gaining 2.59% to finish at 26,584.99.
Both major indexes traded even higher during the session. The intraday moves underscored how quickly sentiment shifted in response to Middle East headlines. Secretary of State Marco Rubio provided the initial catalyst. He confirmed the strait remains open, with ships and oil continuing to transit the waterway.
Negotiations appear to be advancing. Rubio described talks involving Iran, Oman, and US participation aimed at ensuring safer and increased vessel traffic in the short term.
Treasury Secretary Scott Bessent added further momentum. He told CNBC that a deal to fully reopen commercial transit could be reached today or tomorrow.
Diplomatic context explains the urgency. President Donald Trump recently suspended what he described as a major potential strike on Iran to allow negotiations to proceed.
Why Analysts Still Urge Caution
Energy markets responded immediately. Crude prices fell roughly 5%, pulling Treasury yields lower and supporting equities across sectors. Semiconductor and artificial intelligence stocks led the advance. The Philadelphia Semiconductor Index surged more than 6% during the session.
Corporate results reinforced the move. Upbeat earnings from Caterpillar and Palantir helped alleviate lingering concerns about demand. The stakes explain why traders reacted so forcefully. Prolonged disruption earlier this year fueled volatility, raised energy costs, and pressured growth forecasts.
A durable agreement would remove a significant geopolitical risk premium. That prospect alone justified Tuesday’s repricing across multiple asset classes.
Caution remains warranted, however. Rubio acknowledged that no final deal exists yet, despite the progress he described. Tehran has issued mixed signals about the formal status of talks. Previous memorandums of understanding have collapsed under similar circumstances.
Any breakdown could reverse the moves quickly. Oil would likely spike again, pressuring equities and reviving the inflation concerns that briefly faded. The week ahead brings additional tests. Investors will digest further earnings reports and economic data alongside developments in the Gulf.
Attention stays fixed on one question. Whether diplomatic optimism translates into concrete shipping gains will determine if these records hold.
For now, the waterway’s status has unlocked Wall Street’s latest advance. The durability of that rally depends on negotiations still unfolding.
Subscribe to our YouTube channel to watch leaders and journalists provide expert insights.
The post Wall Street Closes at Records as the Strait of Hormuz Holds the Key: What’s Next? appeared first on BeInCrypto.


Cloudflare introduced programmable Wallets for AI agents and said payment features using stablecoins will launch in a future update.




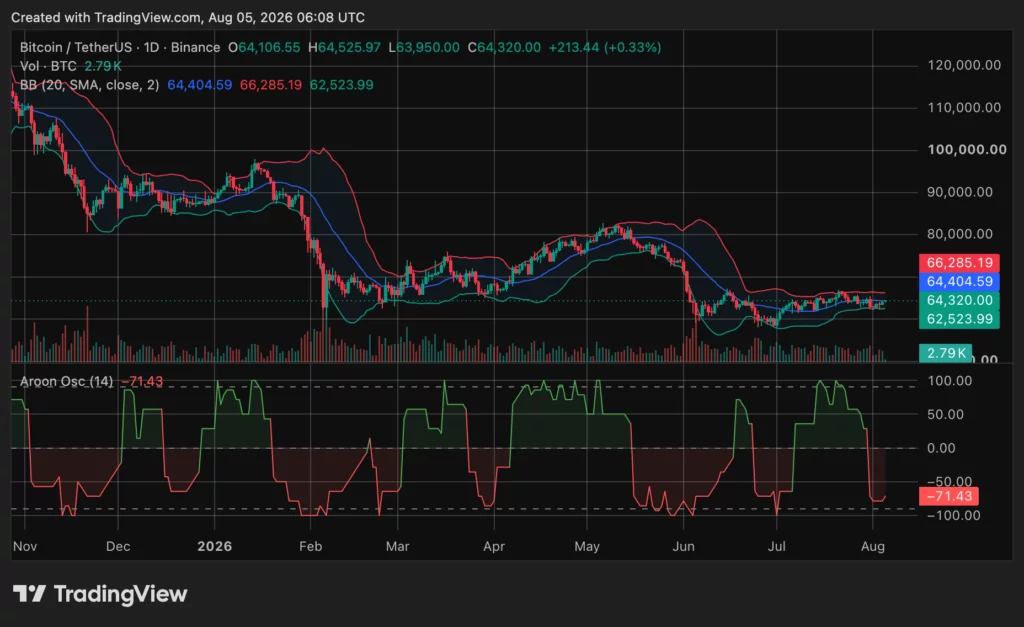
Bitcoin traded near $64,270 on Aug. 5, gaining less than 1% as record equity markets and falling oil prices failed to produce a broad crypto rally.
Summary
- Bitcoin price held above $64,000 while record global equities and cheaper oil failed to spark momentum.
- Brent fell near $78.50 as traders awaited a possible U.S., Iran, and Oman shipping agreement.
- Bitcoin must close above $64,300 on four hour charts to confirm analyst Ali Martinez’s breakout.
- Bollinger Bands place immediate resistance near $66,285 and range support around $62,524 for Bitcoin traders.
- U.S. spot Bitcoin ETFs drew $19.6 million Tuesday, but recent outflows still weighed on demand.
The largest cryptocurrency remained roughly flat over seven days and about 49% below its October 2025 record above $126,000.
Ether and XRP weakened, while BNB and Hyperliquid’s HYPE outperformed among major tokens. The restrained response contrasted with global stocks, where the S&P 500 and Dow closed at records and Asian technology shares rose sharply on strong AI related earnings.
Bitcoin price sits out the latest risk rally
Reuters reported that Japan’s Nikkei gained 3.5%, South Korea’s benchmark rose 4.3%, and an MSCI Asia Pacific gauge excluding Japan advanced 2.3%. Brent crude fell toward $78.85, while the U.S. 10 year Treasury yield eased to about 4.603% as traders reduced expectations for another near term Federal Reserve rate increase.
Those conditions would normally offer support to BTC. Cheaper oil can reduce inflation pressure, while lower bond yields can make non interest bearing assets more attractive. Yet BTC has shown only a limited response across several sessions, suggesting crypto specific demand remains too weak to confirm a wider risk rally.
U.S. spot Bitcoin exchange traded funds recorded $19.6 million of net inflows on Aug. 4, according to Farside Investors. The positive session offered some support, but it followed a period of heavier withdrawals, including about $265 million reported on Aug. 1.
Corporate supply has also returned to the market. Strategy’s official Bitcoin ledger shows the company sold 1,638 BTC for about $105 million, leaving it with 842,138 BTC. The sale was small relative to its holdings, but it removed a source of price insensitive accumulation that had supported earlier rallies.
A Hormuz agreement remains possible, not confirmed
Axios reported that the U.S., Iran, and Oman were approaching a temporary arrangement to reopen the Strait of Hormuz, with an announcement targeted for Wednesday. The proposal would create a 60 day shipping arrangement that could be extended. President Donald Trump later said a deal could arrive Wednesday or Thursday.
No signed agreement had been announced at the time of reporting. Trump described the discussions as “very good,” while Iran and the U.S. still differed on key details. The market therefore remains exposed to another breakdown after an earlier arrangement collapsed and attacks on shipping resumed.
Oil has already priced in part of the expected easing in tensions. The largest crypto has recovered by more than $2,000 from its recent low near $62,200, but the move remains modest compared with the response in equities and crude. A confirmed agreement may reduce a major inflation and geopolitical risk, although it would not guarantee fresh crypto demand.
The crypto rose toward $66,800 after an earlier Hormuz reopening announcement in June.Renewed conflict could expose support below $64,000. The contrast makes the next confirmed diplomatic update a useful test of whether Bitcoin still reacts strongly to the oil and rates channel.
Bitcoin needs $64,300 to confirm a breakout
The supplied four hour setup places $64,300 at the upper boundary of a descending channel. Analyst Ali Martinez said a close above that level “could confirm the breakout” and open a possible move toward $65,500 or $66,500. Those levels are conditional targets, not confirmed outcomes.
The daily chart gives a more cautious reading. The crypto trades near the Bollinger Bands middle line around $64,404. The upper band sits near $66,285, while the lower band is around $62,524. This structure shows consolidation rather than a completed directional move.
The Aroon Oscillator stands at negative 71.43, showing recent lows remain more dominant than recent highs. Holding $62,500 to $63,000 would preserve the range, while a daily move above $66,000 to $66,300 would provide stronger evidence that buyers have regained control.
Meanwhile, the next market test is whether a confirmed Hormuz agreement can push the crypto above $64,300 and then through the upper Bollinger Band. Failure to rally after a verified deal would strengthen the view that capital is favoring AI shares, bonds, and gold rather than crypto.
Traders will also watch ETF flows, the $62,500 lower range, and whether Strategy reports further sales. Until volume expands and BTC closes above resistance, the rebound from $62,200 remains a recovery inside a broader downtrend rather than a confirmed trend reversal.
FAQs
Why is Bitcoin lagging behind global stocks?
Bitcoin lacks strong crypto-specific demand despite favorable macro conditions. Record stock prices, falling oil and lower bond yields have not produced enough buying pressure to confirm a breakout. Recent ETF inflows have also remained modest compared with earlier withdrawals.
What is the key Bitcoin price level to watch?
The immediate level is $64,300, which marks the upper boundary of the descending channel on the four-hour chart. A confirmed close above it could support a move toward $65,500 and $66,500, although those targets remain conditional.
Could a Strait of Hormuz agreement lift Bitcoin?
A confirmed agreement could reduce geopolitical and inflation risks by improving shipping conditions and lowering oil prices. However, it would not guarantee a Bitcoin rally. A weak response could indicate that investors currently prefer equities and other assets.
What are Bitcoin’s main support and resistance levels?
Immediate support sits between $62,500 and $63,000. A break below that range could expose the recent $62,200 low. Resistance appears at $64,300, followed by the upper Bollinger Band near $66,285.
What would confirm a stronger Bitcoin recovery?
Bitcoin would need stronger trading volume, sustained ETF inflows and closes above $64,300 and $66,300. Until then, the move from $62,200 remains a rebound within a broader downtrend rather than a confirmed reversal.

Money | Cover by – Anukriti #anukriti #coversong #money #lisa #blackpink
Wacker Chemie hits 3-week high after Reuters report on U.S. polysilicon plans
Bitcoin (BTC) Whales Are Moving Big as Coldcard Chaos Sends Shockwave


-

 Business6 days ago
Why Trees Belong on the Risk Register
-

 Fashion5 days ago
Weekend Open Thread: Wit & Wisdom
-

 Politics4 days ago
Meta enters AI-training agreement with far-right ‘propaganda rag’ Newsmax
-

 Politics7 days ago
Reform UK betrays West Mids residents by running from party pledges
-
 Crypto World4 days ago
MicroStrategy Post-Earnings CLARITY Act Push Could Add New Catalyst for Its Stock
-

 Politics3 days ago
Zack Polanski: an incitement to murder Nigel Farage?
-

 Crypto World4 days ago
XRP Ledger v3.3.0 brings five institutional features
-

 News Videos6 days ago
Bitcoin Enters the 3rd Stage of the Bear Market
-

 Politics6 days ago
Luke Littler’s dominance sparks GOAT debate
-

 Sports5 days ago
Seema Kaliramna Wins Discus Throw Bronze, Takes India’s CWG Medals Tally To 17
-

 Crypto World4 days ago
New York sues Kalshi over prediction market gambling
-

 Crypto World3 days ago
Crypto PAC spending tops $2M in Michigan House race
-

 Tech7 days ago
Gemini can now summarize the messiest comment threads in Google Docs
-
 Business5 days ago
Trump Announces Hamas Disarmament Agreement as Iran Strikes Kuwait Air Base and US Attacks Pause Overnight
-

 Tech3 days ago
ESET tracks rise in malicious AI skills and adaptable malware
-

 Business2 days ago
DTCR: Deleveraging And A Hedge Fund Collapse Point To A Possible AI Bottom
-

 Tech5 days ago
Gemini Spark can now use Chrome logins and saved passwords to run errands on your behalf
-
 Tech5 days ago
Building A Reproduction PlayStation Motherboard
-

 NewsBeat6 days ago
Four people die trying to cross Channel in small boats
-

 Sports7 days ago
Sakshi, Arundhati Enter Boxing Semi-Finals. India Assured Of 18 Medals At CWG 2026
You must be logged in to post a comment Login