




In this fifth part in our series on how the UK has changed in the past 25 years, we look at crime, education, transport, energy and the environment.
Crime and policing
Graham Farrell, professor of crime science, University of Leeds
Toby Davies, associate professor in criminal justice data analytics, University of Leeds
Contrary to many media headlines, the story of crime over the last quarter century is positive. The dominant trend is the long-term decline in property and violent crime.
In the 1990s, property and violence rates were around ten times what they are now. The reason for their decline is a rising tide of security improvements that has reduced crime opportunities – everything from engine immobilisers in cars, to double glazing and deadbolts in houses, to dual-factor authentication for payments and other services.
How has the UK changed since the start of the century? From Blair to Burnham, from the dotcom era to AI agents, time has certainly not stood still. In this six-part series, a team of some 35 experts look at everything from defence spending to species populations to the rise of populism to try and make sense of the intervening years.
Not only have these discouraged theft, they have discouraged the violent crimes that go hand-in-hand. Bank and Post Office robberies, for example, are largely a thing of the past. And unable to get involved in easy property crimes, young people did not progress to violence.
Trends in violence, burglary and vehicle theft

Authors provided, CC BY-SA
Violence against women and girls, including domestic violence, has fallen by around two-thirds in the last quarter century – albeit it’s still unacceptably high. Though further research is required to confirm it, domestic violence appears more likely to be by men who committed other crimes in their youth. If so, it may be that when they can’t commit those earlier crimes, they are less violent in relationships when they are older.
Crime online
There have also been new and emerging types of crime, particularly internet-related offences. We know these are independent of the declines in other property crimes and violence, for three reasons.
There was a decade or more between the start of the “crime drop” in the early 1990s and the main increase in cybercrimes. This means it’s different cohorts of offenders, since most offenders are young. The skills and resources needed for cybercrime are also very different to those for burglary, car theft and other similar crimes. And cybercrime offenders are not necessarily even located in the same country.

Max Acronym
But even the cybercrime picture may not be as bad as often portrayed. Crime Survey of England and Wales estimates of household fraud and computer misuse are available from 2016-17 onwards, and the trend has been relatively flat over the last decade (the chart below does exclude a pandemic-related uptick which subsided).
Household fraud and computer misuse estimates

Crime Survey of England and Wales, CC BY-SA
You may be wondering why cybercrime hasn’t benefited from the same falls in crime opportunity structure (how easy crime is to commit) that have reduced property and violent crime. It’s true that online security measures are effective against some forms of offending, but rapid technological developments constantly create new opportunities for innovation by criminals. We’re still playing catch up as these crimes evolve, but with persistence we should be able to prevent them too.
There’s a similar explanation for another seeming anomaly: phone theft. It has increased because phones proliferated this century and make near-perfect theft targets. Crime science refers to such targets as CRAVED: they are concealable, removable, available, valuable, enjoyable and disposable (meaning easily re-sold). This explains why your phone rather than your fridge is stolen even when they cost the same.
Knife crime
Knife crime increases in the 2010s are one other counter-trend that still needs to be properly explained. But such crimes would not be possible without the widespread availability of knives, both online and in supermarkets.
Most households have lots of pointed knives in the kitchen, making them easy to grab during an argument. And with so many similar knives in the drawer, nobody notices if one goes missing. It is the pointed tip of kitchen knives that punctures major organs and arteries, potentially meaning a fight becomes a murder.
We have argued for removing pointed kitchen knives from general circulation, which is the only intervention likely to achieve the 50% reduction in knife crime to which the current government aspires. In case you didn’t notice, table knives are already round-tipped, so it is a small step to make kitchen knives safer too.

Brain Storm
At the same time, and counterintuitively, the UK’s knife crime headlines are evidence of success in some forms of crime prevention. Consider that it is high-profile only because our gun and bomb control policies are so effective.
In 2022-23 the per capita rate of gun-related homicide in the United States was over 100 times that in the UK – or, put another way, UK gun control was 99% effective in comparison. And the prevented UK crime and homicide did not shift to knives or other crimes; there are dramatically fewer overall.
Likewise, of the few terrorist attacks that occur in the UK, they disproportionately involve knives. These attacks would be more numerous and far worse without the raft of gun and bomb control measures. Weapon control works, in other words.
This brings us to broader crime policy. More funds for policing won’t have much effect on crime. Since the long-term crime declines were due to private and public sector measures by agents other than the police, our police and government should be more focused on encouraging the private sector to take responsibility for the crime opportunities it “emits”. The phone industry, for instance, could have been incentivised decades ago to disable stolen phones, so a recent call to action by the Metropolitan police is very welcome.
Education
Helena Gillespie, professor of learning and teaching in higher education, University of East Anglia
In 1996 Tony Blair made a speech promising that his three priorities in government would be “education, education, education”. He believed education was the engine of economic growth, and by the end of his first term in 2001, Labour had invested significantly in school infrastructure. Many schools had new and refreshed premises, fit for a 21st-century education.
This could have provided a unique foundation for schooling at the turn of the millennium, but 25 years and 22 secretaries of state for education later, the reality is somewhat different.
There is much that remains constant in schools. The system of primary and secondary education still means that most pupils move at the same rate through their education. Classrooms, desks, science labs and football fields still look very similar to 25 years ago. However, education is devolved to the nations, which has led to different curricula, approaches to qualifications and inspection regimes across the UK.

Art Directors & Trip
Schools in England remain heavily influenced by what is known as a national approach to testing. This refers to standardised exams designed, mandated and marked centrally, as opposed to tests created individually by teachers or schools.
For instance, teaching in the later years of primary education in England is heavily influenced by the SATs (standard assessment tests) that pupils take at the end of primary, since the data is used in the school inspection regime. By contrast in Wales, comparable data on school performance is seen as less important than a school’s own assessment of its success. This gives teachers more flexibility in how and what they teach.
England’s approach owes much to Michael Gove, who has been the longest serving education secretary in the past 25 years (from 2010-14). He introduced the revised curriculum for English schools, which moved away from teaching skills toward core facts, rote learning and more emphasis on academic subjects like history, science and maths.

Mark Makela
He oversaw significant expansion of academies, where schools cut ties with their local education authorities. In theory this gives them greater financial autonomy, and nearly 90% of secondaries now have this status. However, economies of scale have led to 92% of academies joining multi-academy trusts, which may have limited their financial freedom in the medium term.
Becoming an academy also, in theory, gave schools more autonomy over the use of the revised curriculum. But since Gove also did away with testing through coursework and modules at GCSE level and introduced mandatory high-stakes GCSE exams, schools effectively had less flexibility than it appeared.
The Scottish dimension
In the political turmoil that followed the Brexit vote in 2016, education took a political back seat, with four different education secretaries in Westminster in four years. Meanwhile Scottish education policy, whose skills-focused curriculum for excellence already made it quite different from Gove’s approach, further shifted in 2017 with a review of education and governance. It focused on the need to improve outcomes for the most disadvantaged children, and gave headteachers a bit more say in spending money to help drive attainment.
Many UK education secretaries have espoused the virtues of technical and vocational education, for example the Skills for Jobs white paper published in 2021. Yet such initiatives have failed to back their aspirations with meaningful investment in further education colleges, which should be the principal drivers of vocational education.
Meanwhile in higher education, introducing fees in England and Wales made it possible for universities to teach many more young people – participation rates rose from 40% in 2001-02 to 51% by 2023-24. However, it has also saddled graduates with very significant debt, particularly in England. Across the UK, the sector also remains plagued by questions of value for money and soaring institutional debt.
The big picture
In terms of results, changes to policy and grading approaches makes a longitudinal comparison difficult, but the overall picture in terms of GCSE (year 10) attainment in England has been stable since 2013.
Yet the biggest challenge to education in the last 25 years came not from a politician, or devolution, or policy change. It came in March 2020 when the COVID pandemic lead to the widespread sporadic closure of schools for two years. In the aftermath of the pandemic there was a failure of government efforts to support educational recovery which still resonates in the education system today.

Sally Anderson
Absenteeism spiked during the pandemic and hasn’t really come down (it was about 5% in 2019 and around 7% today). Attainment levels between richer and poorer children worsened after years of improvement, and has largely not reversed. And a recent government report showed that levels of both diagnosed mental health conditions and psychological distress are rising among young people, having deteriorated during the pandemic (to some extent this may be because there’s less stigma around reporting these conditions than in the past).
There also remains a significant challenge around low engagement in education, with as many as one in eight of young people not in education, employment or training. As a measure of the success of the UK’s education system, that last statistic, perhaps more than any other, suggests a system which, over the last 25 years of change, has failed to keep up with the needs of young people.
Transport
Stephen Potter, emeritus professor of transport strategy, Open University
The period 1975-2000 saw little substantive change. Catalytic converters cut air pollution, but the rise in car use and road congestion was relentless, coupled with the introduction of a few city tram systems and the Channel tunnel.
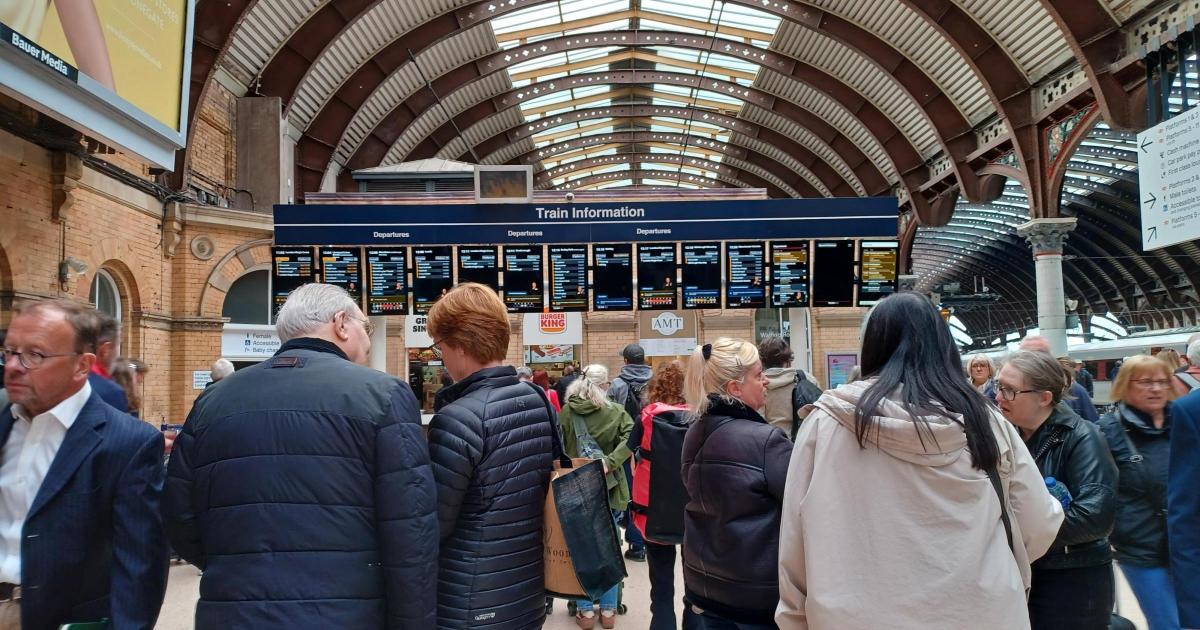
Up to 2001 the amount we travelled steadily increased, but then this trend reversed. In 2002 the average annual distance travelled per person was 7,193 miles; by 2024 it had dropped to 6,082 miles.

R Wareham
Why we travel has also shifted. Commuting trips declined by 39% over the period, and now account for only 12% of journeys. Trips to visit people dropped by 39%, while leisure trips increased substantially. The rise of digital communications, remote working and online shopping might explain much of these trends, but other socioeconomic factors are involved, such as our ageing population, young people drawn to city life, and an increase in economically inactive people.
The tech shift
Electric vehicles are an obvious example of technological change this century. In 1999, for a BBC Open University programme, I experienced the first hybrid Prius in the UK. Spurred by the climate agenda, battery electric vehicles today make up 27% of sales, plug-in hybrids 14% and other hybrids 13%, so more than half of all car sales are now electrified vehicles.
Sat-nav, a niche car feature in 2001, has become ubiquitous, vital for both personal travel and business systems. We are now moving on from digital driver assistance towards driverless autonomous vehicles.
Driverless taxis are due to appear on British streets soon; they certainly have their faults, but the technology is improving rapidly and heading mainstream. On a smaller scale robotic vehicles are already here, with several UK cities including Milton Keynes and Bristol having experimented with autonomous robotic food deliveries.
The appearance and popularity of e-bikes and e-scooters divides opinion, but they help fill a hole where conventional public transport services fail. Outside of big cities, local public transport is in crisis with bus trips declining by 39% from 2002-2024. In the last ten years, over a quarter of bus routes have been cut. In contrast, rail use has increased this century by over 50%.
Some new forms of public transport are beginning to appear. Demand responsive transport, booked roughly like a cab or Uber but sharing trips with other passengers, has appeared in some places, notably urban fringes and rural areas. Wales has been a frontrunner here.
Of potentially large significance is the emergence of the “trackless tram”. Instead of spending years and vast sums digging up roads to install rails and overhead power lines, this innovative battery-powered design is steered by GPS and cameras. They have been running in China for several years and places like Hertfordshire and Milton Keynes are actively working to introduce such systems.
How will all this work out in the future? As in other areas of life, in transport the shift from analogue to AI and digital futures could play out in a wide range of ways – some life affirming and environmentally positive, and others dystopian. We may now be in the crucial innovation stage of determining which of these paths will be followed.
Energy
Jim Watson, professor of energy policy, University College London
Back in 2001, three-quarters of our electricity was generated by fossil fuels, and electric vehicles were a distant dream. The energy transition, as it is now called, was well ahead of us.
However, the forces that have shaped our energy system over the last 25 years were starting to become visible. Climate change had been put firmly on the UK policy agenda in 2000 by the Royal Commission on Environmental Pollution. The commission’s report, Energy: The Changing Climate, recommended a long-term target for reducing UK emissions for the first time. In 2003, that recommendation was accepted by the government after an extensive review of energy policy, and the UK adopted a 60% reduction target for greenhouse gas emissions by 2050.

Christopher Drabble
Looking back, that target seems very unambitious. UK greenhouse gas emissions are now 50% lower than 1990 levels. They had already fallen steadily in the 1990s, largely due to a switch from coal to gas electricity generation. That trend subsequently accelerated from the late 2000s as policies to support renewables became more effective – and due to falls in emissions from road transport, domestic buildings and industry.
UK carbon emissions

Our World in Data, Global Carbon Budget 2025, CC BY-SA
The share of electricity from renewables grew from just 3% of the UK’s power in 2000 to 53% in 2025. The current level of generation from wind and solar would have astonished power system engineers in 2001. Back then, there were serious debates about whether more than 10% of our power could be generated from these technologies.
This rapid progress with emissions increased confidence that radical change could be achieved. It eventually led to the adoption of a legally binding net-zero emissions target in 2019, backed by a cross-party political consensus.
New uncertainty
That consensus has now started to break down, partly due to rapid increases in energy prices and increasing concern about energy security. The last five years have demonstrated how geopolitical events such as the Ukraine and Iran wars can still have a profound impact on UK energy prices. While fossil fuels now generate only a third of UK electricity, gas prices still set electricity prices most of the time. We still use oil and gas extensively, especially for transport and heating.

Brian Lawrence
Energy security is not a new concern, of course. When Prime Minister Tony Blair launched his second review of energy policy in 2006, this was also due to a rise in international fossil fuel prices. Two decades of low international prices had come to an end, and the UK had become a net importer of energy due to declining production in the North Sea.
A key outcome of that review was support for new nuclear power stations. Implementation is taking a very long time. The first new nuclear station is still under construction at Hinkley Point, south-west England, with an expected start date of 2031.
It is now much more likely than it was in 2001 that the UK’s energy system will make a decisive shift away from fossil fuels. The past 25 years have shown that rapid change is possible, and that government policies can act as a key driver of this change. Non-fossil technologies such as renewables, battery storage and electric vehicles are now much cheaper and more widely available. The remaining challenge is to build on the progress that has been made – and to insulate the UK from fossil fuel price shocks for good.
Environment
Hayley Fowler, professor of climate change impacts, Newcastle University
When the 2001 census was taken, climate change was already well understood by scientists, but to most people in Britain it still felt like a distant issue. Twenty-five years later, it has become part of the country’s lived environment. Britain is warmer, wetter in winter, more exposed to heatwaves and flooding, and facing rising pressure on coasts, rivers, water supplies and nature.
The clearest change is temperature. The UK’s warmest years have clustered overwhelmingly in the 21st century. Heat that once seemed exceptional is now less surprising, including the record breaking 35°C and 37°C temperatures of May and June 2026 respectively. The most striking example came in July 2022, when the UK exceeded 40° for the first time. This was more than a symbolic record: it showed that Britain’s buildings, transport systems, schools, hospitals and care homes were designed for a climate that no longer exists.

Sam Stephenson
Extreme heat has changed the way climate risk is understood. In the past, British weather hazards were often associated with cold, storms and rain. Those risks have not disappeared, but heat is now a major public-health concern.
Rainfall has changed too. Britain has always had variable weather, but recent decades show a shift towards wetter winters and heavier rainfall events. The winter half-year from October 2023 to March 2024 was the wettest on record for England and Wales. Heavier rain increases the risk of river flooding, surface-water flooding and sewer flooding, especially in towns and cities where drainage systems struggle during intense downpours.
The main risks
These shifts mean that Britain faces greater risk from droughts, water stress and floods. The Climate Change Committee’s A Well-Adapted UK report (2026) identifies both flooding and drought – as well as heat – as central risks for the decades ahead, warning that the country is not yet adapting fast enough.
This dual risk can seem contradictory, but a warmer climate can intensify both wet and dry extremes. Hotter summers dry soils, increase evaporation and raise demand for water. This matters for households, farming, rivers, wetlands and energy production. Water companies, regulators and governments are now under pressure not only to reduce leakage and pollution, but also to plan for more severe dry periods by building new storage.
Sea levels have also risen around the UK by upwards of 10cm this century, increasing the risk of coastal flooding and erosion. Higher seas make storm surges and high tides more damaging, placing added pressure on coastal towns, ports, roads, railways and natural habitats. For some communities, adaptation may mean stronger defences; for others, it may eventually mean difficult decisions about managed retreat.

Masami Iida
Other environmental changes since 2001 are not only about climate. Air quality has improved in some respects, especially as coal power has almost disappeared and vehicle standards have tightened, though pollution remains a serious urban health issue through things like particulates and nitrogen dioxide from vehicle exhausts. Britain has also experienced continuing biodiversity decline, with pressure on birds, insects, rivers and habitats. Public concern about sewage pollution, river health and the condition of nature has grown sharply.
In parallel to all this, we’ve seen a major policy shift. In 2001 decarbonisation was still a relatively specialist policy debate. Since then, the UK has adopted legally binding carbon budgets and a net-zero target. Electricity generation has changed dramatically, with coal largely replaced by gas, renewables and imports. But emissions from homes, transport, food and land use remain harder to cut.
Nature and conservation
Helen Roy, professor in ecology, University of Exeter
Over the last 25 years there has been increasing pressure on our natural world from the five main drivers of biodiversity loss: climate change, land and sea use change, pollution, over-exploitation of natural resources and invasive non-native species. People are observing the changes for themselves – seeing new species arriving and habitats fragmented by the likes of new buildings and roads.
In 2004 the invasive non-native harlequin ladybird, Harmonia axyridis, was first detected in the UK. Now ladybird communities in towns and cities are dominated by this species. The harlequin ladybird is one of more then 2,000 non-native species in the UK – other recent arrivals include the yellow-legged hornet and box-tree moth. There is robust evidence of adverse impacts on people and nature for about 10% of all non-native species, and the actual proportion is likely higher, though that still means a large number are harmless.

Yasunori Koide, CC BY-SA
Some invasive non-native species are known to benefit from disturbed and degraded habitats, while climate change is providing conditions in the UK for some to flourish – giant hogweed and water primrose benefit from both, for instance. Biodiversity scientists are increasingly turning their attention to the ways in which drivers are interacting in these ways and consequences for ecosystems globally.
The Kunming-Montreal Global Biodiversity Framework (GBF), agreed at the Convention on Biological Diversity Conference of the Parties 2021-22, outlines ambitious targets for countries to address the drivers and reverse declines in biodiversity. While these targets may seem far removed from local communities, there are many ways in which people across the UK can make a difference, from digging garden ponds to avoiding synthetic pesticides.
The awareness boom
It has been encouraging to see a growing awareness among the general public about the plight of our natural world in recent decades. More people are talking about the issues facing biodiversity and thinking about ways in which they can help.
The number of people engaging with environmental citizen science projects has vastly increased, through apps such as iRecord, Big Butterfly Count and the UK Pollinator Monitoring Scheme Flower-Insect Timed Counts. We’re seeing artificial intelligence enhancing some of these apps – it’s assisting people with species identification on iRecord, for instance.
Equally, it’s inspiring to see the contributions of people across the UK to biological recording schemes, such as the UK Ladybird Survey. The large-scale and long-term biodiversity datasets derived from these activities are invaluable for tracking progress by the UK towards the GBF targets.
I also feel that there is greater understanding of some of the specific issues that the natural world is facing. The critical role of pollinating insects seems to be more widely recognised.
Gardening for wildlife seems to be increasing in popularity. Every year there seems to be more people engaging with campaigns such as No Mow May, which was recently extended into Let it Bloom June, to provide vital floral resources for insects through the summer months. These “nature positive” actions are people positive too. There is increasing evidence of the wellbeing benefits to people of connecting with nature.
There are many conservation success stories from the last 25 years that give me cause for optimism about the fate of our natural world. All of them involve the engagement of local communities and partnerships: seeing seabirds thrive on St Agnes, Isles of Scilly, thanks to a recovery project following the island-wide removal of rats; visiting nature reserves such as Daneway Banks, Gloucestershire where large blue butterflies are resident once again; promoting biosecurity campaigns such as Be Plant Wise and Check Clean Dry.
My hope is that there will be much to celebrate in another 25 years if everyone prioritises actions to nurture our natural world. While there is no doubt that we have been the cause of widespread losses in biodiversity over many decades, we are also the solution to a flourishing future for people and nature everywhere.

The Insights section is committed to high-quality longform journalism. Our editors work with academics from many different backgrounds who are tackling a wide range of societal and scientific challenges.











!['She had cancer - that I know, but I don't know what kind. We were all afraid to ask [for more details] because we didn't want to know the answer,' the source said; Parton pictured 2023](https://i.dailymail.com/1s/2026/08/26/01/110852765-16080067-image-a-64_1787703307935.jpg)













































You must be logged in to post a comment Login