

Crypto World
Internet Computer Beats Solana and BNB Chain in 30-Day Activity Race

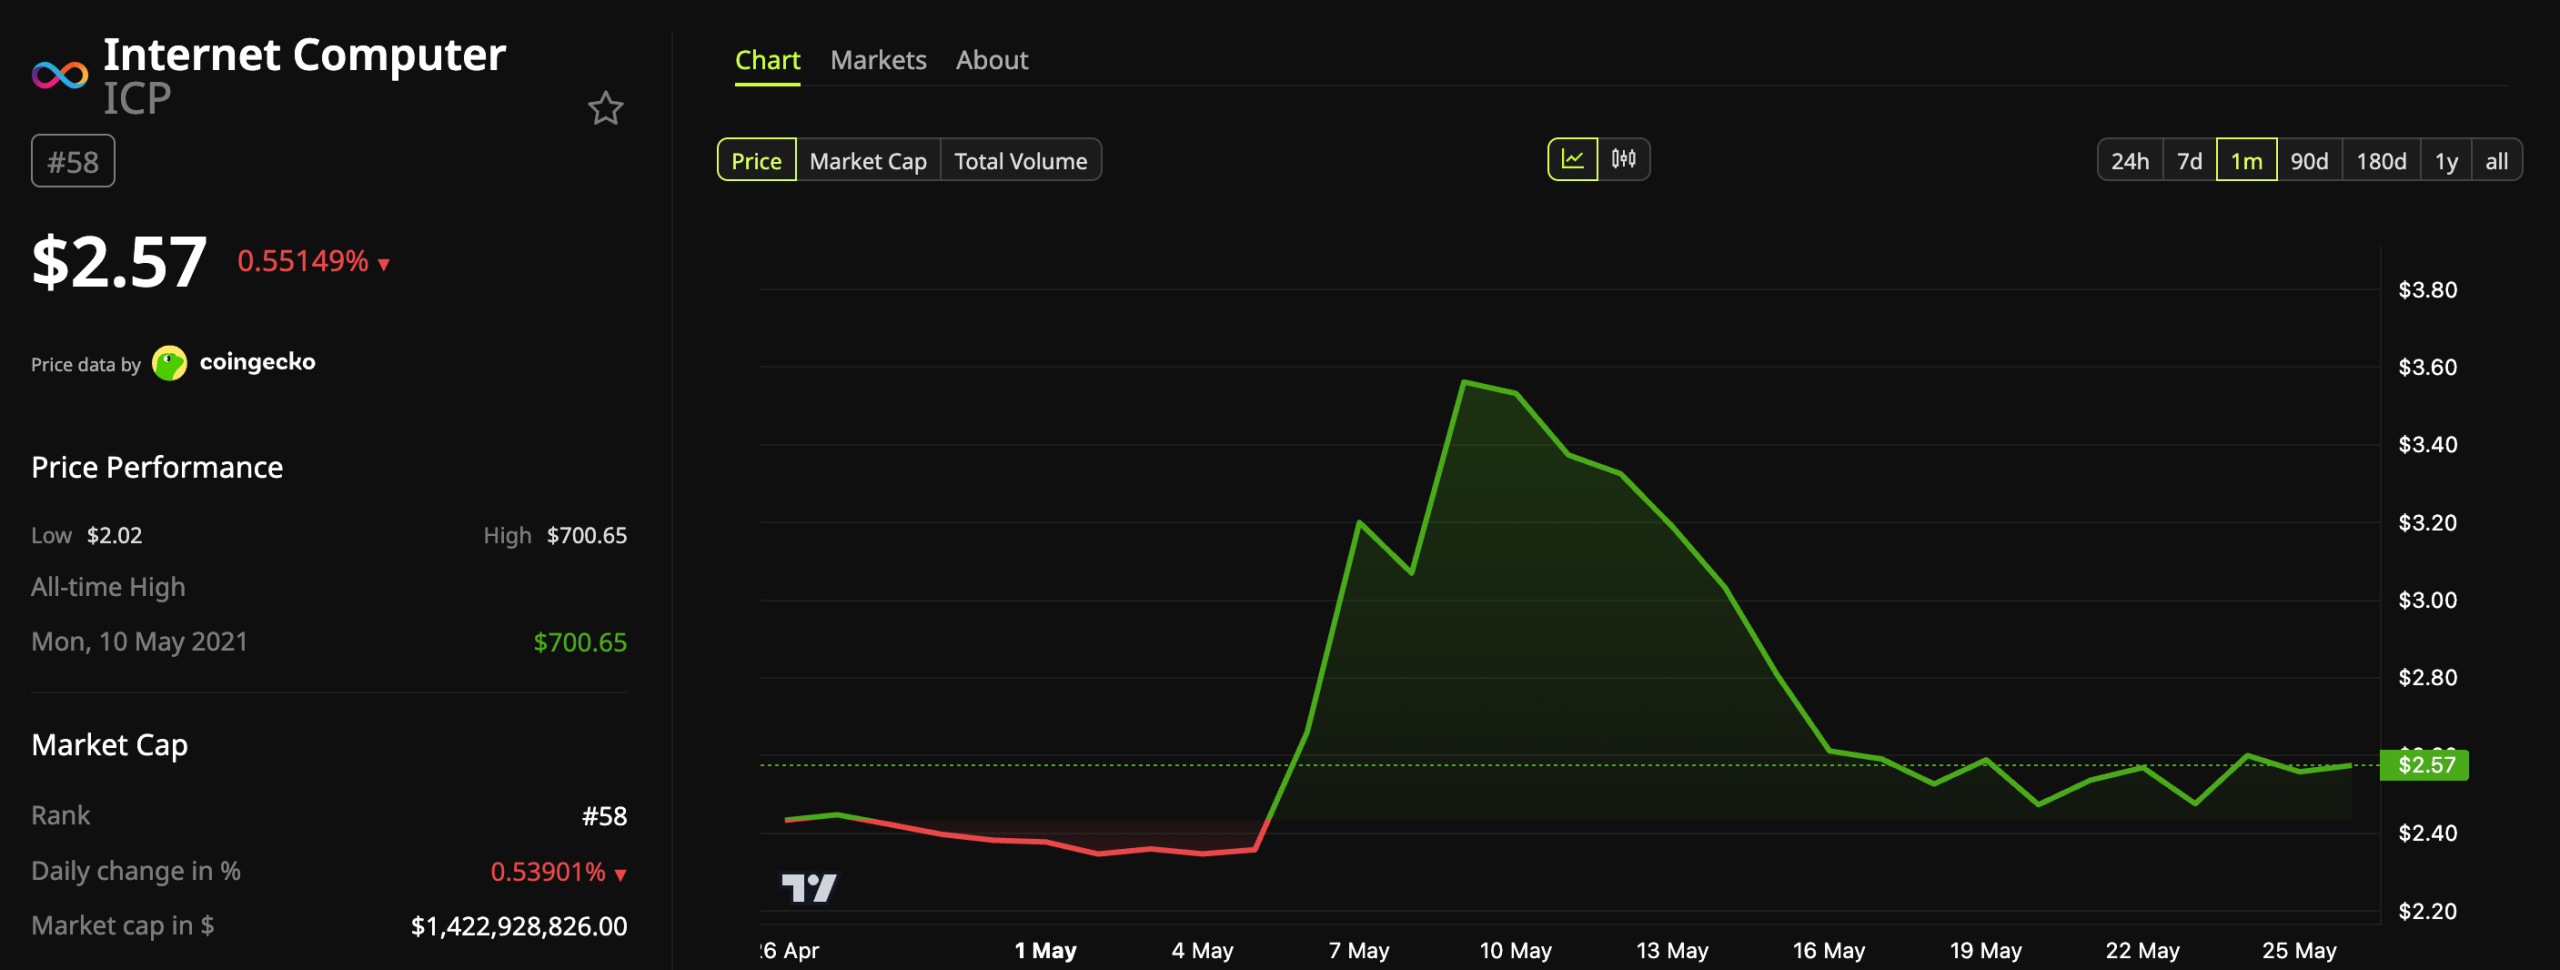
Internet Computer (ICP) led every major blockchain in transaction volume over the past 30 days.
Its volume reached roughly 6.5 billion on the Chainspect rankings dated May 24.
Follow us on X to get the latest news as it happens
The figure more than doubled Solana’s count of 2.9 billion. Fogo, BNB Chain, and TRON rounded out the top five on the same chart. Each network posted under 500 million transactions, leaving ICP and Solana alone at the top of the activity rankings.
This highlights strong network activity. Internet Computer splits its workload across more than 49 subnets. Each subnet runs an independent consensus, allowing the chain to scale horizontally instead of through a single execution layer.
Chainspect data shows ICP has processed 287 billion transactions since its May 2021 launch. The network currently processes 2,891 transactions per second, with 10.4 million in the past hour alone.
Despite the strong network activity, the price has faced headwinds. ICP token surged nearly 49% in early May. However, the altcoin has given up most of its gains, dropping over 28% since May 9.

At press time, ICP traded at $2.57, down 0.55% over the past day. The volume surge points to network health, but it has not yet sparked a meaningful price recovery. Whether the gap closes anytime soon remains an open question.
Subscribe to our YouTube channel to watch leaders and journalists provide expert insights
The post Internet Computer Beats Solana and BNB Chain in 30-Day Activity Race appeared first on BeInCrypto.

The Bitcoin price prediction today shows the asset is trading around $77,400 after a modest +0.9% pump over the past 24 hours. Institutional infrastructure is expanding at its fastest pace in years, yet the spot price is in a technically fragile zone that analysts call “the edge of a cliff.”
Last week, the US Securities and Exchange Commission granted Nasdaq PHLX conditional approval to list European-style, cash-settled BTC index options under the ticker QBTC. These contracts track the CME CF Bitcoin Real-Time Index (BRTT), settle in US dollars, and, crucially, require no separate derivatives account, meaning traders can execute bitcoin volatility bets directly through standard brokerage platforms.
Each contract represents exactly 1 BTC of exposure (versus CME’s 5 BTC minimum), a reduction in size that makes precision hedging accessible to a much wider institutional audience. Bitcoin’s growing presence on Nasdaq-listed vehicles is becoming a pattern, not a novelty.
One catch remains: the Commodity Futures Trading Commission must still grant exemptive relief before QBTC options can actually trade. The SEC approval is real, but the product is not yet live.
Bitcoin Price Prediction: Can BTC USD Recover Above $80,000 Before the CFTC Decision?
The Bitcoin price prediction picture is under genuine pressure. The 50-day EMA has already been breached during recent US trading sessions, shifting near-term momentum firmly to the bears. The 200-day EMA near $76,500 is now the line in the sand; lose that, and the corrective structure deepens considerably.
On the upside, resistance layers stack quickly: the 20-day EMA sits near $78,800, followed by horizontal resistance around $79,600, and last week’s local high near $81,750.
Three scenarios deserve attention.
Bull case: the 200-day EMA holds, ETF inflows accelerate, and CFTC approval timing leaks bullishly, BTC reclaims $79,500–$81,000 within days.
Base case: price consolidates between $76,400 and $78,000 for one to two weeks while the market waits for regulatory clarity on QBTC.
Bear/invalidation: a daily close below $74,000 opens the door to a flush toward the $69,000–$72,000 range, where significant on-chain support clusters.
Discover: The Best Crypto to Diversify Your Portfolio
Bitcoin Hyper Targets Early-Mover Upside as Bitcoin Tests Key Levels
Here’s the uncomfortable reality for spot BTC traders right now: even a clean recovery to $80,000 represents roughly a 5% move from current levels. For risk-adjusted upside, some institutional desks are already looking further down the stack, specifically at Bitcoin-native infrastructure plays that haven’t yet been priced by the broader market.
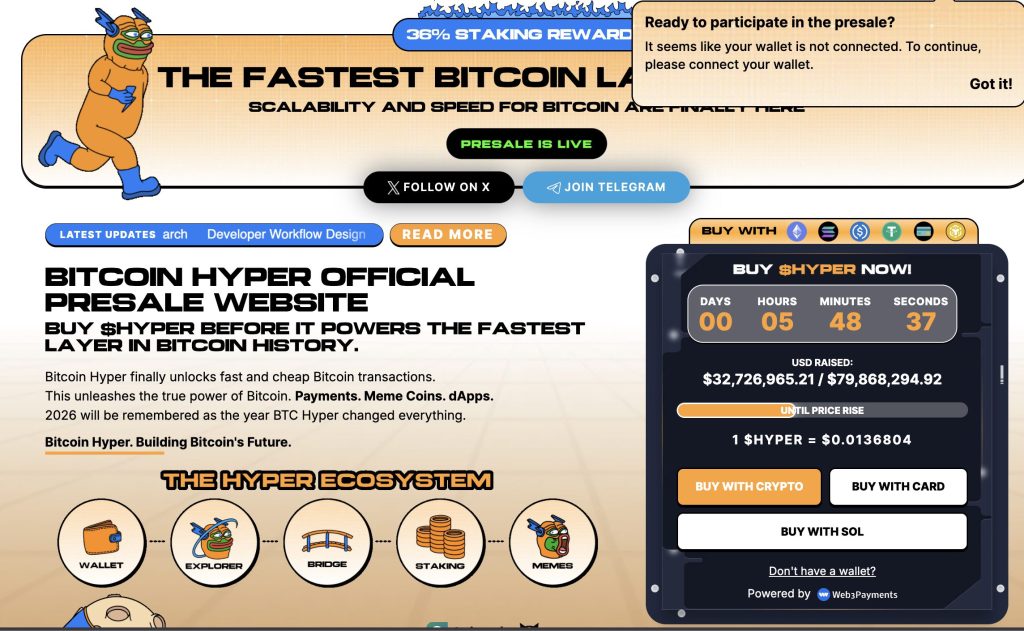
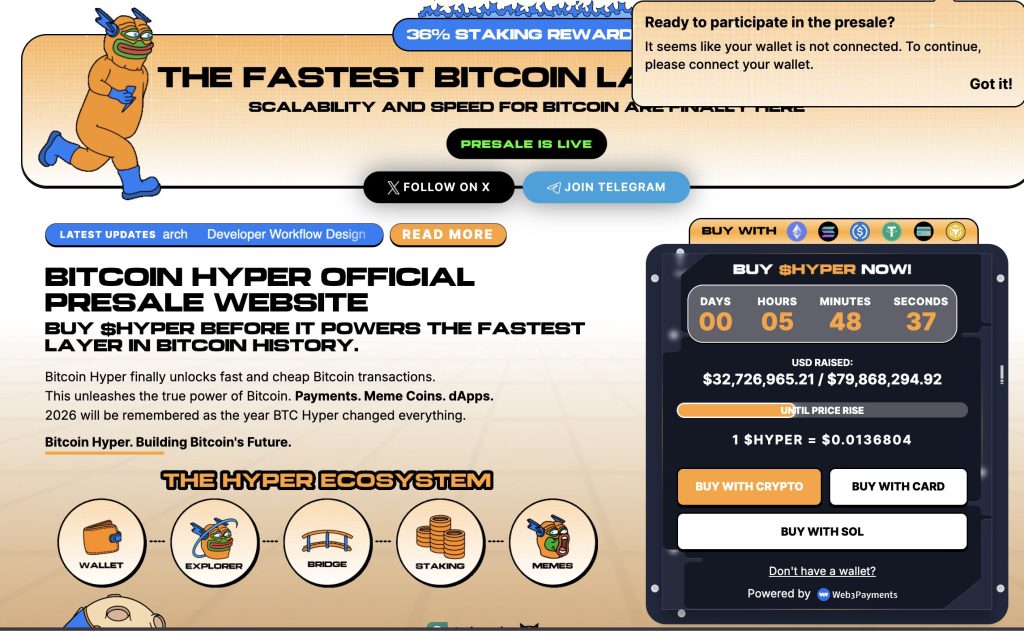
Bitcoin Hyper ($HYPER) is generating attention as the first Bitcoin Layer 2 to integrate the Solana Virtual Machine (SVM), a combination that, in theory, delivers sub-second finality and programmable smart contract execution while inheriting Bitcoin’s base-layer security.
The project has raised $32.7M at a current presale price of $0.0136806, with staking already live. The structural thesis is straightforward: as Nasdaq-level products bring institutional capital into the BTC ecosystem, demand for faster, cheaper, programmable Bitcoin infrastructure logically follows.
Bitcoin’s historical bear market patterns also suggest that infrastructure built during consolidation phases tends to capture a disproportionate share of the upside in the next expansion. Those who want to explore the project further can learn more about Bitcoin Hyper here.
Discover: The Best Token Presales
This article is for informational purposes only and does not constitute financial advice. Cryptocurrency investments are highly volatile. Always do your own research.
The post Bitcoin Price Prediction: BTC Options Coming to Nasdaq appeared first on Cryptonews.
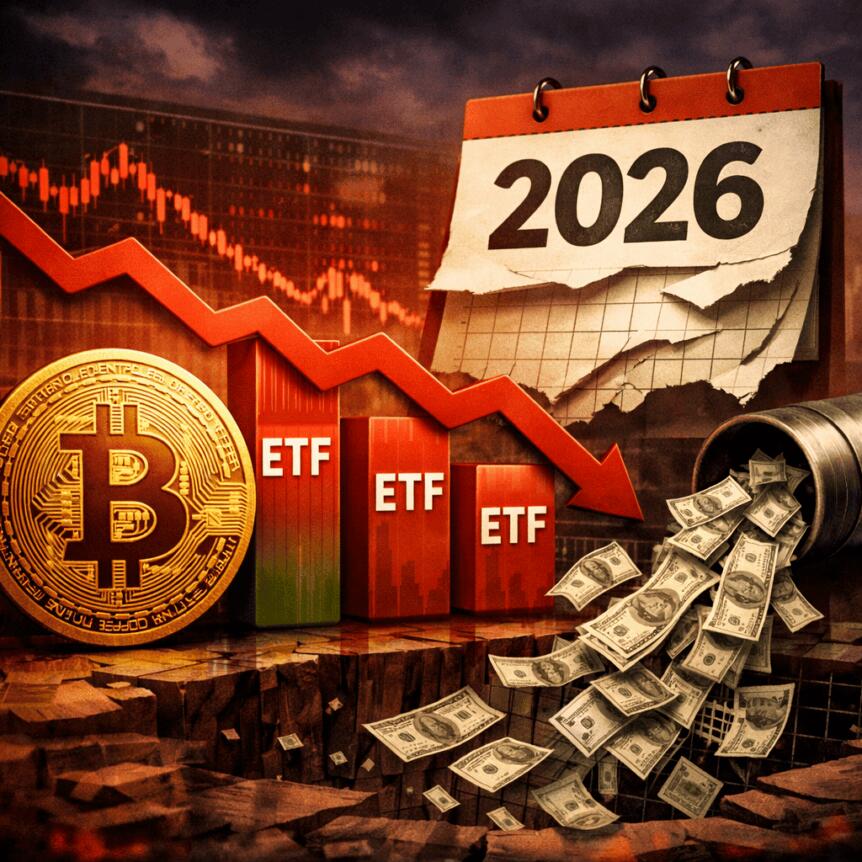
The US market for spot Bitcoin ETFs continues to wobble as Friday produced six straight days of outflows across the sector, even as year-to-date inflows remain in positive territory. Net inflows into US spot Bitcoin ETFs have cooled to roughly $536 million in 2026, with a Friday session that shaved another $105.2 million from fund totals. The bulk of 2026 demand remains focused on the iShares Bitcoin Trust (IBIT), which posted prominent net inflows of about $2.7 billion so far this year, while other funds saw red ink amid a crowded, fee-sensitive landscape.
On Friday, IBIT led the retreat, losing about $68.9 million, while the Fidelity Wise Origin Bitcoin Fund (FBTC) posted outflows of roughly $36.3 million. In aggregate, the broader group recorded $105.2 million in net withdrawals, contributing to a running total of about $1.55 billion in net outflows since May 14—the last date when any US spot Bitcoin ETF registered a net inflow. Data provider Farside Investors tracks flows across the U.S. spot Bitcoin ETF lineup, illustrating how investor demand has coalesced around a single large product while other funds struggle to keep pace.
Despite the churn, IBIT’s dominance remains intact for the moment. The fund’s cumulative inflows for 2026 are a major driver of the mainstream ETF appetite for Bitcoin exposure, underscoring how institutional demand has persisted even as competition intensifies and fee structures come into sharper focus. The latest numbers place IBIT in a different league from its peers, reinforcing a pattern from recent years where one vehicle captures the lion’s share of inflows even as others wander in and out of net flow territory.
Key takeaways
- IBIT continues to be the primary beneficiary of 2026 inflows, with about $2.7 billion in net inflows year to date, dwarfing other ETF activity.
- Morgan Stanley’s MSBT has emerged as a notable new entrant, attracting $264 million in net inflows since its April 8 launch and surpassing the early products from Invesco and WisdomTree.
- The broader US spot Bitcoin ETF landscape remains in net inflow territory for 2026, but the pace of inflows is uneven, with a heavy tilt toward IBIT and mixed results elsewhere.
- In a sign of shifting risk and pricing dynamics, several institutions trimmed exposure: Jane Street reduced its Bitcoin ETF holdings by roughly 70% in Q1, and Goldman Sachs cut its position by about 10%.
- Interest in altcoin or Ether-focused ETFs has lagged relative to Bitcoin products, as Ether ETFs show net outflows and newer offerings have not attracted the same demand.
Growing competition shapes the Bitcoin ETF landscape
The launch of the Morgan Stanley Bitcoin Trust ETF (MSBT) on April 8 marks a significant milestone in the US Bitcoin ETF race. MSBT has drawn $264 million in net inflows to date, positioning it ahead of rival launches from Invesco and WisdomTree, which entered the market in January 2024. The early momentum for MSBT is widely interpreted as a sign that investors are price-conscious and looking for an ultra-low-fee option in a crowded field; the fund is notable for a market-low fee of 0.14% per year.
Industry observers also took note of the broader competitive dynamics. Bloomberg ETF analyst James Seyffart suggested that the decision by Yorkville America—the sponsor behind the Truth Social-linked Bitcoin ETF plan—to pull multiple crypto ETFs could reflect the intense competition in this space. The 0.14% MSBT fee is a particularly compelling draw in a market where expense ratios have long been a swing factor for investors weighing Bitcoin exposure versus other risk assets. Earlier reporting from Cointelegraph highlighted MSBT’s low-fee approach as a potential differentiator against established incumbents.
Albeit the MSBT development has been positive for Morgan Stanley, the rest of the sector remains mixed. Data show that while the US spot Bitcoin ETF market as a whole remains in positive inflows for 2026, most of that positive momentum has rested with IBIT. In contrast, several other funds have retraced in 2026, and the pace of new capital into the space is not yet on track to replicate the massive inflows seen in 2025, when a single product drew about $25 billion in net new money for that year. That comparison underscores the persistent, yet uneven, demand for regulated Bitcoin access among institutional players.
Performance snapshot for related products
Alongside Bitcoin-focused products, the ether ETF ecosystem has faced headwinds this year, with US-listed spot Ether ETFs registering net outflows so far in 2026. In contrast, new altcoin ETFs have not demonstrated the same appetite from investors, underscoring a preference for established Bitcoin exposure amid ongoing regulatory and market uncertainty. The shift also highlights how issuers and fund sponsors must navigate an evolving regulatory environment and competition when structuring futures or physically-backed vehicles.
Beyond the flows and fund performance, the sector’s sentiment has been shaped by notable strategic moves from Wall Street banks. In Q1, Jane Street reduced its Bitcoin ETF holdings by approximately 70%, a telling sign that even major market makers are rebalancing exposure in a climate of thin liquidity and shifting risk appetite. Goldman Sachs—another heavyweight in the ETF space—trimmed its Bitcoin ETF position by roughly 10% in the same period, signaling a broader recalibration of Bitcoin allocation among traditional banks’ investment desks. Earlier coverage from Cointelegraph noted Goldman’s reduced exposure to crypto-focused ETFs in the first quarter of 2026, reflecting a cautious stance amid regulatory and macro headwinds.
On the regulatory and market-facing side, there was chatter about the potential launch of a Truth Social-backed Bitcoin product before Yorkville America withdrew multiple crypto ETF bids for the social platform. The episode has been read by analysts as evidence of the highly competitive and rapidly evolving environment for crypto asset investment products, where timing, pricing, and sponsor strength all play a role in whether a fund can attract sustainable capital.
Flows compiled by Farside Investors show a clear concentration of investment interest in a single, well-known conduit for Bitcoin exposure. The data also illustrate how institutional demand often follows the path of least resistance—where size, liquidity, and a favorable fee structure align—rather than dispersing evenly across the entire ETF family.
What this means for investors is nuanced. The ongoing inflow strength of IBIT signals that large institutions remain willing to allocate capital to regulated, cash-settled Bitcoin exposure, especially when the structure includes a trusted sponsor and transparent fee economics. At the same time, the emergence of MSBT and the strong early momentum it has shown indicate that new entrants can capture meaningful shares if they can offer a compelling price point and a clean regulatory narrative. As the market moves forward, observers will watch whether MSBT and other entrants can sustain inflows in a year that is already notable for macro volatility and regulatory scrutiny.
For readers looking ahead, the central questions are where net flows will land in the coming quarters, how much demand will accrue to the largest fund IBIT versus newer entrants, and whether altcoin-focused ETF offerings will begin to close the gap with Bitcoin products. The next few monthly data cycles will be telling as investors digest evolving fee structures, sponsor credibility, and the broader macro backdrop that has driven crypto allocations in recent years.
In the meantime, the landscape remains a study in how institutional appetite for regulated crypto exposure coexists with competitive pressure and shifting sponsor strategies. The market is watching not just the totals, but the composition of inflows across products, as well as the actions of major market makers and banks that help determine liquidity and price discovery in this still-nascent segment of traditional finance.
Looking ahead, investors should monitor whether MSBT and other competitive launches can sustain momentum, whether IBIT maintains its leadership in inflows, and how regulatory developments may influence fund flows and product approvals. The story of 2026’s US spot Bitcoin ETF market is still being written, with the balance of power likely to shift as new entrants refine their offerings and institutions reassess their exposure to regulated crypto investments.

XRP price is flashing warning signs as exchange’s liquidity index for XRP dropped to its lowest level since 2020. This is a structural shift that could bring volatility.
The liquidity drop on Binance coincides with the drop in XRP spot volume following the market bloodbath. XRP price itself is down to $1.35, or 2% drop this week.
The combination of thin liquidity and a high-stakes ETF narrative creates a textbook setup for outsized moves. Here’s where the technicals actually stand.
Discover: The Best Crypto to Diversify Your Portfolio
Can XRP Price Reclaim $3.65 ATH or Is a Deeper Pullback Coming?
XRP price is consolidating below its recent high above $1.50 as it is barely holding the upper band of its weekly range. Support clusters around $1.31, the lower boundary of the seven-day trading band.
Momentum is mixed. The 0.5% drop daily is walking side to side with its futures activity and exchange-level stagnation. These have been flagged as compounding factors in recent weeks, and the Binance data confirms the pattern is deepening and far from resolving.

Three scenarios frame the near-term outlook.
Bull case: ETF approval speculation intensifies, and XRP retests $1.50, with DeepSeek’s AI model targets $5 by late 2025 if institutional adoption accelerates.
Base case: Consolidation continues in the $1.30-$1.40 range as the market waits for a formal catalyst like the Clarity Act.
Bear case: Liquidity deterioration accelerates, spreads widen further, and a flush toward $1.31 support becomes the path of least resistance.
The ETF flow dynamic remains the primary variable to watch heading into Q3.
Discover: The Best Token Presales
LiquidChain Targets Early-Mover Upside as XRP Tests Key Liquidity Levels
XRP’s low liquidity underscores a structural problem that extends beyond a single asset. Fragmented liquidity across chains creates the exact spreads and execution failures currently distorting XRP’s price feeds. For traders watching that dynamic, the infrastructure layer becomes the investment thesis.
LiquidChain ($LIQUID) is a Layer 3 infrastructure project built specifically to solve this. Its Unified Liquidity Layer fuses Bitcoin, Ethereum, and Solana liquidity into a single execution environment.
What happens when three great chains are meticulously unified? — LiquidChain (@getliquidchain) May 25, 2026
The LiquidChain L3.  ⟁https://t.co/vqvBcdSQYC pic.twitter.com/I6itOtiDP4
With Liquid, developers deploy once and access all three ecosystems simultaneously. Its Single-Step Execution and Verifiable Settlement are core architectural features, eliminating the multi-hop bridging that fragments liquidity in the first place.
The presale has breached $800K amount raised milestone at a current price of $0.01463 per $LIQUID. Capital rotation into on-chain infrastructure has been accelerating as the $1M milestone approaches.
Research LiquidChain here before the next price tier opens.
The post XRP Price Outlook: Exchange’s Liquidity Lowest Since 2020 appeared first on Cryptonews.
Crypto World
Ethereum Price Prediction: Vitalik Streamlines Operations to Curb Ethereum Foundation Selling

In a candid Twitter post, Vitalik Buterin remarks on the Ethereum Foundation’s future direction with a structural reset that could change ETH’s long-term dynamics. This has brought the Ethereum price prediction into bullish territory.
Buterin published a lengthy personal statement outlining his vision for a leaner, more principled Ethereum Foundation, explicitly acknowledging that his own influence within the organization will continue to diminish, a transition he “personally welcomes.”
Crucially, the post signals reduced selling pressure from the Foundation going forward as operational streamlining takes hold. Vitalik framed the EF’s evolution through a sharp analogy, saying that Google once carried idealistic founding principles before commercial pressures eroded them.
Buterin’s message was blunt, and Ethereum must not repeat that mistake.
Discover: The Best Crypto to Diversify Your Portfolio
Ethereum Price Prediction: Can ETH Break Downtrend as Foundation Selling Pressure Eases?
ETH is still in the $2,100 handle this week, a weekly support after a brutal downtrend from $2,500. The stable daily candle this week came with visible accumulation signals that show slow positioning.
Currently, we are seeing an inverse head-and-shoulders pattern on the daily chart, with the neckline sitting near $2,150. If ETH breaks decisively above it, this pattern projects a measured target of around $2,600.
For ETH, it needs to at least hold above $2,150 on a weekly close. If the pattern confirms, momentum could carry it toward $2,400 first, then back above $2,500.

But the most likely scenario would likely see a Consolidation between $2,100-$2,200 through mid-year as macro conditions remain mixed, with $2,400 target acting as near-term resistance.
ETH’s ETF dynamics have added another layer to the structural demand picture, with institutional flows increasingly cited as a non-trivial price driver heading into the second half of 2025.
Discover: The Best Token Presales
Bitcoin Hyper Offers Early Mover Upside as ETH Stuck in $2,000 range
ETH is compelling, but the ceiling on a $250 billion asset is structurally different from what’s possible at the seed stage. Traders who’ve already captured the ETH move are quietly rotating into earlier-stage infrastructure plays where the asymmetry is sharper. That’s where Bitcoin Hyper ($HYPER) enters the picture.
Bitcoin Hyper is positioning itself as the first-ever Bitcoin Layer 2 with full Solana Virtual Machine (SVM) integration. It delivers sub-second finality and low-cost smart contract execution directly on top of Bitcoin’s security layer.
The pitch: Bitcoin’s trust, Solana’s speed, none of the trade-offs.
The presale has raised $32.7 million at a current price of $0.0136, with staking already live and generating high APY for early participants. A decentralized canonical bridge handles native BTC transfers, preserving the trustless architecture that Bitcoin holders actually care about.
Research Bitcoin Hyper before the next price tier.
The post Ethereum Price Prediction: Vitalik Streamlines Operations to Curb Ethereum Foundation Selling appeared first on Cryptonews.
Crypto World
Robotics Revolution: How Three Stocks Are Capitalizing on the $200B Humanoid Robot Boom

Key Takeaways
- Barclays projects the humanoid robotics sector will surge from approximately $2–3 billion currently to $200 billion by 2035
- Manufacturing costs per humanoid unit have plummeted from $3 million ten years ago to roughly $100,000 today
- AeroVironment delivered 143% revenue expansion to $408 million with a funded backlog exceeding $1.1 billion
- Rockwell Automation achieved 12% sales increase and 36% operating earnings growth in fiscal Q1 2026
- Symbotic reached profitability with $630 million in quarterly revenue, marking 29% annual growth
The humanoid robotics sector is experiencing explosive expansion, with several publicly-traded companies already capturing substantial market share. The financial data paints a compelling picture.
A recent Barclays analysis forecasts the humanoid robot industry will balloon to $200 billion by 2035. Current market valuation sits between $2 billion and $3 billion. While this represents massive growth, the underlying fundamentals support these projections.
Manufacturing expenses for humanoid robots have experienced a dramatic decline, falling from approximately $3 million per unit ten years ago to roughly $100,000 currently. Chinese producers have driven prices even lower through mass production capabilities and vertically integrated manufacturing ecosystems.
Deployment rates are climbing rapidly. Approximately 2,000 units entered service during 2024. This figure jumped to 15,000 throughout 2025, with forecasts indicating 60,000 installations in 2026. China dominates with roughly 85% of worldwide deployments, supported by significant government initiatives.
Barclays characterizes humanoid robots as the evolution beyond traditional industrial machinery and digital AI systems. Unlike previous generation robots engineered for narrow applications, humanoids function effectively in human-designed environments, utilizing standard tools and facilities without requiring extensive infrastructure modifications.
Market drivers include demographic aging trends, workforce availability constraints, and increasing challenges recruiting workers for physically intensive roles across manufacturing, distribution, healthcare, and elderly care sectors.
The research highlights three core technology pillars enabling humanoids: brains, encompassing artificial intelligence algorithms and sensor arrays; brawn, representing actuators and physical mechanics; and battery systems providing operational power.
Public Companies Showing Strong Performance Metrics
Beyond long-range forecasts, several corporations are delivering impressive financial performance right now.
AeroVironment, specializing in military drones and autonomous aerial systems, announced fiscal third quarter revenue reaching $408 million. This represented a remarkable 143% year-over-year increase. The company maintains a funded backlog totaling $1.1 billion, with management projecting fiscal 2026 revenue between $1.85 billion and $1.95 billion.
Rockwell Automation, a major industrial automation provider, recorded sales of $2.105 billion during fiscal Q1 2026, representing 12% year-over-year growth. Total segment operating earnings climbed 36% during the identical timeframe. Annual recurring revenue expanded 7%.
Symbotic, concentrating on warehouse automation and intelligent supply chain technologies, disclosed $630 million in fiscal Q1 2026 revenue, reflecting 29% year-over-year advancement. The organization achieved profitability, recording net income of $13 million versus a $17 million net loss in the prior year period. Second quarter revenue guidance targets $650 million to $670 million.
Investment Implications and Market Outlook
Financial markets are increasingly prioritizing concrete performance over speculative potential in robotics companies. Emphasis has transitioned toward quantifiable metrics: revenue expansion, margin enhancement, and robust order pipelines.
Barclays estimates the comprehensive physical AI ecosystem, incorporating autonomous transportation, unmanned aerial vehicles, and sophisticated robotics platforms, could achieve valuations approaching $1 trillion by 2035.
Investment strategies span humanoid manufacturers, component providers, and specialized robotics exchange-traded funds.
The three enterprises examined represent distinct robotics segments, spanning defense unmanned systems to industrial automation to warehouse optimization. Each company reported recent quarterly financials demonstrating sustained expansion with forward guidance signaling continued momentum.


Key Highlights
- Over the past year, Alphabet’s stock has climbed approximately 130%, pushing its market capitalization to $4.6 trillion.
- First quarter 2026 revenue reached $109.9 billion, representing 22% annual growth — the strongest pace in four years.
- Google Cloud’s revenue surged 63% compared to last year, supported by a $462 billion customer backlog.
- The Gemini AI platform now serves over 650 million monthly active users, reflecting 45% quarterly expansion.
- Capital spending is projected at $180–$190 billion for 2026, sparking debates over future profitability.
Alphabet (GOOGL) shares are currently hovering near $383, marking an impressive 130% gain over the trailing twelve months. This performance positions the tech giant among the top-performing large-cap stocks of the year, with a market valuation of $4.6 trillion — trailing only Nvidia in size.
The extraordinary rally stems primarily from a single catalyst: artificial intelligence progress that’s translating into measurable financial results.
During the first quarter of 2026, Alphabet reported revenue of $109.9 billion, marking a 22% year-over-year climb that surpassed analyst projections. This represented the company’s most robust revenue expansion in four years.
Google Search revenue advanced 19% from the prior year. Chief Business Officer Philipp Schindler attributed the strength to AI Overviews and AI Mode, which have driven increased search activity, particularly in commercial queries.
YouTube advertising revenue expanded nearly 11%, while Waymo is now handling more than 500,000 weekly rides.
Cloud Division Steals the Spotlight
Google Cloud emerged as the quarter’s undisputed champion. Revenue soared 63% year over year — outpacing both Amazon Web Services and Microsoft Azure’s growth rates.
The division concluded Q1 with an impressive $462 billion customer backlog, nearly twice the level recorded three months earlier. Market analysts are forecasting 60% year-over-year cloud revenue growth for fiscal 2026, approximately 11% above consensus projections.
Backlog expansion accelerated to 82% in recent quarters, up sharply from 37% in the previous period — an indicator of robust pipeline visibility.
Gemini’s Rapid User Expansion
The Gemini AI platform has accumulated more than 650 million monthly active users, representing 45% quarter-over-quarter growth. Daily active mobile users increased 14%, while monthly engagement climbed 18%.
The Gemini 3.0 rollout received positive market reception, alleviating concerns about potential search cannibalization. Additional growth opportunities include consumer subscription offerings and a potential integration with Apple’s Siri assistant.
Alphabet’s adjusted operating margin reached 39.7% after accounting for a $3.5 billion European Commission penalty — exceeding market expectations.
The stock currently trades at a price-to-earnings multiple of approximately 29.6. Wall Street analysts anticipate diluted earnings per share will compound at roughly 17% annually from 2025 through 2028. Fiscal 2026 revenue is estimated at $479.86 billion, climbing to $561.50 billion in 2027. Thirty analysts have recently increased their earnings forecasts for upcoming periods.
The Capital Investment Challenge
This growth trajectory requires significant investment. Alphabet allocated $91 billion to capital expenditure in 2025 and plans $180–$190 billion in 2026. CFO Anat Ashkenazi has indicated that capex will increase further in 2027.
The company also intends to scale compute capacity to 35 gigawatts by 2028. Analysts project capex could reach $124 billion in 2026 as infrastructure buildout continues.
Elevated depreciation from these investments will pressure margins in coming periods. Analysts believe robust cloud and search performance will counterbalance this impact, though investment returns remain the critical variable.
Wells Fargo maintains a $387 price target with an Overweight rating, while Bank of America carries a Buy recommendation with a $335 price objective.
Hyperliquid’s native token HYPE has surged more than 40% over the past seven days, fueled by aggressive institutional accumulation, fresh all-time highs in derivatives activity, and a major technical breakout that has traders eyeing another leg higher.
Summary
- Hyperliquid price has surged more than 40% over the past week, supported by ETF inflows, protocol buybacks, and rising perpetual futures activity.
- CoinGlass liquidation data showed heavy short liquidation clusters between $65 and $66.7, raising the possibility of a fresh squeeze if bulls break higher.
- Whale activity intensified during the rally, with trader Garrett Jin accumulating over $9 million in HYPE while other large holders placed sell orders near the $70 region.
According to data from crypto.news, Hyperliquid (HYPE) climbed from around $45 last week to an intraday high near $64 on May 25 before consolidating around the $63 region at press time. The move came even as Bitcoin struggled to decisively reclaim the $110,000 level and several large-cap altcoins traded sideways amid renewed macro uncertainty tied to U.S. Treasury yields and Federal Reserve rate expectations.
Institutional catalysts have played a central role in the rally. Earlier this month, both the 21Shares Hyperliquid ETF and Bitwise’s Hyperliquid ETF debuted on U.S. exchanges, opening direct institutional access to HYPE exposure. Combined inflows into the two products reportedly surpassed $53 million during their opening sessions, adding significant spot demand pressure to an already supply-constrained market.
Adding to the bullish narrative, Bitwise disclosed that it would allocate 10% of ETF management fees toward purchasing and holding HYPE tokens on its balance sheet. Traders interpreted the move as an early sign that asset managers may begin treating HYPE as a strategic treasury asset rather than merely a speculative trading token.
Meanwhile, the protocol’s structural partnership with Coinbase and Circle under the AQAv2 framework strengthened the long-term revenue outlook for Hyperliquid’s ecosystem.
Coinbase agreed to route a large share of reserve-yield revenues generated from USDC deployed on Hyperliquid back into the protocol, while Circle committed to staking 500,000 HYPE tokens to support liquidity infrastructure on the network.
Protocol fundamentals have accelerated alongside the price rally. Hyperliquid’s perpetual futures platform recently crossed record volumes in synthetic commodities, binary prediction contracts, and pre-IPO trading markets, sharply boosting fee generation. Forbes previously noted that between 97% and 99% of all trading fees generated on Hyperliquid are redirected toward automatic HYPE buybacks through its on-chain Assistance Fund.
As trading activity intensified, the protocol’s buyback engine continuously purchased HYPE tokens at block intervals, creating a feedback loop between rising volumes and spot demand. Traders increasingly view the model as one of the most aggressive deflationary mechanisms currently operating within crypto markets.
Whale activity has added another layer of volatility to the recent move. According to blockchain tracking platform Lookonchain, trader Garrett Jin accumulated 145,050 HYPE worth roughly $9.05 million over the past four days and simultaneously placed a TWAP order to acquire an additional 39,940 HYPE valued near $2.44 million.
At the same time, not all large holders are positioning for further upside.
The positioning suggests some whales are beginning to distribute into strength as HYPE price approaches psychologically important resistance zones.
Can Hyperliquid’s technical breakout trigger another rally?
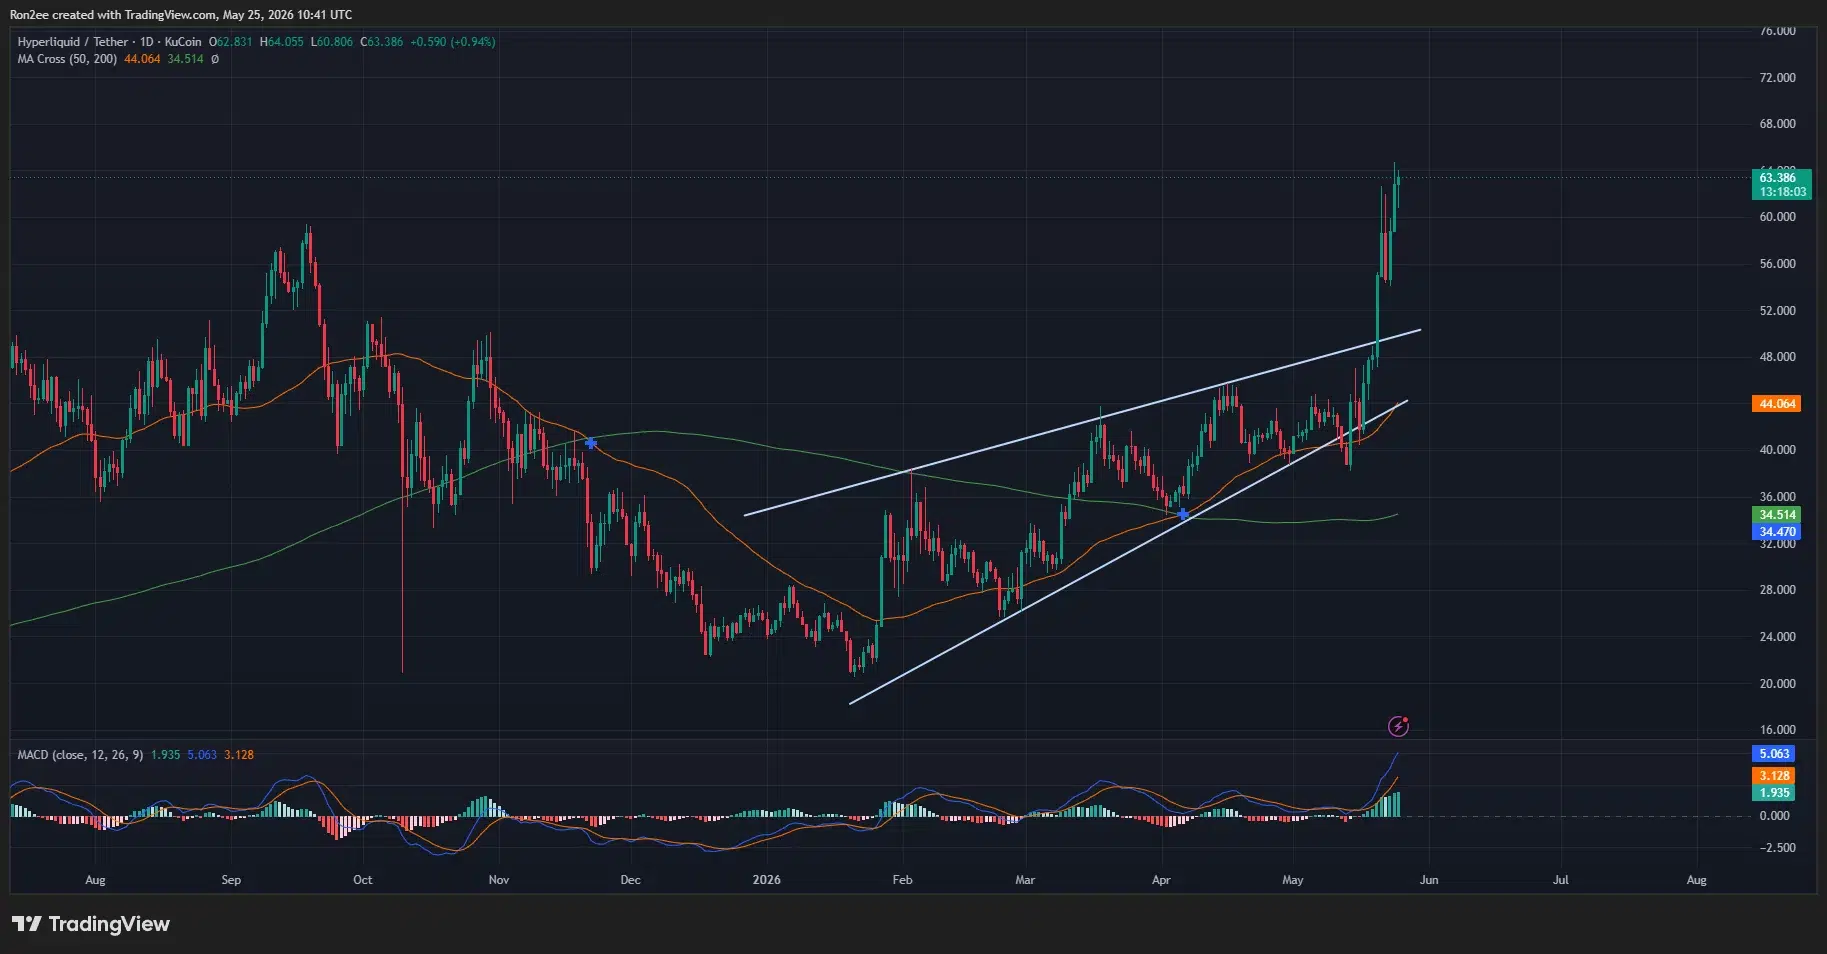
On the daily chart, HYPE appears to have completed a powerful breakout from a multi-month ascending channel formation that had capped price action since February.
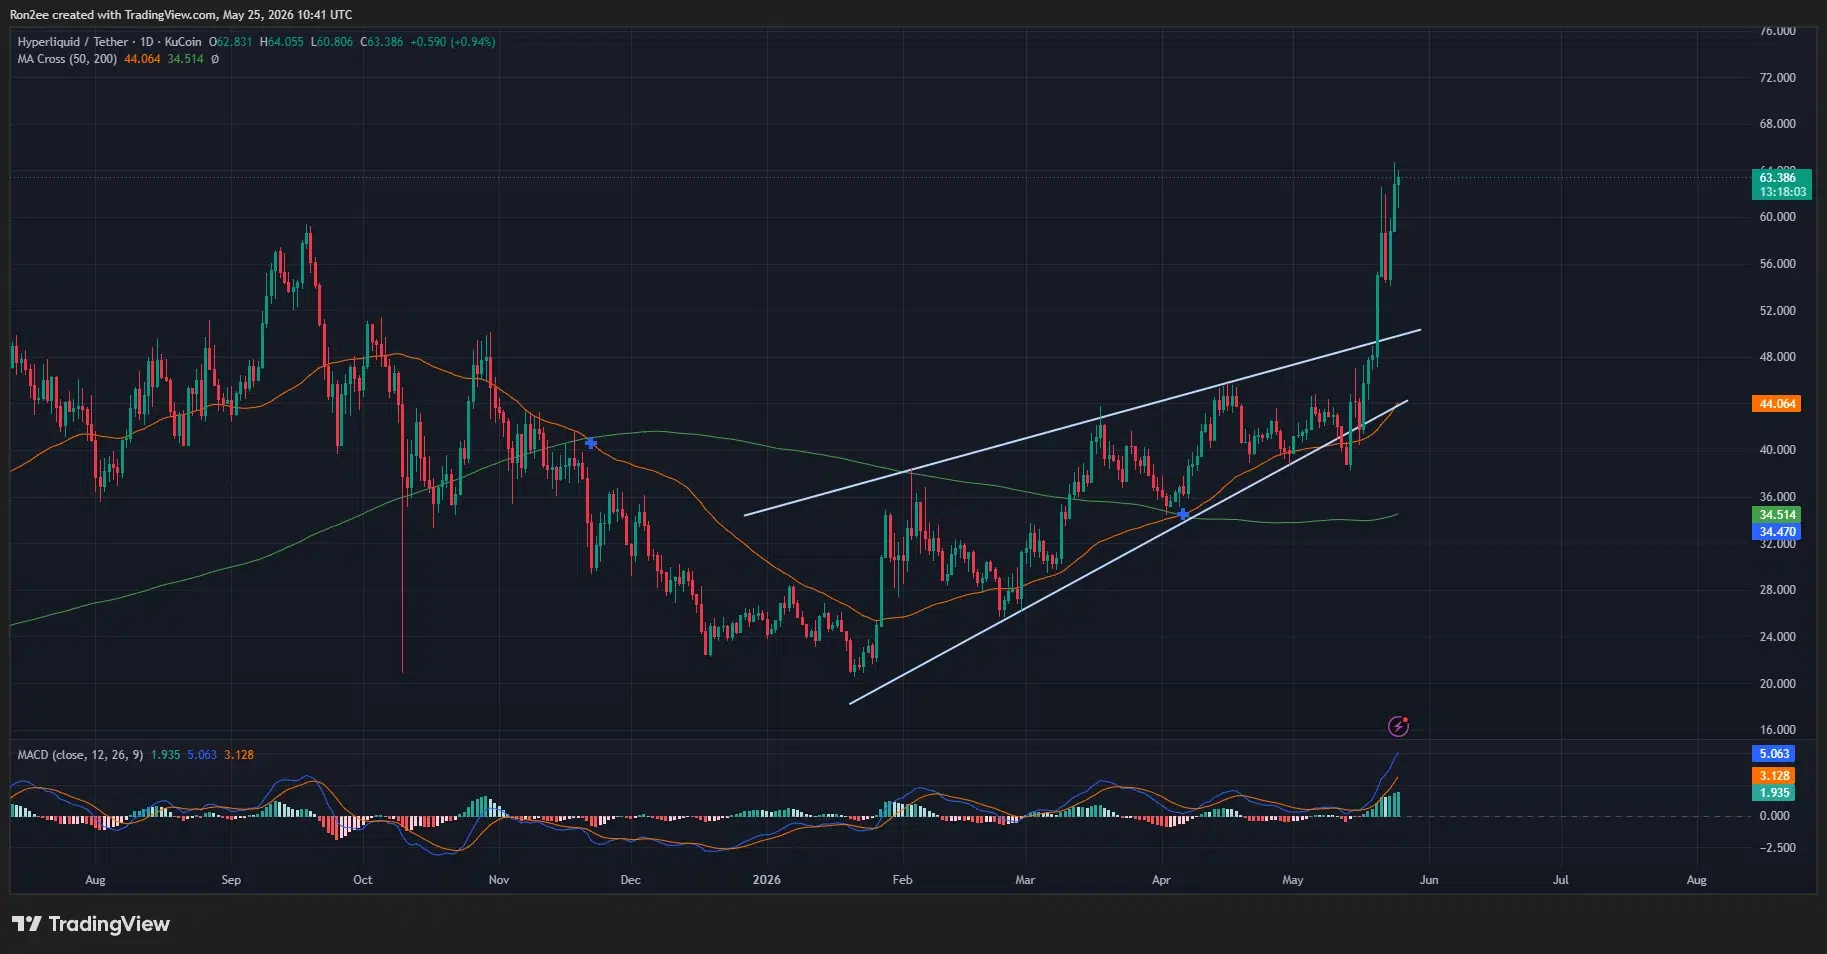
After consolidating near the upper trendline throughout April and early May, bulls forced a vertical breakout above channel resistance near $50, triggering an accelerated momentum move toward the current $64 region. The breakout also invalidated previous bearish divergence concerns that had emerged earlier this quarter.
The 50-day moving average currently sits near $44 while the 200-day moving average remains around $34.5, highlighting the strength of the ongoing trend structure. HYPE continues to trade substantially above both key support levels, a setup that typically signals strong bullish continuation conditions.
Momentum indicators have also turned decisively bullish. On the daily timeframe, the MACD histogram remains deeply positive while the MACD line continues expanding above its signal line after a strong crossover earlier this month. Expanding histogram bars suggest buying momentum has not yet fully exhausted itself despite the steep rally.
Derivatives positioning also points toward elevated volatility ahead. According to CoinGlass liquidation heatmaps, large leveraged short liquidation clusters are concentrated between $65 and $66.7. A decisive breakthrough in this region could trigger forced liquidations from overleveraged bears, potentially accelerating upside momentum in a short squeeze scenario.
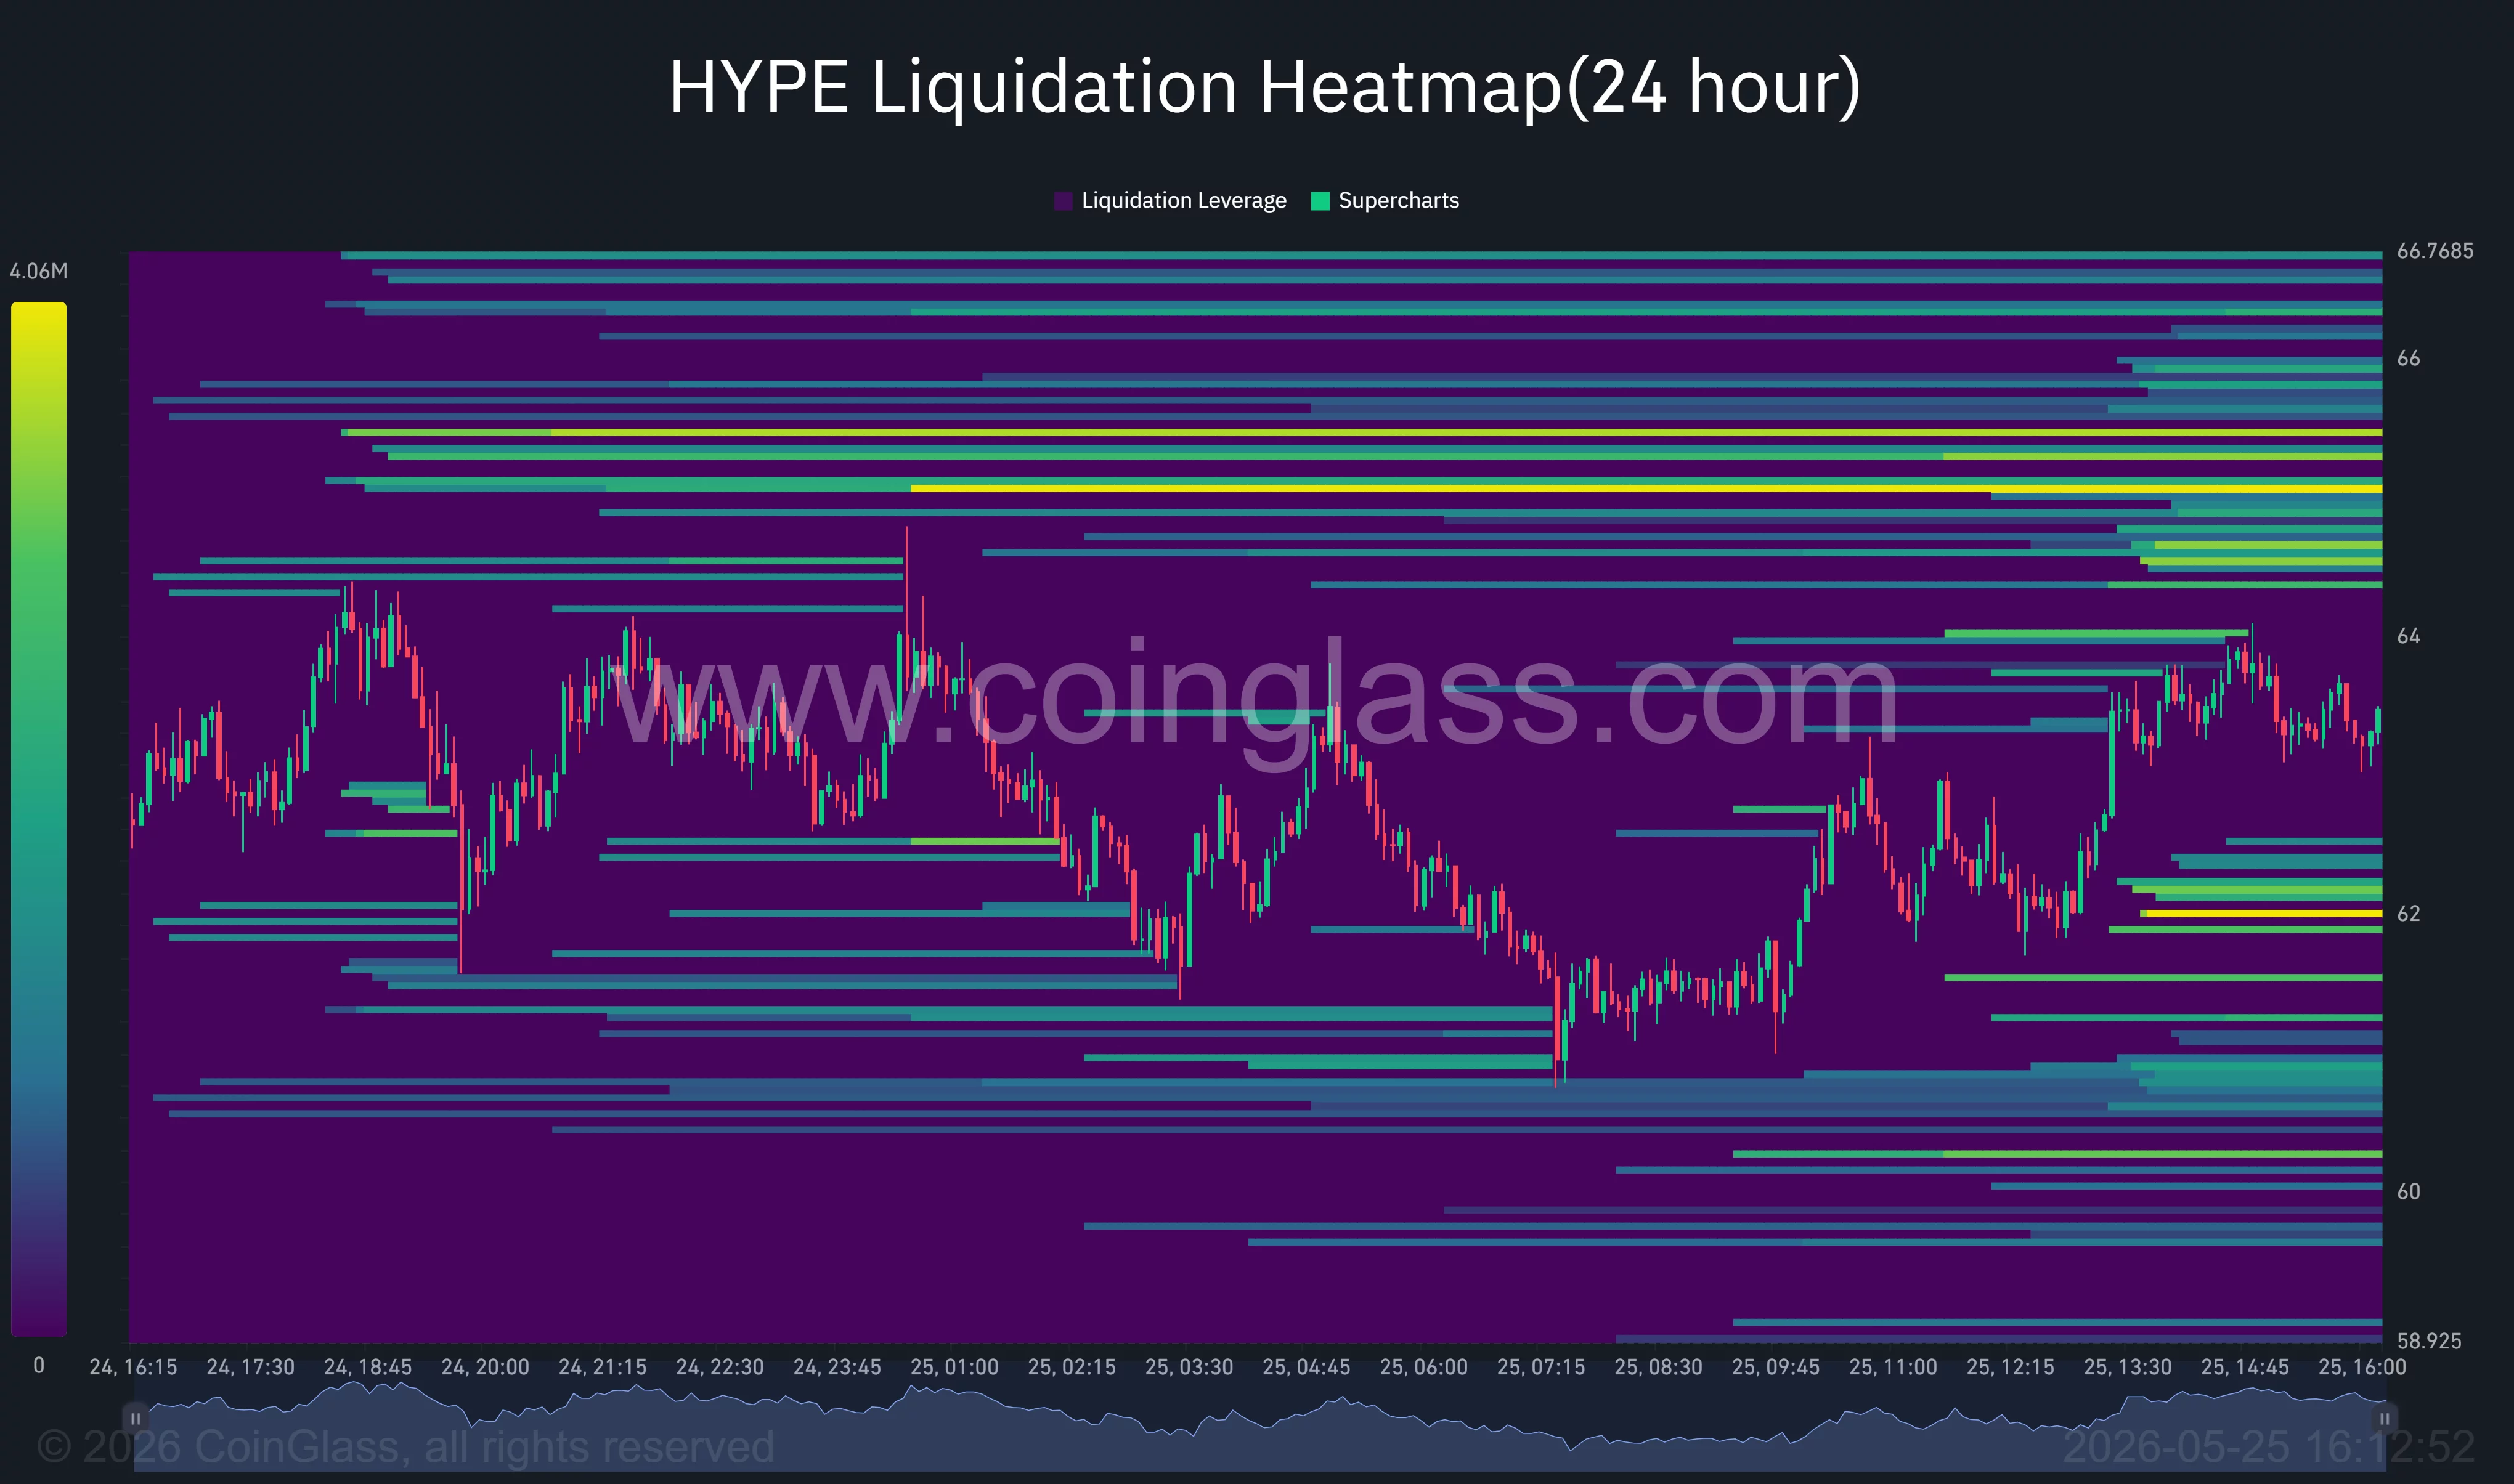
Beneath current prices, notable liquidity pockets have formed near $61 and $60.5, creating important short-term support zones in the event of profit-taking pressure. Heavy leverage concentration around these levels suggests bulls will likely attempt to defend them aggressively during pullbacks.
Funding rates across major exchanges have remained positive but have not yet reached the overheated extremes typically associated with local cycle tops. Open interest, however, has climbed sharply alongside price, indicating new leveraged positions continue entering the market rather than traders merely closing shorts.
Market analyst Altcoin Sherpa noted on X that HYPE remains “one of the strongest trend structures in crypto right now,” adding that momentum traders will likely continue buying dips unless Bitcoin experiences a sharp macro-driven correction.
What risks could slow the HYPE rally?
Despite the strong trend, several macro and market risks could disrupt the rally over the coming sessions.
Federal Reserve policy expectations remain a major variable for speculative assets. Recent U.S. economic data showed inflation pressures stabilizing more slowly than expected, pushing Treasury yields higher and reducing expectations for immediate rate cuts. Higher yields have historically pressured risk assets, particularly highly leveraged crypto trades.
Oil markets also remain volatile amid ongoing geopolitical tensions surrounding Iran and shipping flows through the Strait of Hormuz. Sudden spikes in crude prices could weaken overall market risk appetite, even though Hyperliquid has benefited from increased commodities trading activity tied to these same tensions.
Profit-taking pressure from whales may also intensify near the $65 to $70 region, particularly as traders begin locking in gains after HYPE’s nearly uninterrupted multi-week advance. Large limit sell walls identified by on-chain trackers could temporarily cap upside momentum unless fresh spot demand absorbs the supply.
Still, structural demand drivers continue supporting the bullish case. ETF inflows, automatic protocol buybacks, expanding derivatives volume, and institutional integrations have combined to create one of the strongest narrative setups currently present in the altcoin market.
If bulls successfully clear the $66.7 liquidation cluster in the near term, the next major psychological resistance sits near $70, followed by a potential extension toward the mid-$70 range. Failure to hold above the $60 support zone, however, could expose HYPE to a deeper retracement toward the breakout region near $50, where previous channel resistance may now act as support.
Disclosure: This article does not represent investment advice. The content and materials featured on this page are for educational purposes only.

- Deel launched stablecoin salary payouts on Polygon for full-time employees on May 20, 2026, starting with eligible users in the US and Eurozone.
- The rollout places crypto payroll inside HR software used by global employers, rather than inside crypto-native contractor products alone.
- Competitors such as Toku, Rise, and Bitwage show payroll already has meaningful stablecoin usage, with volume, compliance, and off-ramp access becoming the main tests.
Deel launched stablecoin salary payouts for full-time employees on Polygon, starting with eligible customers in the US and Eurozone. Employees can choose a stablecoin allocation from net salary after taxes and deductions, while employers keep existing payroll workflows, funding options, and compliance processes inside Deel. The product operates inside a global HR platform with 40,000+ customers, service across 150+ countries, and more than $20 billion in processed global payroll.
Importantly, stablecoin pay now appears inside payroll, employment, tax, and HR records, where finance teams already manage salaries.
The launch arrives in a $322.9 billion stablecoin market:
- DeFiLlama data shows USDT with 58.7% market share, while USDC remains the second-largest dollar stablecoin;
- Visa has also expanded its stablecoin settlement pilot to nine blockchains and reported a $7 billion annualized settlement run rate in April 2026, up 50% from the prior quarter.
Payroll is a serious commercial test, where companies need stablecoin payouts to work alongside tax, labor law, KYC, sanctions checks, reporting, support, and reconciliation.
Payroll as a Harder Stablecoin Use Case
Contractor payouts gave stablecoin payroll its early market. Freelancers, DAO contributors, and Web3 teams often cared more about speed and dollar access than conventional employee benefits. Employers also faced fewer full-time employment obligations in many contractor workflows.
Employee payroll is a stricter environment. Salary payouts pass through gross-to-net calculations, statutory deductions, employer records, paid leave, benefits, local reporting, and worker support. A missed invoice can be escalated manually. A late salary creates legal, operational, and reputational exposure.
This is why Deel’s launch is important. The product keeps payroll workflows intact and places stablecoin choice after payroll calculations, where the worker receives part of net pay in a supported digital dollar. In product terms, stablecoins become an employee payout preference rather than a separate finance process.
Stablecoin Payroll to the HR Mainstream
Deel already markets fiat and crypto workforce tools to blockchain companies, including compliant payroll across 130+ countries and EOR service across 150+ countries. Its crypto page says employers can fund payroll through local bank accounts or crypto wallets and let workers receive funds in bank accounts or crypto wallets.
With 40,000+ customers, Deel brings stablecoin payroll to buyers already using a mainstream HR suite. Its advantage is distribution, rather than crypto-native depth. Deel can reach HR, legal, and finance teams inside companies already paying global employees through its software.
Deel also enters a field with real competitors:
- Toku says it processes more than $1 billion in annual token payroll volume across 100+ countries and connects stablecoin payroll to ADP, Workday, UKG, and other payroll systems.
- Rise passed $1 billion in total payroll volume in November 2025, nine months after crossing $500 million. Mercury’s Rise case study says 53%+ of Rise users choose stablecoin payouts.
- Bitwage has a longer operating history. The company says it launched the first beta version of its Bitcoin payroll product in July 2014. Its current site lists more than $400 million in payroll processed, 90,000+ registered workers, and 4,500+ registered companies.
Deel’s launch should be judged within an existing category. Deel expands access through HR distribution. Toku focuses on compliance connectivity with large payroll systems. Rise brings stablecoin-native payroll usage data. Bitwage brings a decade of crypto payroll history.
A Note on Polygon’s Role
Polygon was chosen by Deel for its place in the payroll story. Toku runs stablecoin payroll on Polygon and Visa added Polygon to its stablecoin settlement pilot in April 2026, alongside Arc, Base, Canton, and Tempo.
Payroll platforms and payment companies are choosing networks based on cost, settlement reliability, wallet support, stablecoin liquidity, and partner coverage.
Off-Ramps as the Payroll Test
The strongest part of stablecoin payroll is also its hardest operational requirement. A salary can settle in minutes on-chain, but an employee still needs a usable wallet, a safe way to convert into local currency, and predictable tax treatment.
In countries with weak banking access or high inflation, holding dollars may be valuable. In mature payroll markets such as the US and Eurozone, the value proposition must compete with low-cost bank deposits, employment protections, and familiar payroll expectations.
Payroll teams judge new payout methods through failure scenarios:
- Tax and wage-law treatment decide coverage;
- KYC and sanctions workflows decide access;
- Off-ramp liquidity decides worker value;
- Support response decides trust when a transaction is delayed;
- Fees decide whether a stablecoin payout feels like a cost benefit.
The crypto part moves value, but the payroll part makes the transfer acceptable to employers and usable to workers.
Deel’s Launch Deserves the Spotlight
Stablecoin payroll has left the whitepaper phase. It has measurable payroll volume through Rise and Toku, long-running market history through Bitwage, and new enterprise distribution through Deel. Payment giants such as Visa are testing stablecoin settlement in parallel, which gives the category more institutional reference points.
The strongest argument for stablecoin salaries is speed plus dollar access, especially across borders. However, stablecoin payroll has to match payroll reliability as well as crypto speed. A worker may value instant USDC, but still needs clear net salary records, local spending access, and support if a wallet or off-ramp problem appears.
Deel gives this discussion a mainstream software setting. Its rollout makes stablecoin payroll available through a platform finance and HR teams already know.
Now, the focus turns to adoption by geography, average salary allocation, stablecoin choice, payout failures, off-ramp cost, and employer retention of the feature after the first few payroll cycles.
Until those numbers appear, strong claims about payroll transformation deserve caution. The launch is meaningful because it lets the market test stablecoin salaries inside normal HR operations.
The post Deel Brings Stablecoin Payroll Into Mainstream HR Software appeared first on BeInCrypto.
Crypto World
Sivers Semiconductors (SIVO) Stock Rockets 50% on Defense Contract Amid Insider Trading Scandal
TLDR
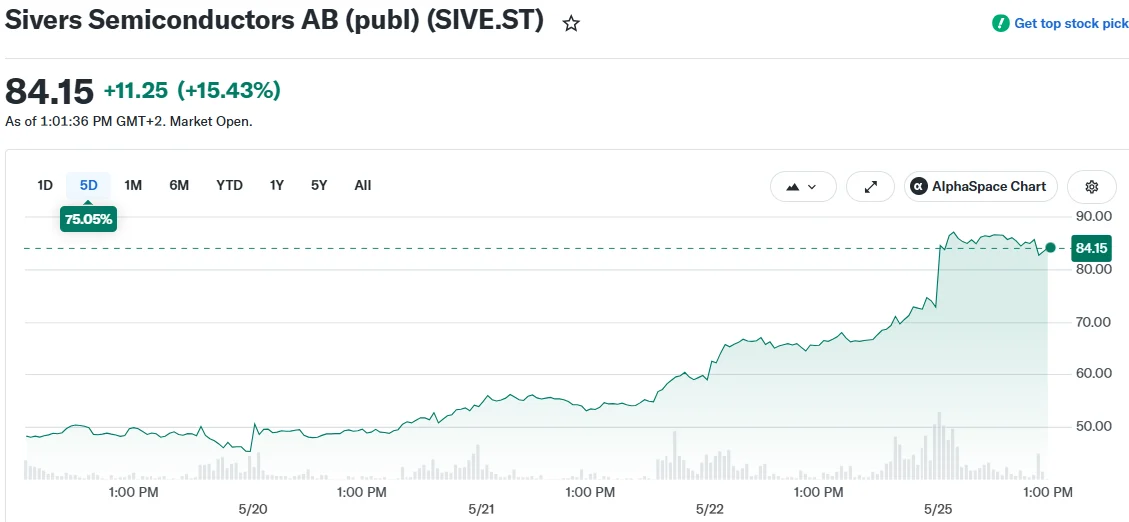
- Sivers Semiconductors jumped approximately 50% in a two-day period after landing a $6.6M Department of Defense contract for year two of the EW STAR initiative under CHIPS Act funding.
- Shares reached 87.70 Swedish kronor during Monday trading, marking a 20.30% daily increase after climbing 23.45% the previous session.
- The firm revised its financial statements for both 2024 and 2025, showing an expanded 2025 net deficit of 222.6 million kronor versus the initially disclosed 186.5 million.
- Swedish authorities are probing potential insider trading related to premature disclosure of the company’s planned Nasdaq dual-listing.
- Current valuation reflects a price-to-sales ratio of 59.69, significantly exceeding the consensus analyst target of 6.55 Swedish kronor per share.
Sivers Semiconductors has delivered one of the most dramatic stock performances in European markets this year. The Swedish manufacturer of photonics and RF semiconductor components rallied approximately 50% over just two trading days — powered by a $6.6 million U.S. military contract and growing investor enthusiasm for AI infrastructure opportunities.
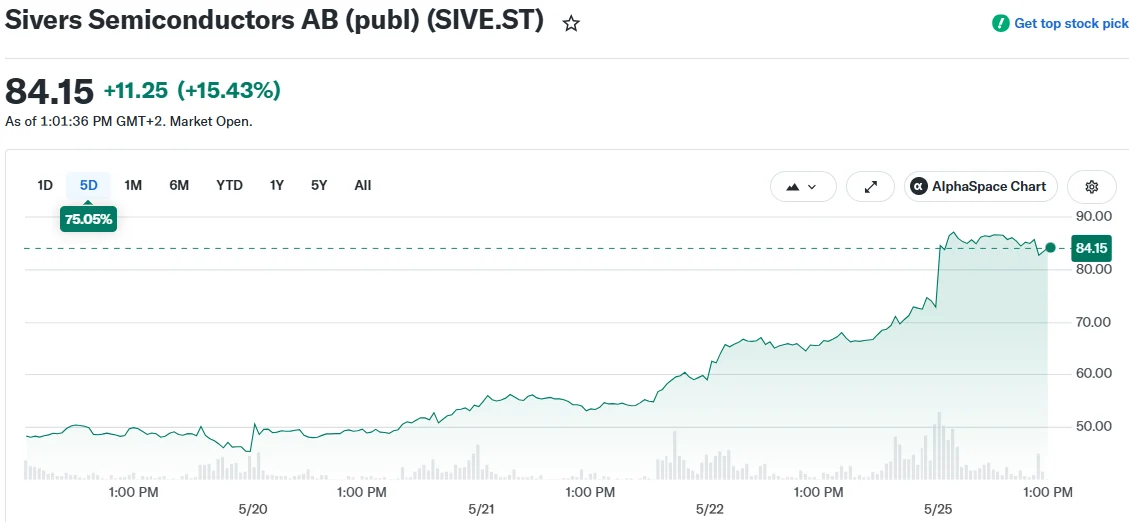
When markets closed on Monday, shares stood at 87.70 Swedish kronor, representing a 20.30% single-day advance. This came immediately after a 23.45% surge from 72.90 kronor in the preceding session. The consecutive gains elevated the company’s market capitalization to approximately 21.54 billion Swedish kronor.
The driving force behind this momentum was the second-year funding approval under the EW STAR initiative, administered through the U.S. Microelectronics Commons program with backing from the CHIPS and Science Act. The Pentagon-supported financing comes via the Northeast Microelectronics Coalition Hub, which encompasses eight states across the northeastern United States. Significantly, these funds are milestone-dependent — Sivers secured payment only after successfully completing year-one technical objectives, lending some legitimacy to the achievement.
EW STAR concentrates on developing broadband antenna array systems designed for simultaneous transmission and reception capabilities in electronic warfare, radar detection, and secure communications. Sivers is simultaneously marketing its beamforming and photonic innovations for satellite connectivity and AI-powered data center infrastructure — two segments where investor demand has been particularly intense recently.
Momentum Accelerates Without Fresh Catalysts
Monday’s 20% spike occurred without any new company disclosures. The preceding days had featured governance announcements — a recommended board restructuring that would introduce two new directors with expertise in capital markets and technology expansion, while removing several founding members and early investors. The incoming nominees, Joakim Nideborn and Helena Svancar, align with the company’s strategic pivot toward American markets and AI-related infrastructure.
The board overhaul also signals mounting pressure from various stakeholders. Achilles Capital, Sivers’ top individual shareholder, maintains connections to DDM Finance, currently undergoing debt restructuring with plans to liquidate €30–50 million in holdings. Whether Sivers shares factor into that disposal remains uncertain. Meanwhile, short positions include Voleon Capital at 1.86% and Two Sigma at 1.78%.
Financial Revisions and Criminal Scrutiny
The company’s financial standing presents challenges. Sivers reissued its accounts for 2024 and 2025 to align with U.S. PCAOB compliance requirements in preparation for a prospective Nasdaq dual-listing. The 2025 revision showed revenue of 306.6 million kronor, while the operating deficit expanded to 177.8 million kronor and the net loss reached 222.6 million kronor — substantially higher than the previously disclosed 186.5 million. The 2024 adjustments proved even more significant, reducing revenue from 243.7 million to 219.2 million kronor and enlarging the net loss from 116.3 million to 183.9 million kronor.
Compounding these concerns, Sweden’s Economic Crime Authority has launched an investigation into suspected insider trading. An unidentified social media profile with substantial reach published specifics about the Nasdaq listing strategy approximately 48 hours ahead of the official statement, triggering abnormal trading activity. Prosecutor Jonas Myrdal is evaluating whether violations of EU Market Abuse Regulation occurred.
Despite these headwinds, the stock commands a price-to-sales multiple of 59.69 and a price-to-book ratio of 20.00. The mean analyst price target remains at only 6.55 Swedish kronor — substantially below current trading levels.
Sivers has postponed its Q1 earnings release until May 29 and scheduled its annual general meeting for June 15, where investors will decide on a management incentive structure covering up to 7 million stock options, equating to roughly 2% equity dilution.
JAN3 CEO Samson Mow has renewed criticism of Ethereum as ETH trades near $2,100 and continues to lag Bitcoin.
Summary
- Samson Mow said he feels sorry for Ethereum as ETH struggles against Bitcoin and market pressure.
- Ethereum trades near $2,115, with weak price action keeping attention on support and institutional losses.
- Vitalik Buterin said the Ethereum Foundation will sell less ETH and focus on long-term survival.
In a post on X, Mow said he dislikes Ethereum as much as other Bitcoin maximalists, but added that he felt sorry for the network’s current state.
The comment came as Ethereum’s market setup remains weak. ETH was trading at $2,100 at press time, down 0.19% on the day, with an intraday range between $2,066.23 and $2,124.48, according to crypto.news data.
Samson Mow targets Ethereum weakness
Mow’s post framed Ethereum’s current position as difficult, even from the view of a long-time Bitcoin supporter. He said, “I can’t help but feel a bit sorry for how bad things are for them now.”
His comment followed months of pressure on Ethereum’s market standing. ETH has struggled to regain stronger momentum, while Bitcoin has drawn more attention from investors seeking relative strength during risk-off periods.
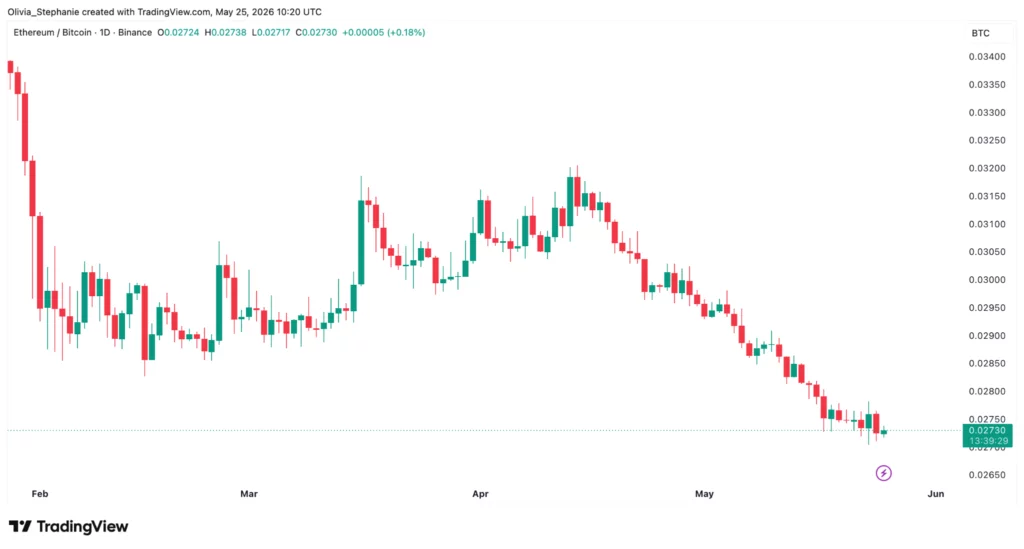
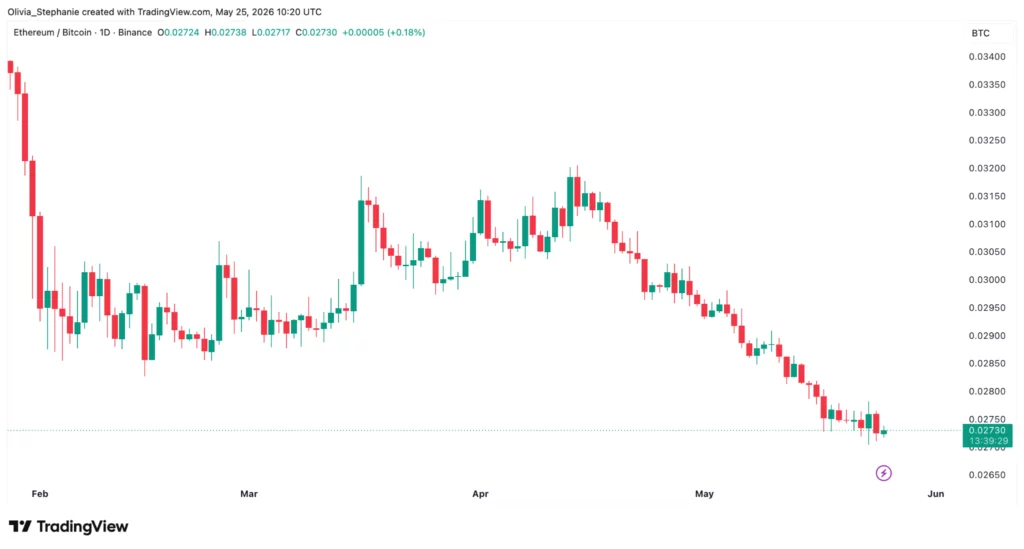
The ETH/BTC ratio has also stayed under pressure. The ratio recently sat near 0.027, showing that Ethereum has continued to weaken against Bitcoin in relative terms.
That weakness has fed a wider debate about whether Ethereum’s scaling path has helped the network or reduced demand for its base layer. Layer-2 networks have made transactions cheaper, but they have also moved user activity away from Ethereum mainnet fees.
Layer-2 growth raises base-layer questions
Ethereum’s rollup strategy helped the network handle more transactions through Layer-2 platforms such as Arbitrum, Optimism, and Base. That approach lowered user costs and improved access.
However, critics argue that the same model can reduce direct fee demand for Ethereum’s base layer. When activity moves to separate rollups, value can become spread across many networks instead of staying concentrated on mainnet.
Concerns also remain around centralized sequencers and large staking pools. These issues have kept the decentralization debate active, even as Ethereum developers continue to push technical upgrades.
Mow’s criticism fits that wider debate. His post did not present a detailed technical review, but it added attention to Ethereum’s current mix of weak price action, reduced relative strength, and structural questions.
BitMine and ETH treasury losses add pressure
Related market updates show that Ethereum treasury holders have also faced pressure. Crypto.news reported that BitMine’s ETH holdings crossed 5,078,386 ETH on April 27, after the firm bought the tokens at an average price of $2,369 each. At that time, the position was worth about $12 billion.
The same report said BitMine had carried an estimated $3.5 billion in unrealized losses in February 2026, while still buying ETH during the drawdown.
Other public ETH treasury strategies have also faced weak accounting results. Crypto.news reported that SharpLink posted a $685.6 million net loss in Q1, driven mainly by non-cash ETH market losses and impairment charges.
SharpLink reported $506.7 million in unrealized ETH losses and a $191.7 million LsETH impairment charge. The company said those accounting losses did not reduce its ETH holdings.
Vitalik Buterin backs smaller Ethereum Foundation
Mow’s comment also came soon after Vitalik Buterin described a new direction for the Ethereum Foundation. Buterin said the foundation will use its remaining resources to focus on long-term survival instead of expanding its activities.
Crypto.news reported that Buterin said the Ethereum Foundation will sell less ETH going forward. He also said the foundation holds about 0.16% of all ETH and should act as one node in Ethereum, not the center of the network.
Buterin’s plan focuses on censorship resistance, privacy, openness, and security. He also said Ethereum must become more impressive in areas such as safer code, stronger consensus, and fewer transaction intermediaries.

financial position of groom !

Salford City vs Notts County LIVE League Two play-off final as fans descend on Wembley Stadium

Civic Centre in Newport part of new review of council’s properties


-

 Crypto World4 days ago
Blockchain.com files with SEC for U.S. IPO
-

 Fashion3 days ago
Holiday Weekend Open Thread – Corporette.com
-
 Crypto World3 days ago
Bitcoin Accumulation Weakens as BTC Realized Losses Hit $600M
-

 Business3 days ago
Dell Technologies DELL Stock Surges 15% on AI Server Momentum and Analyst Upgrades in 2026
-
 Crypto World3 days ago
Space X IPO Is ‘Bad News’ for Tech Stocks: But What About Bitcoin?
-

 Politics3 days ago
Makerfield: a tale of two social-media histories
-

 Crypto World2 days ago
Robinhood crypto COO Tanya Denisova exits
-
 Crypto World3 days ago
MicroStrategy’s Saylor Says Miners No Longer Set Bitcoin Price, Another Force Has Taken Over
-

 Business18 hours ago
NYT Strands Answers May 24 2026 Revealed for Puzzle No. 812 Theme Summer Essentials
-
 Tech3 days ago
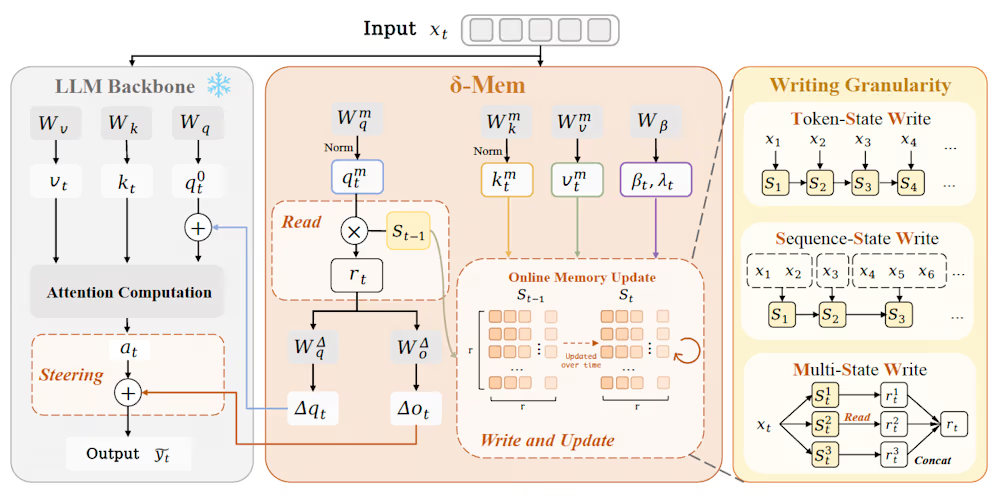
A 0.12% parameter add-on gives AI agents the working memory RAG can’t
-

 Crypto World3 days ago
AI infrastructure race heats up as IREN pitches full-stack strategy, WhiteFiber lands $160M deal
-

 Tech4 days ago
WhatsApp ads could make Irish debut after discussions with DPC
-

 Tech3 days ago
You Can Now Add ChatGPT To PowerPoint
-

 Business3 days ago
Trump Invests $1M-$5M in Kura Sushi USA Chain With 27 California Locations
-
 Crypto World7 days ago
Revolut Launches Dogecoin Debit Card Across UK and EU
-
 NewsBeat4 days ago
Charity run by Reform leader Malcolm Offord accused of ‘law breaking’ over Scottish registration
-

 Sports3 days ago
2026 CJ Cup Byron Nelson leaderboard: Brooks Koepka finds putting stroke in Round 1
-
Business3 days ago
Goldman Sachs reinstates Ageas stock coverage with neutral rating
-

 Crypto World5 days ago
Exa Labs raises $250 million in funding led by a16z
-

 Crypto World3 days ago
Trump Media’s Bitcoin Stash Shrinks Again as 2,650 BTC Lands on Crypto.com
You must be logged in to post a comment Login