

Crypto World
Was MicroStrategy and Saylor Right to Sell Some Bitcoin? The Maximalism Debate

Strategy (formerly MicroStrategy), the largest corporate Bitcoin holder, sold 32 BTC for roughly $2,5 million between May 26 and 31, marking its first crypto sale since 2022. Although the BTC sold represents only 0.004% of the company’s entire treasury, the move is symbolic for Bitcoin maximalists and detractors alike.
We break down what happened, the voices defending the move, and the analysts who see a real warning sign.
What the MicroStrategy Bitcoin Sale Actually Means
Strategy disclosed its transaction in a Form 8-K filing, noting that the proceeds were used to fund preferred stock distributions. The numbers put the move in perspective.
Despite the sale, Strategy still holds 843,706 BTC valued at more than 60 billion dollars, with an average acquisition cost of 75,699 dollars per coin.
The 32 BTC sale represents less than 0.004% of the entire treasury. Yet the symbolic weight runs heavy, since Michael Saylor built the company’s brand on aggressive, relentless Bitcoin accumulation and a public never-sell stance.
Follow us on X to get the latest news as it happens
The transaction introduces nuance to that narrative for the first time in years. It tests whether the market views Strategy as a pure Bitcoin proxy or as a publicly traded company balancing many real financial obligations.
That question sharply divides the crypto community. The same small sale appears to some analysts as strategic mastery and to others as the first visible crack in an ironclad corporate maximalist position.
Why Some Experts See the Sale as Bullish
Several prominent analysts dismissed the move as either irrelevant or quietly positive for both Bitcoin and Strategy stock heading into the next phase of the cycle.
Zynx downplayed the news, pushing back against early FUD and saying he remains bullish on MSTR despite the wave of misinformation that followed the disclosure.
“I can already see the misinformation and FUD about how Saylor was ‘forced to sell’. Bullish on $MSTR,” Zynx noted.
Michaël van de Poppe framed the sale as the resolution of an uncertainty hanging over the market. He argued the FUD surrounding any Saylor Bitcoin sale is now over, which he considers structurally bullish.
At the same time, Against Wall Street offered the deepest strategic read. Citing Saylor’s earlier comments, the analyst called the 32 BTC sale symbolic, designed to satisfy credit rating agencies and ultimately unlock far larger Bitcoin repurchases later.
“If this was about booking profits, they could’ve dumped way more, they’re already deep in the green This wasn’t profit-taking. It was symbolic. A calculated move to keep the rating agencies happy while staying all-in on Bitcoin. Chess, not checkers,” Against Wall Street said.
His phrasing summed up the bullish camp: “Chess, not checkers.” For this group, Strategy is playing a long game where small tactical sales actually protect the broader accumulation engine.
Telcier asked the market to keep perspective, calling 0.0037% of the position effectively nothing. Meanwhile, ImCryptOpus framed any resulting dip as a smart accumulation opportunity for retail and institutional buyers alike.
Jack echoed the long-term bullish view. He noted that selective selling to fund dividends could strengthen confidence in Strategy’s related financial instruments and ultimately support greater net Bitcoin accumulation across cycles.
Together, these voices argue the sale aligns with previously communicated treasury strategies. In their view, it shows financial sophistication rather than any loss of conviction in Bitcoin as a long-term store of value.
Why Other Analysts See a Warning Signal
The bearish camp focused less on the size of the sale and more on what it signals about Strategy’s evolving discipline. For these analysts, like anti-Bitcoin and “Gold Bug” Peter Schiff, the precedent matters far more than the dollar amount.
“Last week $MSTR sold 32 Bitcoin for about $2.5 million at an average price of $77,135. Since Bitcoin’s biggest buyer has now become a seller, where will the new demand come from to sustain the pyramid? Bitcoin is already below $72K, which is about 7% below where @Saylor sold”, Schiff said.
0xNobler reacted bluntly, warning that the company has started liquidating Bitcoin and that the move “is not looking good for crypto.” His framing reflected the raw concern many maximalists felt during the announcement.
Meanwhile, DeFiTracer struck a similar tone, calling Strategy’s first historical sale extremely bad for markets. The argument centers on sentiment risk rather than on the actual selling pressure produced by the transaction itself.
Crypto McKenna had flagged the risk earlier. He noted that Strategy has shifted from never selling Bitcoin to selling some BTC to ensure dividend obligations are always met going forward across capital cycles.
“MSTR moved away from never selling Bitcoin to selling some Bitcoin to ensure dividend obligations are always met for STRC. Saylor basically has on a low leverage perp position on BTC and is paying funding to keep it open. STRC only becomes a ponzi if capital raised for STRC issuance is directed back to covering it’s obligations so MSTR may end up selling >1Bn of BTC to ensure they have an adequate cash balance to cover dividends”, Crypto McKenna exposed.
His key concern is perception. Market interpretation of this evolution could become much worse than the literal impact, especially if preferred stock obligations require additional sales over the coming quarters.
Tradinglord also voiced bearish concerns about the precedent. Once a public company introduces sales to meet financial commitments, the door opens to potentially larger disposals if conditions ever deteriorate.
Critics argue that even a negligible sale chips away at the diamond hands ethos that fueled Strategy’s brand and inspired thousands of retail investors throughout previous cycles. That cultural shift carries real weight.
The contrast reflects a deeper tension. Bullish analysts treat Bitcoin as an actively managed treasury asset. Bearish voices see it as an absolute store of value that must never be touched, regardless of dividend obligations.
With 843,706 BTC still on the balance sheet, Strategy’s Bitcoin position remains overwhelmingly intact. Yet how the company manages future obligations will likely shape how the market perceives every corporate Bitcoin strategy from here.
The post Was MicroStrategy and Saylor Right to Sell Some Bitcoin? The Maximalism Debate appeared first on BeInCrypto.

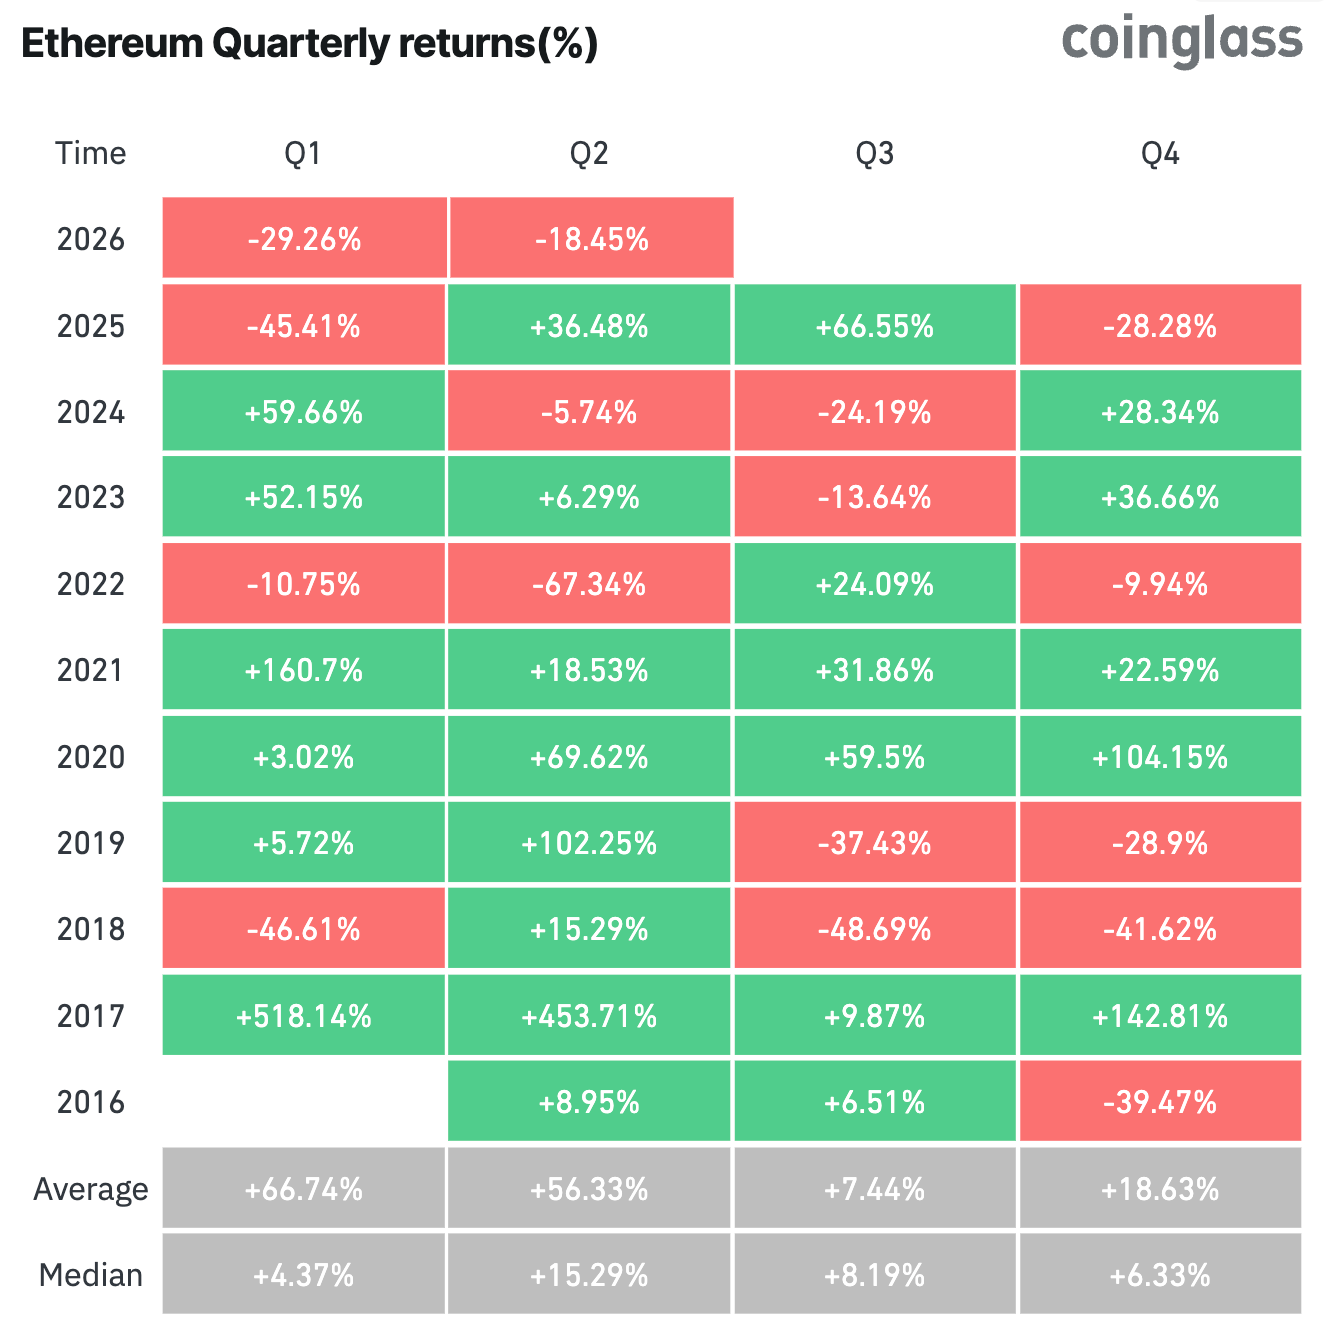
Ethereum (ETH) is on course to do something it has never done before. It is heading toward three consecutive red quarters for the first time in its history.
With about two weeks left before the quarter closes, ETH still has time to break the pattern. A macro lift and rising staking have kept hopes of a reversal alive.
Why a Third Red Quarter Would Be Historic For Ethereum
ETH has never closed three consecutive quarters in the red, Coinglass data shows. The second-largest cryptocurrency fell 28.28% in Q4 2025 and 29.26% in Q1 2026. It is down 18.4% this quarter.
Follow us on X to get the latest news as it happens

The price slump has pushed ETH near multi-year lows and sentiment into deep fear.
“Ethereum is on track for its 2nd worst first half of the year after 2022,” an analyst noted.
The Bullish Case For Ethereum
With two weeks left in the quarter, Ethereum still has time to avoid a pattern it has never experienced before. For now, momentum appears to be turning in its favor.
Broader risk markets have strengthened following reports of a US-Iran peace agreement. The news lifted the total cryptocurrency market capitalization by 2% over the past 24 hours. Ethereum has outperformed slightly, gaining 2.6% over the same period to trade above $1,700.

At the same time, historical trends offer additional support for the bullish case. ETH has recorded a positive quarter immediately after every previous instance of back-to-back quarterly losses.
In 2022, for example, Ethereum declined for two consecutive quarters before rebounding 24% in the following quarter. Similar, though more modest, recoveries followed consecutive red quarters in 2019 and 2020.
However, there is a caveat. Any recovery would likely need to extend into Q3, which has historically been Ethereum’s weakest quarter, delivering an average return of just 7.44%. While history suggests ETH tends to bounce back after prolonged weakness, seasonal trends indicate the path higher may not be straightforward.
Staking and Technical Signals Lean Bullish
Besides seasonal trends, technical indicators are also signaling a potential Ethereum bottom. Analyst Ardi said several metrics are aligning with previous cycle lows, including ETH’s recent touch of a blue lower acceptance cloud and RSI trends.
However, he cautioned that “worst isn’t over yet,” when it comes to the price. Weekly RSI has yet to spend multiple weeks below 30 as seen in prior cycles, while the ETH/BTC pair remains in a strong downtrend.
“ETH has more downside incoming as long as its pair bleeds. But last cycle, ETH bottomed 6 months before BTC… Timing the bottom is improbable. But we’re in the second half of the bear market year,” the analyst remarked.
At the same time, on-chain data points to resilient demand. More than 39.5 million ETH is now staked across more than 887,000 validators, reflecting strong long-term conviction among holders.
This trend does not align with a strongly bearish outlook. Instead, the continued growth in staked ETH suggests investors are choosing to lock up their holdings rather than sell, helping limit potential on-chain selling pressure.
Subscribe to our YouTube channel to watch leaders and journalists provide expert insights
The post Ethereum Nears First-Ever 3 Straight Red Quarters as Bullish Signs Emerge appeared first on BeInCrypto.
Aztec Connect, a deprecated DeFi platform tied to Aztec Network, was reportedly drained of about $2.1 million in crypto after an attacker exploited a vulnerability in the platform’s transaction verification logic. The incident highlights how “abandoned” contracts can remain viable targets long after they are officially retired.
Aztec Labs said on X that it is investigating a potential exploit affecting Aztec Connect and that roughly $2.1 million was transferred from the platform’s smart contract. The company added that the issue did not impact users or assets on the current Aztec Network.
Key takeaways
- About $2.1 million was stolen from Aztec Connect after the attacker abused its verification and settlement path.
- BlockSec said verified transactions were not effectively bound to the transaction set enforced by the ZK proof, creating a pathway to withdraw unbacked balances.
- The attacker reportedly executed the exploit seven times across seven assets, accumulating 909 ETH and 270,000 DAI, among others.
- Aztec Connect was deprecated in March 2023, with deposits halted and the team shifting to Aztec Network.
- Aztec Labs stated it has no admin keys and cannot pause or upgrade Aztec Connect, while a developer said the contracts became fully immutable.
What Aztec Labs said happened
In its public update, Aztec Labs described an apparent exploit affecting Aztec Connect’s smart contract and noted that about $2.1 million was transferred out. The firm emphasized that the incident did not affect the assets or user balances on the live Aztec Network.
Aztec Connect is linked to the privacy-focused ZK rollup ecosystem built on Ethereum. According to the same context provided in the report, Aztec Connect was an earlier version of the platform launched in 2022 as a DeFi bridge.
How the verification weakness enabled withdrawals
Security firm BlockSec said the attacker took advantage of a mismatch in how Aztec Connect verified transactions versus how it settled them on Ethereum.
BlockSec’s explanation focused on how the system handled the relationship between verified transactions and the ZK proof’s enforced transaction set. In its view, transactions approved through Aztec Connect’s verification route were not effectively bound to the transaction set enforced by the ZK proof. That gap allowed the contract’s verification and settlement logic on Ethereum to interpret the transaction list differently.
With that inconsistency, the attacker could place transactions such that the contract credited value without the corresponding validation occurring on Ethereum. BlockSec said this enabled the creation of unbacked balances, which could then be withdrawn.
BlockSec also reported that the attacker repeated the technique multiple times—seven times across seven different assets—rather than relying on a single sweep.
Reported assets taken and the broader hacking backdrop
The theft reportedly included 909 Ether (ETH), 270,000 Dai (DAI), 167 wrapped staked ETH, and several other cryptocurrencies. A separate post from CertiK had been cited in the original reporting as showing examples of some of the assets taken.
The Aztec Connect incident comes amid a busy stretch for DeFi exploits. DeFiLlama data referenced in the reporting indicates that $44 million worth of crypto has been stolen so far this month from at least 12 separate exploits.
Earlier in June, the largest theft mentioned was tied to a private key compromise on the Humanity Protocol, with $30 million reportedly lost on June 8. The reporting also points to a separate Syscoin Bridge incident the day prior, where $8 million was allegedly stolen through a fake proof exploit.
Why the “deprecated” label didn’t stop the attack
Aztec Connect was officially deprecated in March 2023, when deposits were halted and the team redirected development resources to the next-generation Aztec Network. However, the deprecation process did not eliminate the risk posed by the underlying smart contract logic.
Aztec Labs stated it holds no admin keys and therefore cannot pause or upgrade the system. This means the platform’s inability to be adjusted by the team can leave known or emergent logic flaws unaddressed—especially if the contract’s code remains on Ethereum.
A crypto developer identified as “Param” also said the Aztec Connect smart contracts became fully immutable, meaning they could no longer be upgraded or paused.
That combination—deprecation without upgrade authority—helps explain how an exploit can surface well after a product is retired. As noted in the reporting, the incident is another reminder that abandoned or deprecated DeFi contracts can still attract attackers years later, particularly when the exploit depends on fundamental contract semantics rather than on temporary operational parameters.
What to watch next
Investigators will likely focus on whether the withdrawn funds were immediately moved through liquidity venues or remain trackable in on-chain flows, while the Aztec ecosystem’s response may center on confirming the scope of impact and strengthening boundaries between verification and settlement logic. For users, the practical takeaway is to treat deprecated contracts as still risky: immutable code can remain exploitable long after deposits are shut off.
Key Takeaways
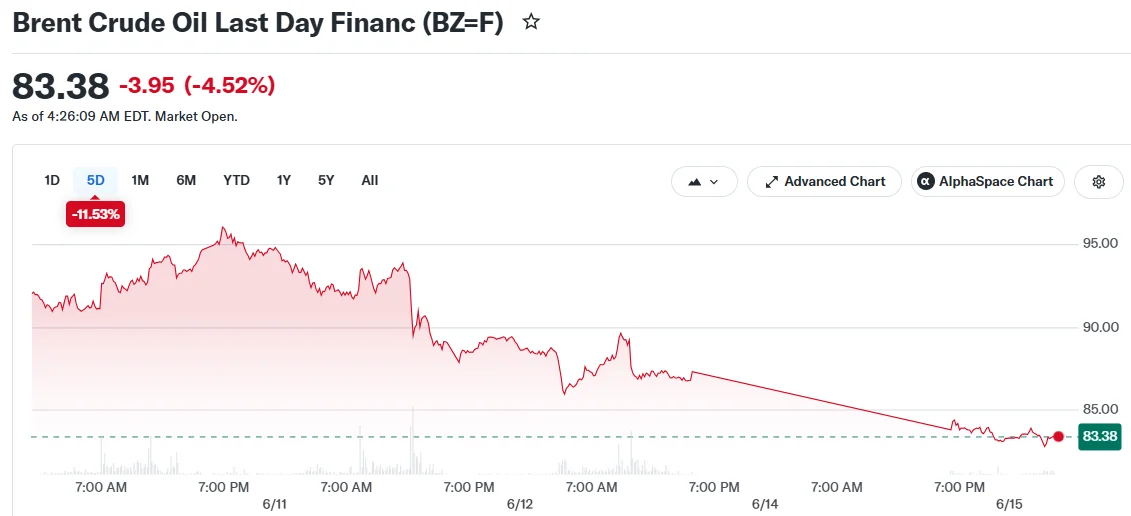
- Brent crude tumbled more than 4% to trade under $84 per barrel following news of a US-Iran interim agreement
- The framework includes reopening the Strait of Hormuz, a critical waterway handling approximately 20% of worldwide oil shipments
- President Trump announced the “toll free opening” of Hormuz alongside the lifting of America’s naval blockade
- Officials plan to sign the formal agreement in Switzerland this Friday, followed by a 60-day ceasefire window
- Market experts caution that challenges persist, including potential mines in the passage and ambiguity surrounding implementation details
Global oil markets experienced a significant downturn Monday following confirmation that Washington and Tehran have negotiated an interim framework to conclude their extended confrontation and restore access through the Strait of Hormuz.

Brent crude declined more than 4% to approximately $83.79 per barrel. West Texas Intermediate slumped 4.6% to hover near $81. Both primary benchmarks reached their lowest points since March 10.
President Donald Trump unveiled the arrangement via social media platforms, declaring his authorization for the “toll free opening” of the Strait of Hormuz while simultaneously lifting the US naval blockade. “Ships of the World, start your engines. Let the oil flow!” his post proclaimed.
Iran’s Deputy Foreign Minister Kazem Gharibabadi verified that negotiators had finalized a deal. He indicated the complete text would remain confidential until the formal signing ceremony in Switzerland, scheduled for Friday.
The conflict erupted in late February following coordinated US and Israeli military operations against Iran concerning its nuclear development program. Tehran retaliated by blocking the Strait of Hormuz and executing attacks throughout the Persian Gulf region. Washington countered with its own naval blockade targeting Iranian-affiliated vessels.
During the height of tensions, Brent crude surged beyond $120 per barrel. Maritime disruptions, elevated insurance premiums, and concerns about extended supply constraints combined to drive prices upward.
Pre-Deal Price Decline Already Underway
Prices had been retreating over recent weeks as indicators mounted that negotiators were approaching an agreement. Reports suggested limited crude shipments through the strait had quietly resumed, while major industrialized nations accessed strategic petroleum reserves to alleviate supply pressures.
China, ranking among the globe’s largest oil consuming nations, simultaneously reduced its purchasing activity throughout the crisis period.
Framework Agreement Components
The preliminary accord establishes provisions for ceasing military operations and restoring Hormuz access within 30 days under Iranian management. Reports indicate the framework additionally encompasses sanctions relief, constraints on Iran’s nuclear activities, and measures to restore normal Iranian oil export operations.
The arrangement establishes a 60-day negotiating period focused on Iran’s nuclear program. Trump revealed to the New York Times that failure to secure an agreement on nuclear matters could prompt renewed military intervention.
Despite encouraging developments, market analysts recommended measured expectations. The waterway potentially contains uncleared mines requiring removal operations. Insurance companies may maintain elevated premium rates for vessels transiting the route.
“We still need to understand what the deal means,” said Chris Weston of Pepperstone Group. “Even with the strait slated to open on Friday, there could be mines still.”
Energy producers cautioned that reactivating oil production from idled Persian Gulf facilities could require several months due to infrastructure damage and operational complexities.
Reduced crude prices may diminish inflationary pressures confronting central banking institutions. The US Federal Reserve convenes for its policy meeting on June 16-17 and is anticipated to maintain current interest rates.


TLDR
- Aerodrome, Base network’s leading decentralized exchange, introduces Predictive Allocation this July
- The new framework shifts from traditional weekly governance voting to forward-looking incentive distribution
- Users who successfully predict high-activity pools will capture increased fee revenue shares
- The mechanism incorporates prediction market principles where forecasting and capital allocation merge
- The platform targets sophisticated traders and autonomous AI agents with this infrastructure upgrade
Aerodrome is preparing to deploy its most significant protocol enhancement since its 2023 debut on Coinbase’s Base blockchain. The decentralized trading platform will introduce Predictive Allocation this July, fundamentally restructuring how liquidity rewards flow to its various trading pools.
As the dominant decentralized exchange operating on Base, Aerodrome currently employs a governance structure where token holders allocate rewards based on historical fee performance across pools.
Shifting from Historical Data to Future Forecasting
Alex Cutler, founder of Dromos Labs—the development team powering Aerodrome—identifies a fundamental limitation in the existing framework. The system relies on backward-looking metrics rather than forward-thinking analysis.
Predictive Allocation fundamentally restructures this approach. Participants will allocate incentives to pools they anticipate will generate significant trading activity in the future, rather than rewarding pools based solely on past performance.
Accurate forecasters will capture enhanced fee revenue portions. Incorrect predictions yield diminished returns.
“The liquidity is now moving in an anticipatory way ahead of where the market is,” Cutler said.
The framework takes inspiration from prediction market mechanics, where economic incentives drive participants toward accurate forecasting. However, a crucial distinction exists.
In conventional prediction markets, participants wager on outcomes beyond their control. Within Predictive Allocation, channeling resources toward a specific pool simultaneously creates the liquidity infrastructure that drives that pool’s success. Forecasting and investing become indistinguishable actions.
Appealing to Sophisticated Market Participants
Dromos Labs engineered this system specifically for professional trading operations and artificial intelligence-powered market participants.
These entities require streamlined, information-dense trading environments. The upgraded framework provides algorithmic transparency and systematic incentive structures that Cutler expects will attract this demographic.
“This is optimized for an increasingly agentic commerce layer,” Cutler said.
By minimizing the temporal gap between demand fluctuations and liquidity positioning, the protocol seeks to reduce price slippage while enhancing execution quality for retail participants.
Aerodrome confronts growing competition from alternative DEXs and routing aggregators on Base, a network experiencing rapid expansion since launching its mainnet. This upgrade represents a strategic effort to solidify and expand the platform’s dominant position.
Dromos Labs frames the overarching innovation as a “production market”—a capital allocation mechanism for navigating uncertainty and compensating accurate market analysis.
Cutler articulates ambitions extending beyond the July deployment. He envisions Aerodrome achieving for spot market trading what Hyperliquid accomplished in perpetual futures markets.
“We want to do that for spot markets,” he said.
The Predictive Allocation framework goes live in July. Whether it succeeds will hinge on participants’ forecasting accuracy and the ecosystem’s adaptation speed to these restructured incentive mechanics.
Key Takeaways
- Nicolas Consigny from the Ethereum Foundation unveils a quantum protection method costing merely $0.07 per account
- SPHINCS-, derived from NIST’s post-quantum cryptography standard, can be implemented without requiring a hard fork
- March 2026 Google research revealed quantum computers need significantly fewer qubits than anticipated to compromise Ethereum’s security
- Major institutions including BlackRock and Moody’s issued quantum security warnings for cryptocurrency in early June 2026
- Approximately 10% of Bitcoin’s total circulation remains structurally vulnerable to potential quantum attacks
A groundbreaking proposal from Ethereum Foundation researcher Nicolas Consigny suggests cryptocurrency users can safeguard their accounts against quantum computing dangers for a mere $0.07 per wallet.
On June 14, 2026, Consigny unveiled this innovative approach, presenting SPHINCS-, a customized version of SPHINCS+, the post-quantum cryptographic signature standard created by the US National Institute of Standards and Technology.
The breakthrough lies in its accessibility: individual users can implement this safeguard independently, eliminating the need to wait for comprehensive network upgrades through hard forks.
As an interim measure, SPHINCS- minimizes the computational costs associated with validating quantum-resistant signatures directly on the blockchain, serving as a stopgap until Ethereum’s permanent solution, leanSPHINCS, becomes operational.
Presently, Ethereum’s security infrastructure depends on the Elliptic Curve Digital Signature Algorithm (ECDSA). Sufficiently advanced quantum computers possess the theoretical capability to decrypt this encryption method, potentially compromising both user wallets and transaction integrity.
Mounting Pressure for Immediate Action
Google’s research team delivered a sobering assessment in March 2026: as few as 500,000 physical qubits might suffice to breach Ethereum’s cryptographic defenses. This figure represents a dramatic reduction from previous estimates that suggested millions of qubits would be necessary.
The same Google study identified five distinct quantum attack pathways targeting Ethereum’s infrastructure, collectively threatening over $100 billion in digital assets.
While Ethereum’s development community has outlined plans for a Post-Quantum Public Key Registry with phased implementations scheduled between 2026 and 2029, these modifications demand extensive coordination across the network and remain years from completion.
Consigny’s innovation provides an actionable alternative for users unwilling to wait for network-wide protocol changes.
Financial Giants Sound the Alarm
BlackRock issued a stark warning on June 9, emphasizing that both Ethereum and Bitcoin must accelerate their quantum resistance strategies. Just one day prior, Moody’s highlighted financial vulnerabilities stemming from delayed post-quantum cryptography adoption, noting that competition for resources with artificial intelligence development could impede progress.
Bitcoin confronts comparable security challenges. According to Glassnode’s analysis, approximately 1.92 million Bitcoin—representing nearly 10% of the cryptocurrency’s total supply—remains structurally defenseless against quantum computing attacks. An additional 20.6% faces operational vulnerability due to suboptimal key management protocols.
This leaves roughly 69.8% of Bitcoin’s circulation in a relatively secure state, a figure that aligns closely with Ark Invest’s March 2026 assessment.
In April 2026, quantum computing startup Project Eleven recognized researcher Giancarlo Lelli for successfully compromising a 15-bit elliptic-curve cryptographic key using quantum technology. While Bitcoin employs 256-bit keys, making complete compromise still far off, the trajectory is unmistakable.
As of June 14, 2026, Ethereum was valued at $1,665.49, maintaining a market capitalization near $200.6 billion. Despite the absence of dramatic market reactions, pressure from prominent financial institutions continues mounting.
Ethereum’s core development team has established 2029 as the target for complete quantum-resistant infrastructure. Meanwhile, affordable interim solutions such as SPHINCS- may represent users’ most viable immediate protection strategy.
Key Takeaways
- July 1, 2026 marks the final day of the EU’s MiCA regulation transition period for cryptocurrency businesses
- Just 194 crypto companies out of more than 3,000 have obtained proper licensing through May 2026
- Industry analysts predict approximately 75% of existing crypto service providers will forfeit their operational status
- French authorities have threatened violators with imprisonment up to two years plus €30,000 penalties
- Customers using unauthorized platforms must transfer their holdings or risk losing access
July 1, 2026 represents the final cutoff for the European Union’s Markets in Crypto-Assets (MiCA) regulatory framework. Beyond this date, cryptocurrency platforms lacking proper authorization cannot legally operate within EU borders.
The magnitude of this transition cannot be understated. Throughout 2024, more than 3,000 cryptocurrency businesses maintained registration throughout Europe. However, by May 2026, a mere 194 companies had successfully obtained MiCA authorization. Legal experts at Hogan Lovells project that roughly three-quarters of previously registered providers will forfeit their operational privileges once the cutoff arrives.
The European Securities and Markets Authority has issued unambiguous guidance. Any organization delivering crypto-related services to European Union residents without proper licensing beyond July 1 will violate EU regulations and must cease all such activities.
Consequences for Non-Compliant Platforms
Companies failing to meet the compliance deadline face immediate restrictions on accepting new customer deposits. These firms must facilitate customer asset withdrawals, enable fund transfers, or assist migration to authorized platforms or personal custody solutions.
ESMA has mandated that unlicensed operators establish comprehensive “orderly wind-down plans.” Certain national watchdogs have adopted even stricter positions.
The French financial authority, AMF, has delivered among the most severe warnings. Organizations continuing to serve French residents without MiCA authorization after July 1 risk two-year jail terms alongside €30,000 monetary penalties. The AMF maintains authority to publish warning lists, issue public alerts, and pursue judicial website blocking orders.
AMF chair Marie-Anne Barbat-Layani emphasized to media outlets that completing applications was “very, very urgent” for affected firms.
Impact on Cryptocurrency Holders
The consequences vary significantly among different user groups. Those holding accounts with already-authorized platforms should experience minimal operational changes.
However, customers of unauthorized services confront a markedly different scenario. These users may receive communications instructing them to extract funds, liquidate holdings, or migrate accounts to compliant entities ahead of the deadline.
Research conducted by OKX Europe revealed that 60% of European cryptocurrency holders continue utilizing exchanges lacking MiCA compliance. The same research discovered that 7.6 million downloads among 18.5 million total exchange application installations across Europe between May 2025 and May 2026 involved platforms without valid authorization.
MiCA’s passporting framework permits companies licensed within any single EU member state to conduct business throughout all 27 nations. Nevertheless, approval timelines differ substantially by jurisdiction. Poland delayed a MiCA-compatible legislative measure despite the approaching EU deadline, whereas Italy established an earlier domestic compliance date for registered entities.
The stablecoin market has already demonstrated how rapidly conditions can shift. Tether’s USDT token was delisted from multiple European trading venues due to MiCA non-compliance. Meanwhile, Circle’s USDC and EURC tokens, which satisfy regulatory requirements, remained available.
Cryptocurrency holders are strongly encouraged to verify their platform’s status through the ESMA Interim MiCA Register, carefully review communications from their service providers, and relocate assets before access termination occurs.


ARK Invest bought nearly 3.3 million shares of SpaceX (SPCX) as Elon Musk’s company went public in the largest IPO ever on Friday, building a stake worth more than $500 million by the end of the day.
The shares, priced at $135 for the sale, closed at $160.95, rising more than 19.2% on their first day.
The Cathie Wood-owned firm liquidated almost $280 million of stock in the week before the listing, then sold another roughly 948,000 shares across 13 companies worth at least $48 million on Friday, including Advanced Micro Devices, Roku and Baidu, according to daily emailed statements over the period.
The ARK Innovation ETF (ARKK) did the bulk of the buying, ending the day with SpaceX at 3.28% of its portfolio.
A first-day pop of almost 20% on the largest IPO in history signals institutions are paying up for high-beta innovation risk again. While bitcoin is the highest-beta asset in the group, the hottest trade in the market is now a wave of AI and space listings, with OpenAI and Anthropic also filing to go public.
Key Highlights
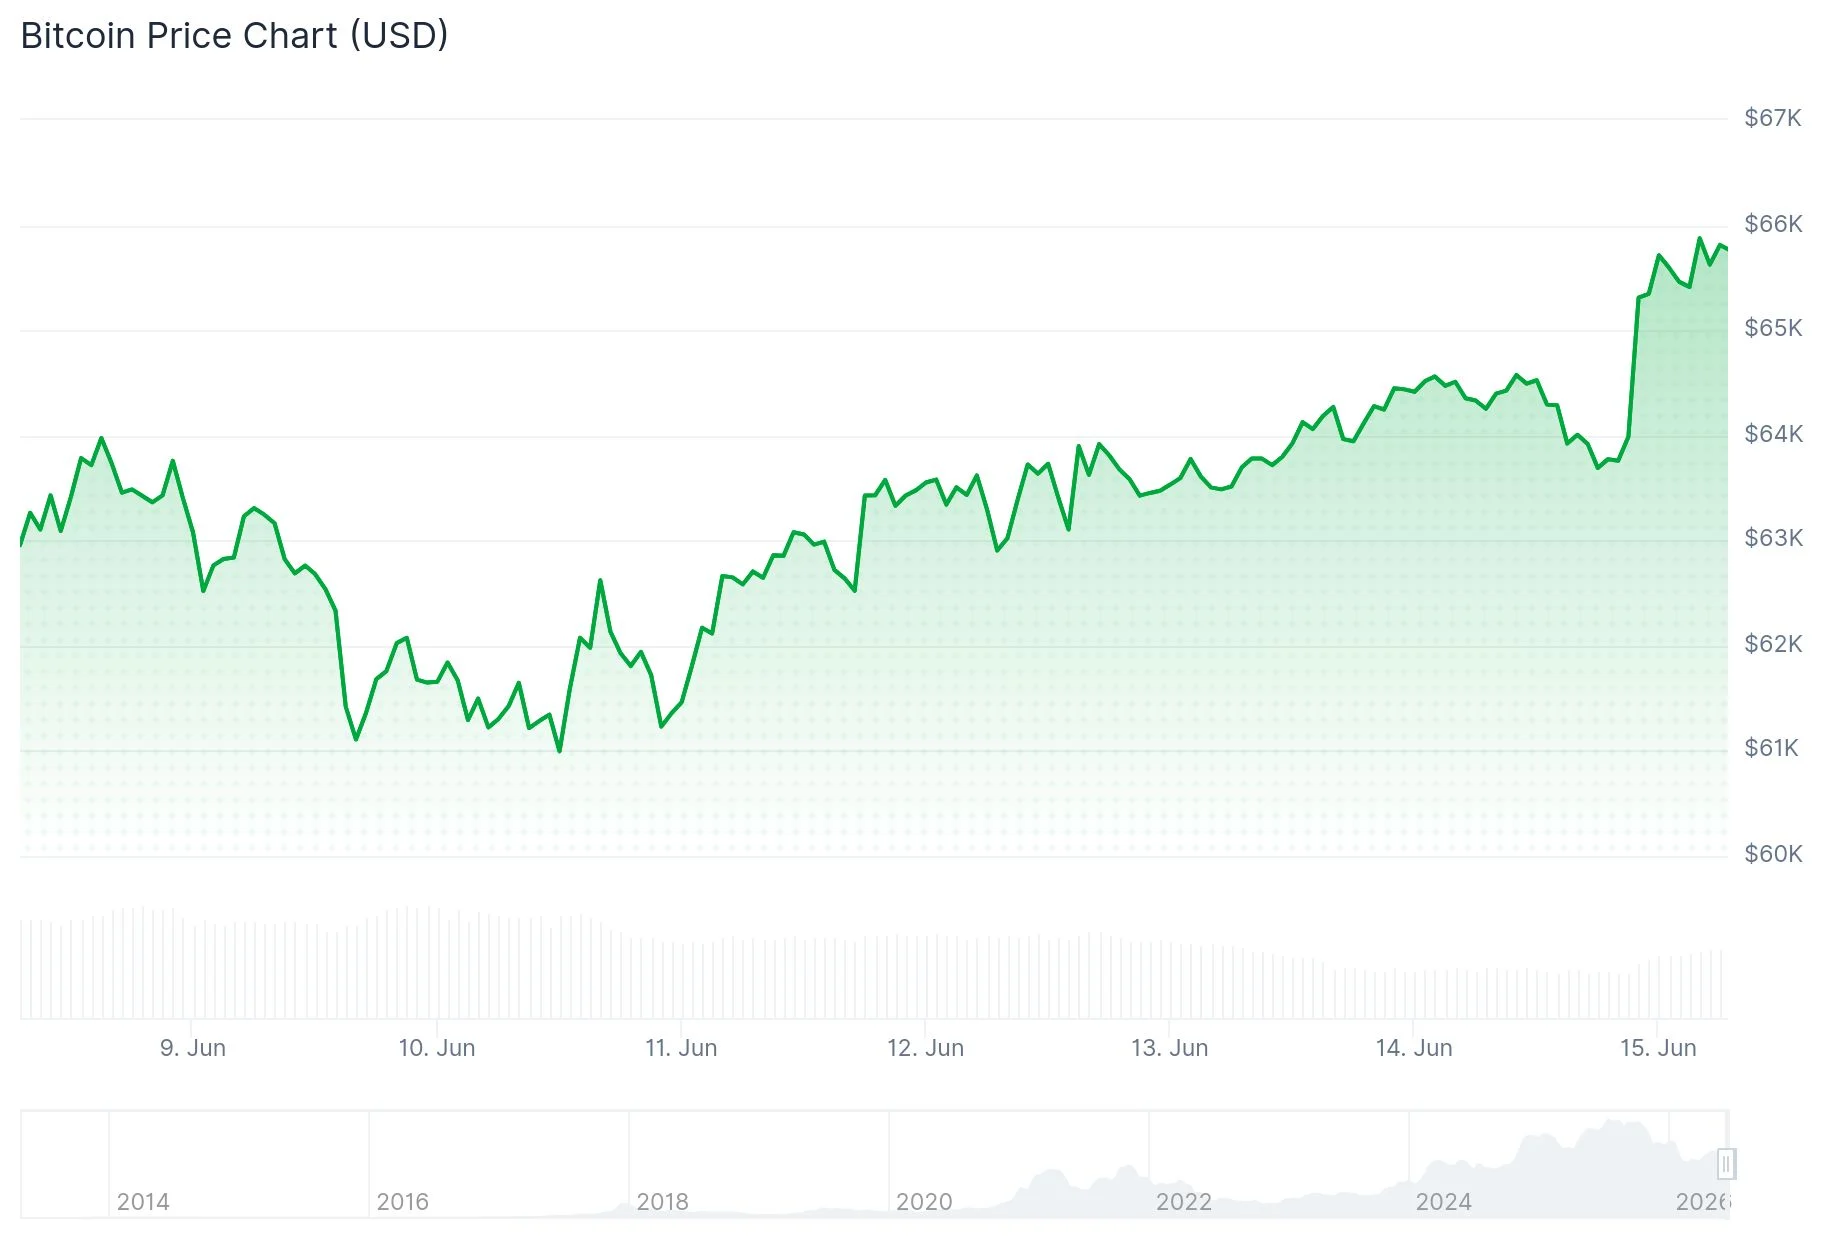
- Bitcoin gained 2.1% to reach approximately $65,800, marking its strongest level in almost 14 days
- Washington and Tehran finalized an agreement to cease conflicts and restore access to the Strait of Hormuz
- Crude oil prices plummeted, with WTI dropping close to 5% to reach $81 per barrel
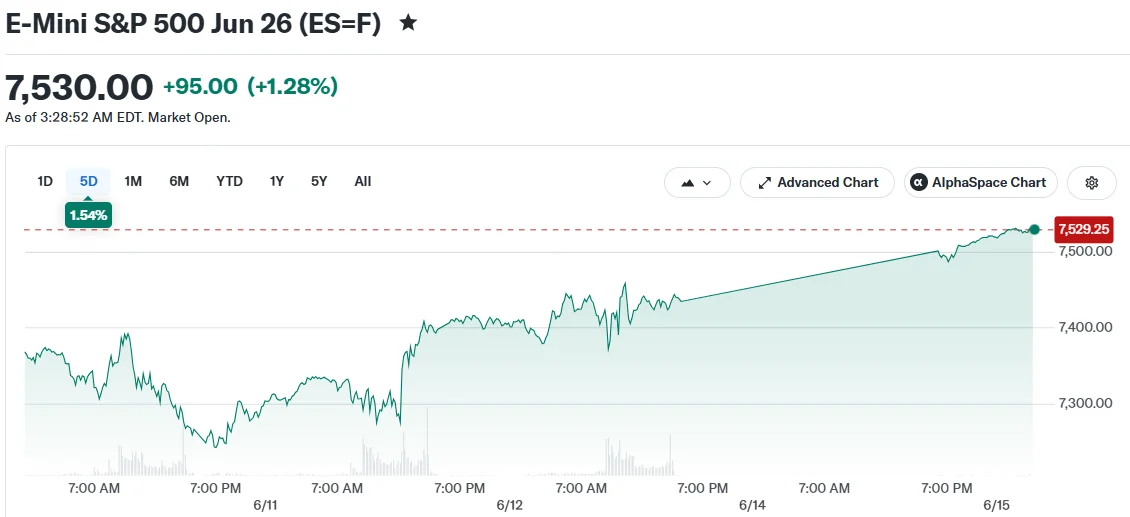
- American equity futures rallied sharply, led by Nasdaq 100 futures climbing 1.9%
- SpaceX stock skyrocketed more than 19% during its initial public trading, elevating its valuation beyond $2 trillion
Financial markets experienced a dramatic shift following the announcement of a peace accord between the United States and Iran. Cryptocurrency values climbed, equity futures jumped, and energy commodities retreated as investors adjusted to reduced Middle East conflict risks.
Cryptocurrency Markets Gain as Geopolitical Risk Diminishes
Bitcoin changed hands near $65,844 during Monday’s session, registering a 2.1% increase across the previous day. This represents approximately a 9% recovery from the sub-$60,000 depths reached last week, its most vulnerable position since October 2024.

The digital asset touched a session low around $63,722 during early Asian market hours, just before news of the diplomatic agreement emerged.
The positive momentum extended throughout digital asset markets. Ether advanced 2.5% to $1,721. Solana climbed 3.6% to $71. XRP increased 3.2% to $1.19. Hyperliquid’s HYPE token led the pack, surging 7.5% to approach $65.
Pakistan’s Prime Minister Shehbaz Sharif made the initial announcement regarding the diplomatic breakthrough. President Donald Trump subsequently confirmed the development, declaring on Truth Social that the agreement was “complete.” Officials plan a formal signing event this Friday in Switzerland.
Trump revealed he approved the reopening of the Strait of Hormuz, an essential waterway for international oil transportation. Tehran will reportedly obtain economic advantages in return for compliance with the agreement’s provisions.
Energy Prices Collapse, Equity Futures Soar
Brent crude tumbled more than 4% approaching $83 per barrel. West Texas Intermediate declined nearly 5% to $81 per barrel. These sharp declines signal diminishing concerns regarding potential oil supply interruptions that had maintained elevated energy prices throughout late February.
Dow futures advanced 1%. S&P 500 futures rose 1.2%. Nasdaq 100 futures spearheaded the rally, soaring 1.9%. Asian equity markets climbed over 3%, with Japan’s Nikkei 225 positioned for a historic closing high.
The greenback weakened against primary trading counterparts.
The relationship between energy prices and digital assets has been straightforward. Elevated oil costs had reinforced expectations of prolonged higher interest rates, which diverted capital away from speculative assets like Bitcoin. Declining oil prices reverse this dynamic.
SpaceX Trading Debut Amplifies Bullish Sentiment
Equity markets received additional support from SpaceX’s entrance into public trading. The company’s shares exploded more than 19% during the inaugural session, propelling its market capitalization past $2 trillion. The stock extended gains with an additional 3% rise in extended trading.
Markets approach an abbreviated trading week carrying this upward momentum.
Moving forward, market participants continue monitoring Federal Reserve monetary strategy. Current pricing indicates greater than 98% likelihood that the central bank maintains existing interest rate levels at the upcoming policy meeting.
Two demand-side uncertainties persist specifically for Bitcoin. Strategy’s recent revelation that it liquidated 32 Bitcoin to finance preferred share dividend payments undermined confidence regarding institutional accumulation. Exchange-traded fund withdrawals have similarly created downward pressure. Neither challenge is addressed by the diplomatic agreement.
Kill Zone trading is a method that focuses on the most liquid and volatile periods of the trading day. It aims to align trades with institutional activity during specific time windows. The concept comes from the Inner Circle Trader (ICT) method, with ICT Kill Zone times covering the Asian, London, and New York sessions. These forex Kill Zone times mark specific intraday periods when liquidity, trading volume, and institutional activity tend to increase, with the London Kill Zone time among the most active windows.
This article explains forex Kill Zone times, the main trading sessions, and the role of institutional order flow in Kill Zone trading.
What Is a Forex Kill Zone?
A forex Kill Zone is a short, high-activity window when a currency pair tends to see higher volatility and trading volume. These windows usually align with the open of a major session or occur during forex session overlaps. The concept, popularised by Michael Huddleston, also known as the Inner Circle Trader, highlights the importance of timing in trading strategies.
These active windows sit inside the broader forex market sessions. The forex market operates 24 hours a working day across four major sessions: Sydney, Tokyo, London, and New York. Each session reflects the working hours of its regional financial centre.
A trading session and a Kill Zone are not the same thing. A session lasts around nine hours and covers a region’s full trading day. A Kill Zone is a shorter window, often two to three hours, when order flow tends to concentrate. Forex Kill Zones therefore act as focused periods within these longer sessions.
Two main forces drive this concentration of activity during a Kill Zone. Liquidity rises as institutional order flow enters the market, which can tighten spreads. Volatility tends to rise as that heavier order flow moves price more quickly. A session overlap strengthens both effects, since two regions trade at once. The London and New York overlap is the clearest example, and it shapes much of Kill Zone trading.
Forex Kill Zone Times at a Glance
Forex Kill Zone times group into four main windows across the trading day, each tied to the main ICT trading sessions. The table below sets out each window in GMT for winter and summer, the pairs that tend to lead it, and how the market usually behaves.
The Asian window keeps the same GMT trading times year-round, since Tokyo does not observe daylight saving. For current session times, traders often confirm the windows against a forex trading hours reference.
Main ICT Kill Zone Times in Detail

Each Kill Zone period corresponds to transitions in major forex markets worldwide. The windows differ in their typical pairs, pace, and liquidity.
Below, we’ve described each along with the key ICT Kill Zone times. You can see how currency pairs react during these times in FXOpen’s TickTrader trading platform.
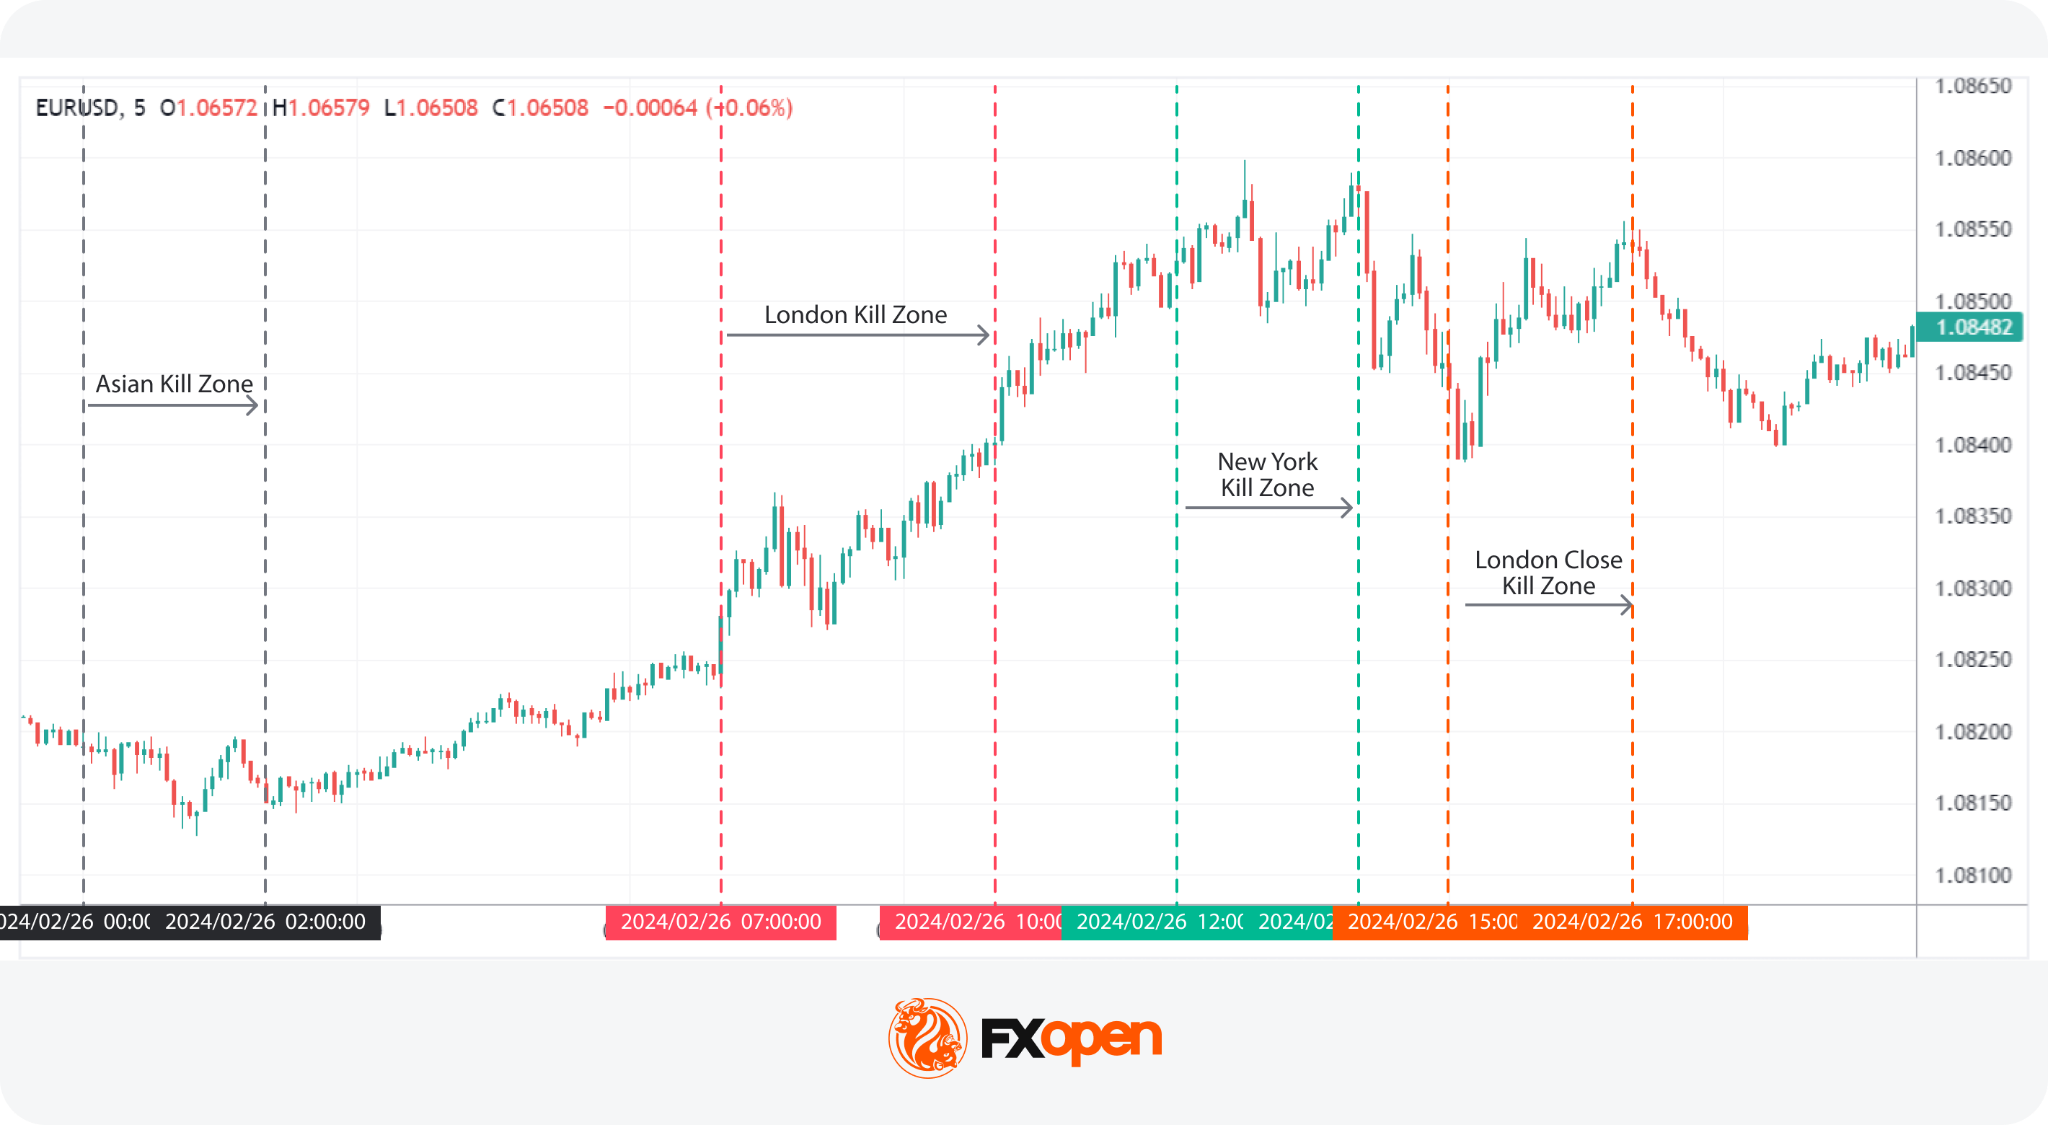
1. Asian Kill Zone
Asian Kill Zone Time Period: 23:00 GMT to 02:00 GMT in winter and in summer.
This window coincides with the opening of Asian markets, primarily Tokyo. This period sees increased activity in currency pairs with AUD, NZD, and JPY.
During these hours, price tends to trade inside a tight range rather than trend strongly. This is known as the Asian range, and traders watch its high and low as reference levels. Lower participation means liquidity builds slowly rather than driving large moves. That accumulated liquidity can matter later, since the high and low of the Asian range often shape the first London moves. A break of either level after the London open can signal where larger order flow is heading.
2. London Kill Zone Time
ICT London Kill Zone Time Period: 08:00 GMT to 11:00 GMT in winter (07:00 GMT to 10:00 GMT in summer).
This window is known for its volatility and significant trading volume, particularly involving EUR and GBP. As the London session opens, it often establishes the daily highs (in bullish markets) or lows (in bearish markets).
Much of this reaction centres on the Asian session highs and lows formed overnight. Price often sweeps these levels first, taking liquidity that rested above or below the Asian range. A liquidity sweep of this kind can precede a sharper move once the level breaks. London session volatility can rise quickly as European volume enters. Traders study these conditions to prepare for potential breakouts or reversals.
3. New York Kill Zone Time
New York Kill Zone Time Period: 13:00 GMT to 16:00 GMT in winter (12:00 GMT to 15:00 GMT in summer).
This window marks the overlap of the London and New York sessions, creating a critical period for USD-paired currencies.
USD pairs become more active when the New York forex session overlap occurs because American volume joins a market London is still trading. The New York Kill Zone draws traders from two continents at once, which lifts liquidity and pace. High-impact US economic data is often released during this period, including inflation and employment figures. These releases can move USD pairs sharply within minutes, so volatility tends to spike around them.
Traders seek continuation or reversal of the trends established over the London session, employing strategies that capitalise on the volatility to maximise returns.
4. London Close Kill Zone
London Close Kill Zone Time Period: 15:00 GMT to 17:00 GMT in winter (14:00 GMT to 16:00 GMT in summer).
As the London session concludes, this window typically exhibits less volatility but still offers conditions for strategic trades. Traders might observe retracements or continuations of earlier trends.
European participation declines as London desks close their books for the session. With fewer active participants, liquidity and volatility usually eases versus the London and New York windows. Moves can still occur, though they often lack the force seen during the main overlap. Strategies here often centre on trend exhaustion as European traders step back before the US close.
Trading Considerations During Kill Zones
When engaging with Kill Zones in forex, practical considerations are important for leveraging these periods. Keep in mind these things:
Economic Calendar Events
High-impact data often lands during the New York Kill Zone and the London hours. Releases such as interest-rate decisions and employment figures can create market volatility. Many traders check an economic calendar before a session to see what is scheduled.
Daylight Saving Time Adjustments
Traders account for time zone shifts such as British Summer Time (BST) and Eastern Daylight Time (EDT) when planning their trading schedules. These shifts can impact the real-time operation of forex markets by altering the relative timing of session openings and peak activity periods.
BST is GMT+1, moving the London window to an hour earlier for those trading on GMT. During BST, which typically runs from late March to late October, the London Kill Zone shifts from 07:00 to 10:00 GMT. Conversely, EDT, which is GMT-4, affects those in the US by advancing the New York window to start and end an hour earlier. This period typically extends from the second Sunday in March to the first Sunday in November.
For a quick conversion, add one hour to GMT during BST to reach local London time. Traders also confirm broker or server time, since platform clocks may differ from GMT.
Risk Management
Trading these windows means facing periods of rapid, hard-to-anticipate price movement. Sound risk management may potentially help traders manage that exposure.
- Volatility-Based Position Sizing: Adjusting position sizes based on volatility may be useful. In more volatile periods like the London or New York openings, reducing position size might help manage potential losses.
- Time-Specific Stop-Loss Orders: Stop-loss orders that reflect the heightened activity levels is another risk management tool. Pre-defined risk limits, set before the session, may potentially help traders avoid reactive decisions when price moves quickly. Wider stops may suit the New York window, where price gaps are more common. Slippage can also rise around high-impact news, filling orders away from the intended level.
- Real-Time Monitoring: Active monitoring during these volatile times is vital. Setting alerts at particular levels and indicators may aid in a proactive approach.
Currency Pairs Commonly Traded During Kill Zones
Each Kill Zone tends to favour the major currency pairs tied to the regions trading at that hour. Matching a pair to its active window can place a trade where liquidity is deepest.
EUR/USD is most active across the London and New York windows, when European and US volume overlap. It carries some of the tightest spreads in forex, which suits the faster pace of these hours. GBP/USD also leads during the London Kill Zone, often moving further than EUR/USD on the same news.
USD/JPY draws activity in both the Asian and New York windows, since it bridges two of the regions. It tends to react sharply to US data and to shifts in risk sentiment. AUD/USD is most active in the Asian window, when Australian and regional markets set the early tone.
Liquidity differs across these pairs and across the windows themselves. The major pairs above usually trade with deeper liquidity and narrower spreads than minor or exotic pairs. That depth tends to thin outside the main ICT trading sessions as currency pair activity declines, which can widen spreads and slow fills. For this reason, traders often focus on the pairs whose home session is open.
Key Takeaways
Kill Zone strategies focus on specific periods of the trading day when liquidity and market activity tend to increase. By monitoring these windows, traders can analyse how price behaves around session opens and overlaps, where larger market participants are often most active.
The four forex Kill Zones are the Asian, London, New York, and London Close windows. Each corresponds to a key trading session or session overlap – key institutional trading hours – and ICT Kill Zone times may shift during daylight-saving periods. Understanding these time windows can help traders place market activity into context, as liquidity, volatility, and price behaviour often vary significantly from one session to another.
Those looking to refine their market timing and participate in high-impact trading sessions may consider opening an FXOpen account to access a wide range of currency pairs during these critical periods of volatility.
FAQ
How Could You Use a Kill Zone?
Traders use a Kill Zone to time entries and exits during periods of high volatility and liquidity, capturing significant price movements during specific time windows — usually at the beginning or end of a trading session or when sessions overlap.
How May Traders Participate During ICT Kill Zones?
Traders can engage by monitoring price action, identifying high-probability setups, and executing trades on currency pairs during major institutional trading windows.
What Are Forex Kill Zone Times?
Forex Kill Zone times are specific periods during major trading sessions when liquidity and trading activity tend to increase. They are commonly associated with the Asian, London, New York, and London Close sessions.
What Is the London Kill Zone Time?
The London Kill Zone time generally occurs around the opening hours of the London session. It is commonly referenced as 07:00 to 10:00 GMT in summer or 08:00 to 11:00 GMT in winter.
What Is Kill Zone Trading?
Kill Zone trading is a session-based approach that focuses on trading during periods when market participation and liquidity are typically higher.
What Is the New York Kill Zone?
The New York Kill Zone refers to the period when New York trading overlaps with London. This overlap often creates increased activity in USD-related currency pairs. It is commonly referenced as 13:00 GMT to 16:00 GMT in winter and 12:00 GMT to 15:00 GMT in summer.
Do ICT Kill Zone Times Change During Daylight Saving Time?
Yes. ICT Kill Zone times can shift when London or New York move to daylight saving time. For example, the London Kill Zone typically occurs one hour earlier in GMT during British Summer Time (BST). Traders should check current session schedules and their broker’s server time to ensure they are using the correct timings.
Which Currency Pairs Are Most Active During Kill Zones?
EUR/USD, GBP/USD, USD/JPY, AUD/USD, and other major pairs often show increased activity during their respective regional sessions.
This article represents the opinion of the Companies operating under the FXOpen brand only. It is not to be construed as an offer, solicitation, or recommendation with respect to products and services provided by the Companies operating under the FXOpen brand, nor is it to be considered financial advice.
Bitcoin (BTC) has rebounded to near $65,800 after an on-chain bottom signal flashed for the second time in 2026, the same setup that preceded a 24% rally earlier this year. Large holders added to their positions as the signal appeared, hinting they see the low as in.
The move pairs a rare metric with visible whale buying. Both point the same way, though weakening volume keeps the case from being one-sided.
A Bitcoin Bottom Signal Just Flashed?
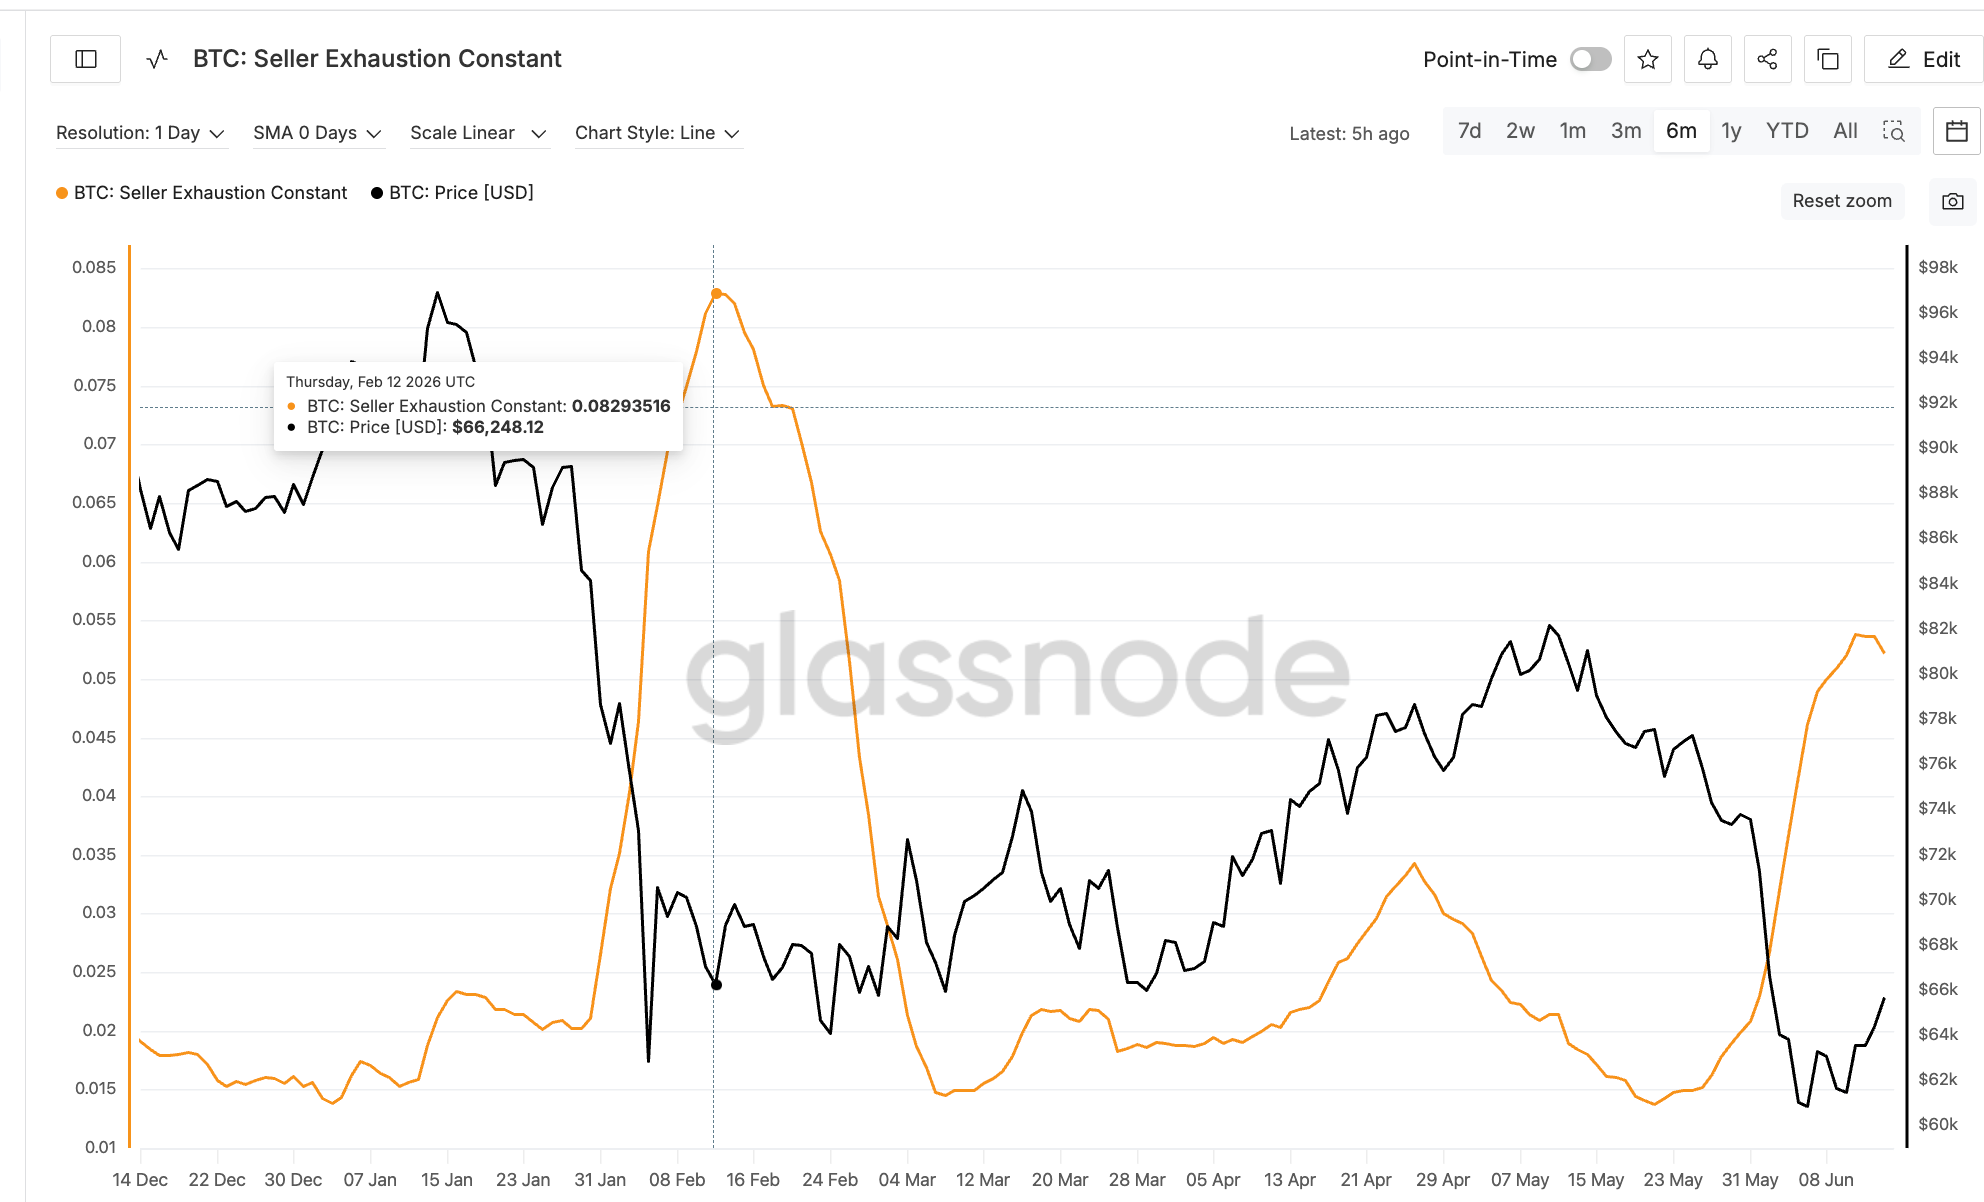
The starting point is a Glassnode metric called the Seller Exhaustion Constant. It multiplies the share of Bitcoin supply in profit by 30-day price volatility to flag low-risk bottoms, and it was first developed by ARK Invest.
Want more token insights like this? Sign up for Editor Harsh Notariya’s Daily Crypto Newsletter here.
History gives it weight. The metric peaked at 0.082 on February 12, when BTC traded near $66,248. Price then climbed to about $82,186 by May 10, a gain of roughly 24%.

The signal marked the start of that run.
It has now flashed again. On June 11, the metric hit 0.053, its second-highest reading in six months.

That repeat is why the current setup matters, and the next layer shows who acted on it.
Whales Bought Into the Exact Signal
Large holders moved on the same cue. One of the biggest Bitcoin whale cohorts, holding between 100,000 and 1 million BTC, lifted its stash from about 693,600 BTC to 694,390 from June 11, the same day the signal fired.
Smaller whales followed. The cohort holding 1,000 to 10,000 BTC grew its position from roughly 4.24 million to 4.25 million BTC starting June 13. Together the two groups added close to 11,000 BTC, worth around $700 million at current prices.

The timing is the point. Whales accumulated on the exact signal that historically preceded gains, so the metric and the largest holders agree. The price chart shows whether the structure backs them.
Bitcoin Price Levels to Watch as the Rebound Meets Resistance
BTC rebounded from its $59,100 low and crossed $64,694 on June 11, the trigger that aligned with the signal. Bitcoin price trades near $65,800, now testing overhead resistance.
The bullish case builds on the setup. A reclaim of the 20-day exponential moving average at $66,610, a trend gauge that smooths recent price, opens $68,155, the 0.382 Fibonacci level that measures the proportional pullback from the prior swing.
Clearing that targets $70,953. If the US-Iran deal keeps supporting risk and retail joins the whales, a move toward $73,750 and then the 200-day EMA at $78,668 could follow, with $82,805 as the stretch target, echoing the last run. That implies a possible 8% move and more if momentum builds. Right now, the overall buyer-specific volume is on the decline as retail might be needing some more confirmation.

The bearish case rests on participation. Buying volume has weakened since June 11 even as price rose, which shows whales are adding but retail has not joined.
Without that demand, BTC could stall at $66,610 and slip back toward the $64,694 level it just reclaimed. A daily close above $66,610 confirms strength, while rejection there keeps the rebound capped.
The post Bitcoin Whales Scoop $700 Million Into the Same Setup That Sparked a 24% Rally appeared first on BeInCrypto.

BHP Shares Climb 3.6% to $65.18 on Copper Strength and Positive Market Sentiment

Ethereum Nears First-Ever 3 Straight Red Quarters as Bullish Signs Emerge

Ridley Scott’s War Movie Masterpiece Is Leaving Streaming This Month


-

 Business18 hours ago
No Jackpot Winner as $257 Million Prize Rolls Over to $269 Million Monday Draw
-

 Crypto World4 days ago
Oppenheimer backs SpaceX as $70 billion retail frenzy builds
-

 Crypto World4 days ago
Markets Rally as SpaceX IPO Looms Amid Iran Tensions and Inflation Surge
-

 Fashion3 days ago
Weekend Open Thread: Tuckernuck – Corporette.com
-

 Sports7 days ago
FIFA WC 2026 Group C: Morocco, Scotland challenge Brazil’s hunt for glory | FIFA World Cup 2022
-
 Crypto World7 days ago
Eli Lilly (LLY) Stock Surges 4% Following Breakthrough Sleep Apnea Trial Results
-
Crypto World9 hours ago
Zimbabwe Requires Crypto Businesses to Register Annually Under New FIU Regulations
-

 Entertainment6 days ago
The Ryan Gosling True Crime Thriller On Netflix That Gets Even Stranger, Stream It Now
-
 Sports6 days ago
Bangladesh beat Australia after 20 years in ODIs, register only their second win over six-time world champions | Cricket News
-

 Tech3 days ago
This Week In Security: Microsoft On Microsoft, Register Your Domains, Linux On ARM, And FreeBSD Joins The File Cache Club
-

 Tech2 days ago
NanoClaw integrates JFrog registries to secure AI agent downloads
-

 Crypto World2 days ago
Bitget enters Argentina’s regulated crypto market through PSAV registration
-

 Politics4 days ago
Politics Home | Healey Resignation Is “Colossal Failure Of Government”, Says Former Labour Defence Secretary
-

 Tech5 days ago
‘This is Seattle’s position on AI’: City Council votes unanimously to pause big new data centers
-
 Tech4 days ago
Dutton Ranch star claims they ‘didn’t see any disruption’ on set following Chad Feehan’s exit from Yellowstone spinoff fueled by Taylor Sheridan clash rumors
-

 NewsBeat3 days ago
El Nino has formed in the Pacific and could set records, forecasters say
-
 Entertainment4 days ago
Donnie Wahlberg & More Heat Up Las Vegas at Circa’s Barry’s Downtown Prime
-

 Sports4 days ago
First Time Since 1971: Australia Register Historic Low In ODI Cricket
-
 Tech4 days ago
Opendoor Ends India Operations, Fueling a Bigger Conversation About AI and Outsourcing
-

 Tech7 days ago
Nvidia and Hyundai deepen their robotics push around Atlas
You must be logged in to post a comment Login