

Crypto World
Aave's Kulechov Disputes Report, Says Firm Won't Sell AAVE at '70%' Discount


Aave founder Stani Kulechov on Thursday disputed a report that crypto exchange Kraken is in talks to take a stake in the largest decentralized lending protocol, saying the team would not sell its AAVE tokens cheaply. "First off, there is NO WAY we'd sell AAVE at a 70% discount lol," Kulechov wrote… Read the full story at The Defiant


Strategy turned a software company into the largest corporate Bitcoin holder on earth by exploiting a simple loop: trade above your Bitcoin’s value, issue stock, buy more Bitcoin, repeat. In June 2026, Bitcoin broke below $60,000, the stock fell under its own Bitcoin value, and the loop began running the other way. Here is how the machine works, why it reverses, and whether Saylor is actually trapped.
Summary
- Strategy’s mNAV fell to roughly 0.80, meaning its stock trades below the value of the Bitcoin it holds, which disables the premium-funded loop the company used to grow.
- The same reflexive flywheel that compounded gains on the way up now compounds pressure on the way down: at a discount, issuing equity destroys Bitcoin per share, and issuing preferred stock turns expensive, choking both funding taps at once.
- Annual dividend obligations across its preferred stack quadrupled to about $1.2 billion while cash reserves fell roughly 38%, collapsing dividend coverage from more than seven years to around 14 months.
- STRC, the key funding instrument, trades near $82 against a $100 par value, and a tiny 32-Bitcoin sale to fund a dividend broke Strategy’s long-standing never-sell narrative.
- Analysts are split between a “trap” thesis and a “strained but not broken” view, and the outcome hinges almost entirely on Bitcoin’s price, with a roughly $1 billion debt maturity in 2027 as the key deadline.
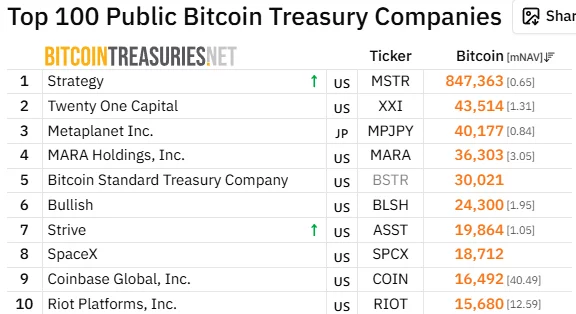
For five years, Michael Saylor ran one of the most effective financial machines in modern markets, a self-reinforcing loop that converted a mid-sized software company into the largest corporate holder of Bitcoin on earth, with more than 847,000 coins on its balance sheet.
The machine had a simple engine at its center: as long as Strategy’s stock traded at a premium to the value of the Bitcoin it held, the company could issue new shares or preferred stock above that value, use the cash to buy more Bitcoin, and increase the amount of Bitcoin backing each existing share, which justified the premium and let the loop run again. It was elegant, it was relentless, and for a long time, it worked spectacularly, turning Strategy into a Bitcoin proxy that often rose faster than Bitcoin itself.
In late June 2026, that engine threw itself into reverse. Bitcoin crashed below $60,000, Strategy’s stock fell beneath the value of its own Bitcoin, and the loop that had compounded gains on the way up began compounding pressure on the way down.
This piece explains how the flywheel works, why a falling price flips it into a doom loop, and whether Saylor is genuinely trapped or merely strained.
The reason this matters far beyond one company is that Strategy is the template. Hundreds of imitators built Bitcoin and crypto treasury companies on the same premium-driven logic, and the entire category has never faced a real test of what happens when the premium evaporates, and the price of the underlying asset sits below cost.
Strategy is now running that experiment in public, with its stock at a multi-year low, a stack of preferred shares trading below their face value, a dividend bill that has quadrupled in six months, and analysts openly debating whether the company can keep funding itself without selling the Bitcoin on which its entire identity is built, never selling.
The mechanics are intricate, but the core story is one of reflexivity, a feedback loop that amplifies whatever direction the market is already moving, and the lesson it is teaching is that a flywheel is only a flywheel while the premium holds.
The machine that made Strategy the biggest Bitcoin holder on earth
To understand why Strategy is in trouble, you first have to understand why it worked so well, because the same mechanism does both. The key number is something analysts call mNAV, shorthand for the ratio between the company’s market value and the net asset value of the Bitcoin it holds.
When mNAV is above one, the stock trades at a premium: investors are paying more for a share of Strategy than the Bitcoin behind that share is worth. That premium is the fuel for the entire engine. When the stock trades above the value of its Bitcoin, Strategy can issue new shares into the market, raise cash at that elevated price, spend the cash on more Bitcoin, and end up with more Bitcoin per share than it started with, even after the new shares dilute the count. Existing shareholders come out ahead, the higher Bitcoin-per-share figure justifies the premium, and the company can do it all again.
This is the flywheel, and for years it spun in Strategy’s favor with remarkable force. Every time Bitcoin rose, the premium tended to widen, which let Strategy raise more capital on better terms, which bought more Bitcoin, which lifted Bitcoin-per-share and the stock alongside it.
The company layered on a second source of fuel, a series of preferred stock instruments that let it raise money without diluting common shareholders directly, expanding the machine’s capacity. By accumulating relentlessly through this loop, Strategy built a position of more than 847,000 Bitcoin, acquired at an average price of roughly $76,000 per coin, and turned itself into the way many investors chose to hold leveraged exposure to Bitcoin through a regular brokerage account.
Saylor made perpetual accumulation the company’s whole identity, and the premium-funded flywheel was the mechanism that made the accumulation possible. The crucial thing to notice, the thing that explains everything that followed, is that the entire machine depends on that premium. Take away the premium, and the engine does not just slow down. It runs backward.
The week the premium died
That is precisely what happened in the final week of June 2026, and the speed of it caught even seasoned observers off guard. Bitcoin, which had been grinding lower for weeks beneath all of its major moving averages, broke hard, falling to around $59,000 in its worst single-day drop in months, a decline of roughly 5% that triggered a cascade of forced liquidations across crypto derivatives markets, with about $1.1 billion of leveraged positions wiped out in a single day. Strategy fell with it, as it almost always does, but it fell further.
The stock dropped more than 10% to around $92, then slid the next session again, breaking below $100 for the first time since early 2024 and hitting a two-and-a-half-year low. From its peak, the stock had lost roughly 81% of its value, erasing on the order of $150 billion in market capitalization.
The number that mattered most, though, was not the stock price or even the Bitcoin price. It was the mNAV, which fell to approximately 0.8. Strategy was now trading at a discount to its own Bitcoin: the market valued the company at less than the coins on its balance sheet were worth.
For a company whose entire model rests on trading at a premium, crossing below 1 is not a cosmetic change but a structural one, because it disables the engine. And it disabled both halves of that engine at once. With the common stock below the value of its Bitcoin, issuing new shares would destroy Bitcoin-per-share rather than build it.
With the preferred shares trading well below their face value, raising money through new preferred issuance had become punishingly expensive. Both capital taps, the two ways Strategy funds itself, were constrained at the same moment, and the company found itself holding more than 847,000 Bitcoin bought at an average price far above the current one, sitting on an estimated $10.6 billion in unrealized losses, with every coin it purchased in 2024, 2025, and 2026 underwater. The premium that powered the flywheel was gone, and without it, the machine had nothing to run on.
Why a discount breaks the flywheel
It is worth being precise about why crossing below an mNAV of one is so damaging, because the reversal is not merely the absence of the previous tailwind; it is an active headwind. Run the flywheel logic backward, and the problem becomes clear.
At a premium, issuing stock to buy Bitcoin increases Bitcoin-per-share, which helps shareholders. At a discount, the same action does the opposite: if the company issues shares below the value of its Bitcoin and uses the proceeds to buy more, each existing share ends up backed by less Bitcoin than before, not more, because the new shares were sold for less than the Bitcoin they represent.
The accretive loop becomes a dilutive one. The single most important tool Strategy used to grow now actively harms the shareholders it is meant to serve, which means the company effectively cannot use it. The equity engine does not just idle at a discount; it goes into reverse if switched on.
The preferred-stock engine suffers a parallel breakdown. Strategy’s preferred instruments were designed to raise money efficiently, but that efficiency depended on those instruments trading at or above their face value. When they slip well below face value, the company can only issue new ones by effectively promising a much higher yield, which makes the funding expensive and, past a point, impractical. So the second tap tightens just as the first one closes.
The result is a company that, at the very moment its Bitcoin is underwater, and its cash needs are rising, has lost the two mechanisms it relied on to raise money. This is the essence of reflexivity, the property that makes the model so powerful in both directions.
On the way up, a rising price widens the premium, which eases funding, which buys more Bitcoin, which lifts the price further. On the way down, a falling price kills the premium, which chokes funding, which raises the specter of selling Bitcoin to cover obligations, which threatens to push the price down further still. The machine is built to amplify, and amplification is wonderful until the direction changes.
STRC: the funding engine that stalled
Nowhere is the stall more visible than in the preferred instrument Strategy nicknamed Stretch, which trades under the ticker STRC and has become the clearest barometer of the company’s stress.
STRC is a perpetual preferred stock, meaning it has no maturity date, with a variable dividend rate that the company resets monthly with the explicit goal of keeping the security trading near its $100 face value.
Strategy launched it in mid-2025 through an offering that raised roughly $2.5 billion, marketing it to income-seeking investors as something close to a high-yield savings account, a stable instrument paying a generous dividend, recently around 11.5%, distributed in cash twice a month.
As a fundraising engine, STRC was meant to let Strategy raise money to buy Bitcoin without diluting common shareholders, and it worked beautifully while it traded at or above face value.
In June 2026, STRC broke down. It fell to record lows near the low 80s, roughly 17% below its face value, and that gap is what signals the engine has stalled. The loop only works above par: when STRC trades above $100, Strategy can issue new shares and funnel the proceeds into Bitcoin cheaply. Below par, that mechanism breaks, because issuing new preferred stock at a discount means accepting a far higher effective cost of capital.
The decline also drew a pointed accusation from longtime Bitcoin critic Peter Schiff, who argued that Saylor had marketed STRC to risk-averse retirees by assuring them the volatility had been stripped out, and that with the instrument now well below what many paid for it, erasing close to two years of dividends in price terms, the company had made material misrepresentations. Strategy’s defenders counter that the dividend rate resets precisely to pull the price back toward par over time, and that the decline reflects the market demanding a higher yield in a stressed environment rather than a fundamental break.
Either way, the practical reality is the same: the instrument designed to be Strategy’s smooth, reliable funding engine is sputtering, and a sputtering STRC means the company has lost its least dilutive way to raise cash at the worst possible time.
The dividend bill nobody is talking about enough
While the headlines fixate on the Bitcoin price and the stock, the more immediate pressure on Strategy is something quieter and arguably more dangerous: a cash squeeze created by its own dividend obligations. As Strategy issued more and more preferred stock to fund its Bitcoin buying, it accumulated a growing stack of instruments, STRC alongside others trading under tickers like STRK, STRF, STRD, and STRE, each carrying a dividend that must be paid in cash.
The combined annual obligation across all of them has ballooned from roughly $300 million at the start of 2026 to approximately $1.2 billion by June, a near fourfold increase in under six months. That is $1.2 billion a year the company must pay out, regardless of what Bitcoin does, regardless of whether its stock trades at a premium or a discount.
Against that rising bill, the company’s cash cushion has shrunk. Strategy’s dollar reserves fell by about 38% over the first half of 2026, partly because it spent roughly $1.5 billion in May buying back convertible notes, draining the very buffer that supports the dividends. The result is a metric that has deteriorated alarmingly: dividend coverage, a measure of how long the cash reserve could keep funding the payouts, collapsed from more than seven years to around 14 months.
One prominent analytics firm calculated that Strategy would need to rebuild its reserves to roughly $2.8 billion to restore a comfortable two years of coverage, and urged the company to halt Bitcoin purchases entirely until it does.
The squeeze is structural and self-inflicted: the more preferred stock Strategy issued to buy Bitcoin, the larger its perpetual cash obligations grew, and those obligations do not pause when Bitcoin falls. Crucially, the dividends are cumulative, meaning any payment Strategy skips still has to be made up later, so the company cannot simply switch them off to conserve cash without damaging its standing with the investors it depends on.
This is the real near-term pressure point. It is not that Bitcoin is down; it is that the bills come due in dollars, the dollar reserve is shrinking, and the usual ways of refilling it have stopped working.
The 32-Bitcoin sale that said everything
The moment that crystallized the market’s anxiety was almost comically small in scale. In late May and early June 2026, Strategy sold 32 Bitcoin, worth around $2.5 million, to help fund a distribution on its preferred stock.
Against a holding of more than 847,000 coins, 32 Bitcoin is a rounding error, a fraction of a fraction of the stack. And yet the disclosure sent a shock through the market, with Strategy’s shares falling more than 9% in a single session and Bitcoin itself sliding on the news. The reaction was wildly out of proportion to the size of the sale, which is exactly what made it significant.
The reason a negligible sale moved the market so much is that it broke a narrative. For years, Saylor’s defining promise was that Strategy buys Bitcoin and never sells it, that the company is a one-way accumulation vehicle whose conviction is absolute. The 32-coin sale, however tiny, was the first time in roughly 4 years that Strategy had sold any Bitcoin at all, and it was sold not opportunistically but to cover a cash obligation.
The company framed it as a demonstration of strength, proof that it could meet its dividend commitments through asset sales if needed. The market read it the opposite way: as the first visible crack in the never-sell promise, and as confirmation that the dividend machine had grown large enough to force sales of the asset it was built to accumulate.
A treasury company that has to sell its treasury to pay its bills has crossed a psychological line, and the size of the sale is almost beside the point. What investors saw was the principle giving way, and the principle was the whole story. Once the market accepts that Strategy will sell Bitcoin to meet obligations, the only remaining question is how much and how often, and that question hangs over everything.
Is Saylor actually trapped?
This brings us to the word that has attached itself to Saylor’s situation: trapped.
The trap thesis, laid out by several analysts, runs like this. Strategy cannot effectively buy, because at a discount, raising money to purchase Bitcoin destroys shareholder value rather than creating it. It cannot easily sell, because dumping Bitcoin would crystallize billions in losses and, given Strategy’s size, would likely push the Bitcoin price down further, deepening the very problem it is trying to solve and harming the asset that underpins the entire structure. And it cannot comfortably stand still, because the dividend obligations keep coming due in cash, the reserve keeps shrinking, and the preferred shares keep signaling stress.
One veteran portfolio manager assigned rough odds to the outcomes, putting his base case at a 70% chance that Strategy keeps selling small amounts of stock at unfavorable, non-accretive levels, slowly grinding the mNAV down toward an even steeper discount, with a smaller chance that Saylor sells several billion dollars of Bitcoin outright to buy time. In this reading, every available move makes some part of the structure worse, which is what a trap means.
The case against the trap framing deserves equal weight, because the situation, while genuinely strained, is not the same as imminent collapse, and several analysts argue exactly that. Forced selling is not actually required right now. Strategy is not contractually obligated to sell Bitcoin to defend its preferred shares; it can raise the dividend rate, issue shares even at unattractive levels, or use other tools to signal it can keep paying, and it has been doing so. It still holds an enormous, unencumbered Bitcoin position and retains real flexibility.
One prominent equity analyst reiterated a buy rating with a price target far above the current level, describing the preferred-stock decline as a market-driven reset of the yield investors require instead of a structural breakdown, a sign of a model strained but not broken.
Saylor himself points out that, despite the brutal drawdown, the stock remains a multiple of where it traded when he began buying Bitcoin in 2020, and that the company’s long-term objective is to maximize Bitcoin per share over the years, not to defend any particular monthly price. And the entire predicament reverses if Bitcoin simply recovers: a rising price would restore the premium, reopen the funding taps, and turn the flywheel forward again.
The honest assessment is that Strategy is under real, compounding pressure with a narrowing set of good options, which is a serious condition, but it is not yet insolvency, and conflating strain with doom is its own kind of error.
The 2027 wall and the price that has to hold
If you want to know what the market is really watching for, look past the daily price swings to a specific date and a specific number. Strategy carries debt, and one analyst has flagged roughly $1 billion of it maturing in September 2027.
To repay that obligation without selling Bitcoin, the reasoning goes, Strategy’s stock would need to trade above roughly $183, a level that corresponds to a Bitcoin price somewhere around $91,500 at an mNAV of one.
With the stock near or below $100 and Bitcoin around $60,000, the company sits far below that threshold, which is why the 2027 maturity has become a focal point. It is not an immediate crisis, since the date is more than a year out and Strategy has tools and time, but it functions as a deadline against which all the other pressures are measured. The runway is real, but it is not unlimited.
This frames the two scenarios cleanly. In the recovery scenario, Bitcoin climbs back over the months ahead, Strategy’s stock returns to a premium, the funding engine reopens, the preferred shares drift back toward par, and the dividend coverage rebuilds, at which point the trap dissolves, and the flywheel resumes spinning forward, exactly as it has after previous Bitcoin downturns.
Saylor’s entire bet is that this is what happens, that Bitcoin’s long-term trajectory rescues the structure as it always has before, and that conviction through the drawdown is the price of the eventual recovery.
In the adverse scenario, Bitcoin stays low or falls further, the discount persists, STRC remains below par, the cash reserve keeps shrinking against the $1.2 billion dividend bill, and Strategy is forced into steady, value-destroying sales of stock or, eventually, Bitcoin, grinding the structure down toward the 2027 wall in a weakened state.
The truth is that no one knows which path unfolds, because it depends overwhelmingly on the one variable Saylor cannot control, the price of Bitcoin. What can be said is that the model has lost its margin for error. For years, the flywheel gave Strategy the luxury of never having to be right about timing. Now, for the first time, timing matters, and the company is waiting on a price recovery it can only hope for.
What it means beyond Strategy
Step back from the single company and the larger significance comes into focus, because Strategy is not an isolated case but the original of a type. Its success spawned a wave of imitators, more than 200 Bitcoin and crypto treasury companies built on the identical premium-driven logic, each raising capital against a market premium to its holdings and buying more of the underlying asset, each implicitly assuming the premium would persist.
None of these companies had truly been tested by a sustained environment in which the underlying asset trades below their cost and the premium turns into a discount, because that environment had not arrived at scale.
Now it has, and Strategy, as the largest and most leveraged example, is the stress test the entire category is watching. What breaks or holds at Strategy tells every imitator something about the durability of the model they copied.
The deeper lesson is about the nature of reflexivity itself, and it is a lesson that applies to far more than Bitcoin treasuries. A reflexive machine, one whose inputs feed its outputs feed its inputs, is a wealth-compounding marvel while the cycle runs in your favor and a value-destroying trap when it runs against you, and the same features that make it powerful in one direction make it dangerous in the other.
Strategy’s flywheel did not change; the direction did, and that was enough to convert the most admired financial engine in crypto into a structure that analysts now describe with words like pickle and trap. Whether Saylor escapes depends on Bitcoin, and Bitcoin has rescued him before, which is why writing the company off would be as foolish as assuming it is invincible.
The honest watch list is short and specific: whether the mNAV climbs back above one, whether STRC reclaims its par value, whether the dividend coverage stabilizes, whether the company sells more Bitcoin, and above all, whether Bitcoin’s price recovers in time. Until those questions resolve, the machine that built the largest corporate Bitcoin position on earth is spinning in reverse, and everyone who copied it is watching to see how far backward it goes.
Frequently Asked Questions
What is mNAV and why does it matter for Strategy?
mNAV is the ratio between Strategy’s market value and the net asset value of the Bitcoin it holds. Above 1, the stock trades at a premium to its Bitcoin, which lets the company issue shares above that value, buy more Bitcoin, and increase Bitcoin per share, the loop that powered its growth. In June 2026, mNAV fell to about 0.8, meaning the stock trades at a discount to its own Bitcoin. That breaks the engine, because issuing shares at a discount destroys Bitcoin per share instead of building it, disabling Strategy’s main way of funding itself.
Why is Strategy’s flywheel now working against it?
Because the model is reflexive, amplifying whatever direction the market is moving. At a premium, a rising Bitcoin price widens the premium, eases funding, and buys more Bitcoin, lifting the stock further. At a discount, a falling price kills the premium, chokes funding, and raises the prospect of selling Bitcoin to cover obligations, which can push the price down further. The same mechanism that compounded gains on the way up now compounds pressure on the way down. Both of Strategy’s funding taps, common equity and preferred stock, are constrained at once because the stock trades below its Bitcoin value.
What is STRC and why is its price important?
STRC, nicknamed Stretch, is Strategy’s perpetual preferred stock, with a variable dividend reset monthly to keep it trading near its one-hundred-dollar face value. It was a key fundraising engine: when it trades above face value, Strategy can issue more and buy Bitcoin cheaply without diluting common shareholders. In June 2026, it fell to record lows near the low eighties, well below par, which breaks that mechanism, because issuing new preferred at a discount means a much higher cost of capital. Its slide is the clearest market signal that Strategy’s smoothest funding source has stalled.
Is Michael Saylor being forced to sell Bitcoin?
Not in a forced, contractual sense, at least not yet. Strategy did sell thirty-two Bitcoin in mid-2026 to fund a dividend, its first sale in about four years, which alarmed the market as a symbolic break from its never-sell stance. But the company is not required to sell to defend its preferred shares; it can raise the dividend rate, issue shares, or use other tools, and it retains a large, unencumbered Bitcoin position. The risk is that persistent stress leads to steady, value-destroying sales over time. Analysts consider a near-term forced liquidation unlikely, while disagreeing on how much pressure builds from here.
Why did selling just 32 Bitcoin matter so much?
Because it broke a narrative instead of a balance sheet. 32 Bitcoin is a rounding error against Strategy’s 847,000-coin stack, but it was the first sale in roughly four years and was made to cover a cash obligation, not to take profit. Saylor’s defining promise was that Strategy buys and never sells, so any sale, however small, signaled that the dividend machine had grown large enough to force sales of the asset it exists to accumulate. Once the market saw the never-sell principle give way, the only remaining questions were how much and how often, which is why a tiny sale moved the stock sharply.
Could Strategy recover, or is the model broken?
It could recover, and the outcome depends overwhelmingly on Bitcoin’s price, which Saylor cannot control. If Bitcoin climbs back, the premium returns, the funding taps reopen, the preferred shares drift toward par, and the flywheel resumes spinning forward, as it has after past downturns. If Bitcoin stays low, the discount persists, the cash squeeze from a $1.2 billion dividend bill worsens, and the company faces steady, value-destroying sales heading toward a roughly $1 billion debt maturity in 2027. Some analysts call the model strained but not broken; others see a trap. The honest answer is that the margin for error is gone, and timing now matters.
This article is information, not investment advice. It describes a fast-moving and contested situation, and prices, holdings, dividend obligations, and analyst views change quickly. Figures reflect reporting available as of June 25, 2026. Cryptocurrency and equities are volatile, and nothing here is a recommendation to buy or sell any asset. Verify current data from primary sources and consider your own circumstances before making any decision.

The liquidation heatmap shows a bulk of clustered liquidation risk above current prices, not below. That means that a move to the downside is unlikely to be amplified by a cascade of forced selling; the real danger is for those positioned short.
Open interest has risen roughly 0.28% over the past 24 hours, even as price fell by around 3% – signaling that traders aren’t closing their shorts, they’re doubling down and betting on a breach of the $58,000 level of support. Funding rates are also negative, another sign that the market is paying a premium for downside exposure.
Spot market depth reinforces strength beneath a delicate surface; CoinGlass data shows that there is a total of 6,900 BTC ($409 million) sat in bids on the order book between the current price and $50,000, while there are just 1,570 BTC ($93 million) in resting sell orders between the current price at $70,000, creating a bullish skew in terms of supply.
Typically, in scenarios like this, when a clearly overcrowded trade is identified, astute traders and market makers will target that weakness and move the price in the other direction. This could lead to those in shorts closing their positions to avoid paying funding and prevent liquidation.
The prolonged bear market has been brutal for countless altcoins, with Cardano’s ADA being particularly affected. Several hours ago, it dropped below $0.14 for the first time since late 2020, and it currently trades at around $0.147. Meanwhile, ADA’s market capitalization fell to approximately $5.5 billion, meaning the token is no longer among the 20 largest cryptocurrencies.
According to certain indicators, a rebound could be on the horizon, but a popular analyst thinks the asset is not completely out of the woods yet.
‘Bull Trap?’
In addition to ADA’s price decline, the community had to endure the major exploit of the Cardano ecosystem project SecondFi, in which attackers drained over $20 million.
Despite the breach, renowned analyst Ali Martinez revealed that the TD Sequential indicator has flashed a buy signal. He claimed this development could result in an immediate relief rally to as high as $0.176, which can stop there and instead be followed by another correction.
“While this indicator signals a near-term bounce, the broader market structure suggests caution. This localized push may act as a trap to lure in buyers before hitting immediate resistance and continuing lower,” Martinez warned.
Earlier this month, he opined that ADA has been forming a bearish flag since the beginning of June and has started breaking from the structure. In his view, this has increased the likelihood of a slump towards $0.13.
Another analyst who touched upon the matter was BillifyX. They noted that ADA has lost its major support zone at around $0.148-$0.15, adding that if bulls can’t reclaim that area, the asset could continue bleeding. “But if they do, this breakdown could turn into a trap,” they added.
For their part, X user Sssebi (who is usually quite bullish on ADA) suggested that the asset’s cycle bottom could be around $0.12.
The Optimistic Scenario
Despite ADA’s poor performance and the carnage in the broader crypto market, some technical indicators, including the asset’s Relative Strength Index (RSI), hint at an impending resurgence. Its ratio has slipped under 30, meaning the coin has entered oversold territory and could be due for a recovery. The index ranges from 0 to 100, with values above 70 interpreted as a warning of an incoming price decline.

ADA’s exchange netflow points in the same direction. Over the past weeks, investors have shifted from centralized platforms toward self-custody methods, thereby reducing immediate selling pressure.

The post Cardano (ADA) Flashes a Buy Signal, But There Is a Catch (Analyst) appeared first on CryptoPotato.
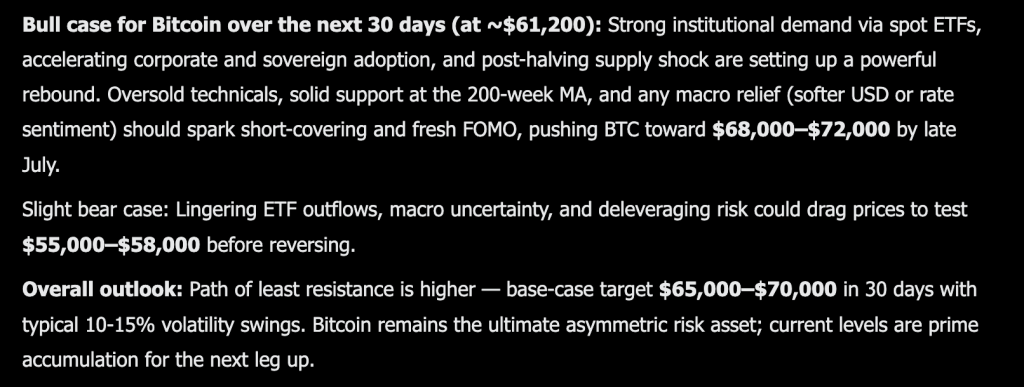
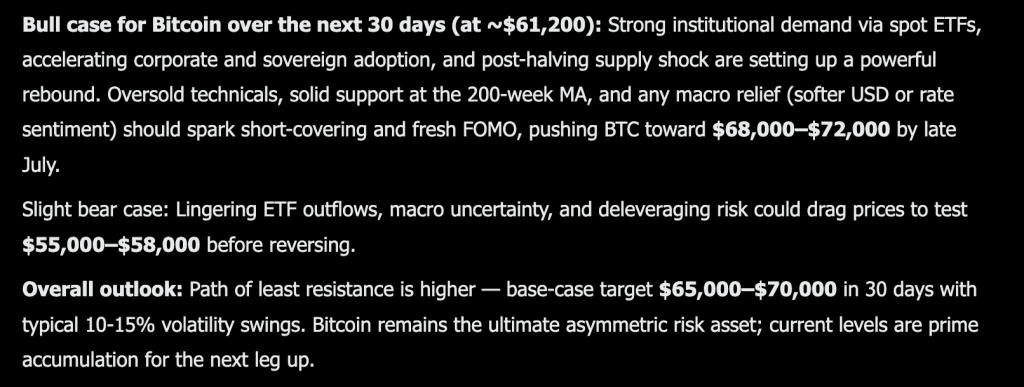
Grok AI just laid out a short fuse Bitcoin price prediction that trades the usual year end horizon for something far more immediate. The model predicts a jump to $68,000 to $72,000 within just 30 days, a sharp move from where price sits right now.
The bull case leans on a familiar combination of forces all converging at once. Bitcoin is trading near $61,200 today, and strong institutional demand through spot ETFs remains a central pillar of the thesis.
Accelerating corporate and sovereign adoption adds another layer of steady buying pressure that does not depend on retail sentiment swinging one way or another.
The post halving supply shock continues to matter too, since less new coin hitting the market tends to amplify any demand spike that shows up. On the technical side, the model points to oversold conditions and solid support sitting right at the 200 week moving average, a level that has historically marked major turning points in past cycles.
Any macro relief, whether that comes from a softer dollar or a shift in rate sentiment, could be the spark that triggers short covering and a fresh wave of FOMO buying.
Put together, the model frames current levels as prime accumulation territory, with a base case target of $65,000 to $70,000 over the next month, even accounting for typical 10% to 15% volatility swings along the way.
The bear case keeps things grounded in the same risks that have weighed on price for months now. Lingering ETF outflows could continue draining demand at the margins.
Macro uncertainty remains a wildcard that could spook risk appetite at any moment. Deleveraging risk is also still in play if positioning gets too one sided in either direction. Under that scenario, the model sees price testing $55,000 to $58,000 before any real reversal takes hold.
Even with that downside acknowledged, the model still frames the broader path of least resistance as higher.

Don’t Miss Out on Our $1,000 USDT Airdrop on ByBit
Bitcoin Price Prediction: BTC Squares Off With Its Own 200 Week Lifeline
The weekly chart shows bitcoin at $61,182 after a sharp pullback from a recent bounce that topped out near $82,000 in May. That entire move down has been steady and persistent, breaking through several minor support shelves on the way to current levels.
Zooming out, this pullback looks like a retest of the broader uptrend that built off the 2023 lows, rather than a full trend reversal at this stage.
The chart shows a clear pattern of higher highs and higher lows stretching back over two years, even with this recent dip cutting into that structure. Immediate resistance sits near $70,000, a level that capped multiple rallies earlier this year, with a heavier ceiling near $82,000 where the most recent bounce ran out of steam.
Support is harder to pin exactly without the indicator data, but the $59,000 area marked on this candle and the broader zone around $55,000 to $58,000 line up with prior consolidation ranges from earlier in the cycle, which fits the bear case scenario directly.
Price action over the past few weeks shows steady red candles with limited buying response, suggesting sellers currently have the edge in the short term.
Overall momentum on this chart looks weak and still searching for a floor rather than confirming any reversal yet. If bitcoin can hold above $59,000 and reclaim $70,000 in the weeks ahead, the kind of short covering rally Grok is describing becomes a lot easier to picture playing out on this chart.
You Might Like What Grok AI Predicts About This New Layer 3 Called LiquidChain
Large caps are not in trouble. They are just out of the room. Bitcoin, Ethereum, and XRP have been testing the same ceilings for weeks with nothing breaking through.
Every macro catalyst has a new arrival date. Every institutional wave has a new quarter attached to it. Holding assets where the next leg depends entirely on someone else’s decision is not a trade. It is a waiting room.
The money that wins cycles never announces where it is going.
The capital that actually moves in cycles relocates before the destination has a name.
Small market cap infrastructure plays operate on physics that large caps simply cannot replicate. A rotation that would not register as a rounding error at Bitcoin’s scale can reprice an undiscovered project by multiples.
The opportunity lies in the distance between what something is genuinely worth and what the market has assigned it so far. That distance shrinks to zero the moment discovery happens. Before that moment, it is fully capturable.
Multi-chain fragmentation is one of the most consistently expensive problems in DeFi, and it has never been solved. Bitcoin, Ethereum, and Solana exist as completely isolated systems. No shared architecture. No native interoperability. Every time value moves between them, the disconnection extracts its cost in fees, slippage, and failed transactions. That cost hits every single crossing every single time.
LiquidChain makes the crossing free, as Copilot AI predicts. All 3 networks inside one execution environment. Single deployment. Complete ecosystem access. No tax on any interaction.
The presale is at $0.01454 with just over $860,000 raised. Early and undiscovered.
Execution is unproven. Adoption is unknown. Established assets offer predictability toward a ceiling that the market already sees. LiquidChain is an entry point that does not exist once the market finds it.
The post You Will Not Like Where Grok AI Predicts Bitcoin Going in The Next 30 Days appeared first on Cryptonews.


Aave founder Stani Kulechov has rejected reports suggesting Aave would sell AAVE tokens to Kraken at a roughly 70% discount, while confirming that discussions around long-term strategic partnerships have taken place.
Summary
- Stani Kulechov rejected claims that Aave would sell AAVE tokens to Kraken at a roughly 70% discount.
- Kulechov said all Aave Protocol revenue flows to the Aave DAO and revealed plans for an automated AAVE buyback mechanism.
- Grayscale maintained AAVE appears undervalued, with a model-based fair value of up to $175 if tokenized assets expand in DeFi.
Earlier, a report claimed that Kraken is in advanced talks to invest 35,000 ETH in exchange for 250,000 AAVE tokens and a 15% equity stake in Aave Group. The reported transaction was valued at approximately $71 million and implied an Aave Group valuation of about $385 million.
Responding to the report, Kulechov argued that its framing did not accurately describe the discussions. He said there was “no way” Aave would sell AAVE tokens at a 70% discount. While disputing that characterization, he did not deny that negotiations with strategic partners have occurred.
Instead, Kulechov explained that Aave Labs holds an allocation of AAVE tokens that several market participants have expressed interest in purchasing as part of deeper, long-term partnerships. His comments drew a distinction between Aave Labs, which develops the protocol, and the Aave DAO, which governs the ecosystem and controls protocol economics.
Protocol revenue continues flowing to the DAO
Expanding on that structure, Kulechov said every dollar of revenue generated by the Aave Protocol and the GHO stablecoin accrues to AAVE through the Aave DAO. He added that the same arrangement now covers revenue from Aave App, Aave Pro, and swap-related products following the approval of the Aave Will Win governance proposal.
Under that framework, Aave Labs does not keep protocol or product revenue. Instead, the development company receives funding approved by the DAO to continue building the protocol.
Kulechov said Aave is currently generating approximately $134 million in annualized revenue, with those proceeds flowing to the DAO rather than the development company. He also stated that the Aave brand, protocol software, and other intellectual property created for the ecosystem now belong to AAVE under the updated governance model.
Separately, Kulechov revealed that the team is designing Aavenomics 3.0, which he said will introduce an automated, non-discretionary AAVE buyback mechanism. He did not disclose the launch timeline, funding source, or expected size of the program.
Aave already operates a buyback system funded by excess protocol revenue. Based on Kulechov’s comments, the proposed mechanism would automate purchases rather than relying on governance decisions for each buyback.
Tokenized assets remain central to Aave’s valuation case
Looking beyond governance, Kulechov said Aave is expanding its focus beyond crypto lending to include tokenized real-world assets and other financial products.
That strategy aligns with a recent assessment from crypto.news, which reported last week that Grayscale Research considers AAVE undervalued at current prices using a cash-flow model commonly applied to traditional financial companies.
Grayscale estimated Aave could generate roughly $60 million in revenue during 2026 and placed the token’s current fair value between $80 and $100 based on a 20x to 25x fintech earnings multiple.
According to Grayscale Research, a fair value of about $175 could become possible within a year if regulatory clarity accelerates the use of tokenized assets such as Treasury products, private credit, and money market funds as collateral in DeFi lending.
The research noted that the estimate is model-based rather than a guaranteed price target and depends on tokenized assets bringing additional deposits, borrowing activity, and fee generation to the protocol.
Following Kulechov’s comments, AAVE climbed to an intraday high of $87.50 before easing to around $82, while the token continued to receive support from Standard Chartered’s previously published $3,500 price target for the end of 2030.


21Shares has cut several of its 2026 crypto forecasts, saying institutional adoption has continued to grow even as weaker prices and slower enterprise adoption have delayed parts of the industry’s recovery.
Summary
- 21Shares cut several 2026 crypto forecasts despite continued growth in institutional adoption and market infrastructure.
- The firm expects prediction markets to exceed $100 billion in annual trading volume while industry consolidation accelerates.
- 21Shares said ETF holdings remain near record highs, suggesting institutions continue accumulating despite market weakness.
According to 21Shares’ midyear outlook, the digital asset industry has continued to build stronger infrastructure despite a difficult market environment.
The asset manager said progress in areas including exchange-traded funds, stablecoin regulation, tokenization, and prediction markets has exceeded what recent price action suggests. Even so, weaker crypto prices, major decentralized finance exploits, and slower enterprise adoption have prompted the firm to reduce several expectations it had set earlier this year.
The report argues that institutional participation has increased without changing Bitcoin’s long-established market structure. According to 21Shares, Bitcoin reached roughly $126,000 in October 2025 before entering a decline that has largely followed historical post-halving patterns. While larger institutional ownership has reduced the severity of drawdowns, the firm said the four-year market cycle remains intact.
Former 21Shares co-founder Ophelia Snyder, who left the company after its acquisition by FalconX in 2025, recently expressed a similar view in a Substack post.
Snyder wrote that crypto’s investor base has become more institutional and increasingly tied to the wider financial system, making prices more responsive to macroeconomic developments, geopolitical events, and competing investment narratives.
Prediction markets and consolidation stand out
Among the strongest-performing segments, 21Shares identified prediction markets as one of the industry’s fastest-growing sectors. The firm expects annual trading volume in prediction markets to exceed $100 billion this year.
The report also identified consolidation as an accelerating trend across crypto markets. According to 21Shares, several publicly listed companies that hold digital assets on their balance sheets are trading below the value of their crypto holdings, increasing the likelihood of mergers or acquisitions among smaller treasury firms.
A comparable pattern is developing within Ethereum’s layer-2 ecosystem. The report said a small number of leading rollups continue to capture users and liquidity, while many smaller networks have struggled to build meaningful activity.
Institutional investors continue accumulating through volatility
Crypto investment products have also continued attracting institutional capital despite recent market weakness, according to the report.
Although U.S. spot Bitcoin exchange-traded funds have recorded about $3 billion in net outflows this year, 21Shares said ETF holdings remain above 1.25 million BTC, close to a record high. The firm argued that these figures indicate many investors have maintained or quietly increased positions instead of exiting the market during the downturn.
Recent market volatility has nevertheless weighed on sentiment. As crypto.news reported earlier, a stronger-than-expected U.S. PCE inflation reading renewed concerns that the Federal Reserve could keep monetary policy tighter for longer, triggering nearly $1.5 billion in crypto liquidations and pushing Bitcoin, major altcoins, and crypto-related equities lower.
Earlier this week, Bank of America also revised its outlook to forecast three 25-basis-point Federal Reserve rate hikes this year, citing persistent inflation risks.
Despite the latest selloff, some institutions have maintained their longer-term outlook. As crypto.news reported earlier in June, Standard Chartered’s Geoffrey Kendrick reiterated the bank’s $100,000 Bitcoin and $4,000 Ethereum targets after an earlier market decline.
Kendrick argued at the time that Bitcoin’s drop toward $59,000 likely represented the cycle low, while stronger ETF flows and institutional demand remained key conditions supporting the bank’s longer-term price targets.
Looking ahead, 21Shares said improving regulatory clarity in the U.S. continues to support product launches. The firm pointed to the Securities and Exchange Commission’s generic listing standards, which have accelerated approvals beyond Bitcoin and Ether products.
Hyperliquid was highlighted as one example, with the report noting that U.S. spot ETFs tracking the asset gathered more than $150 million in net inflows within their first month, signalling continued institutional interest in digital assets.

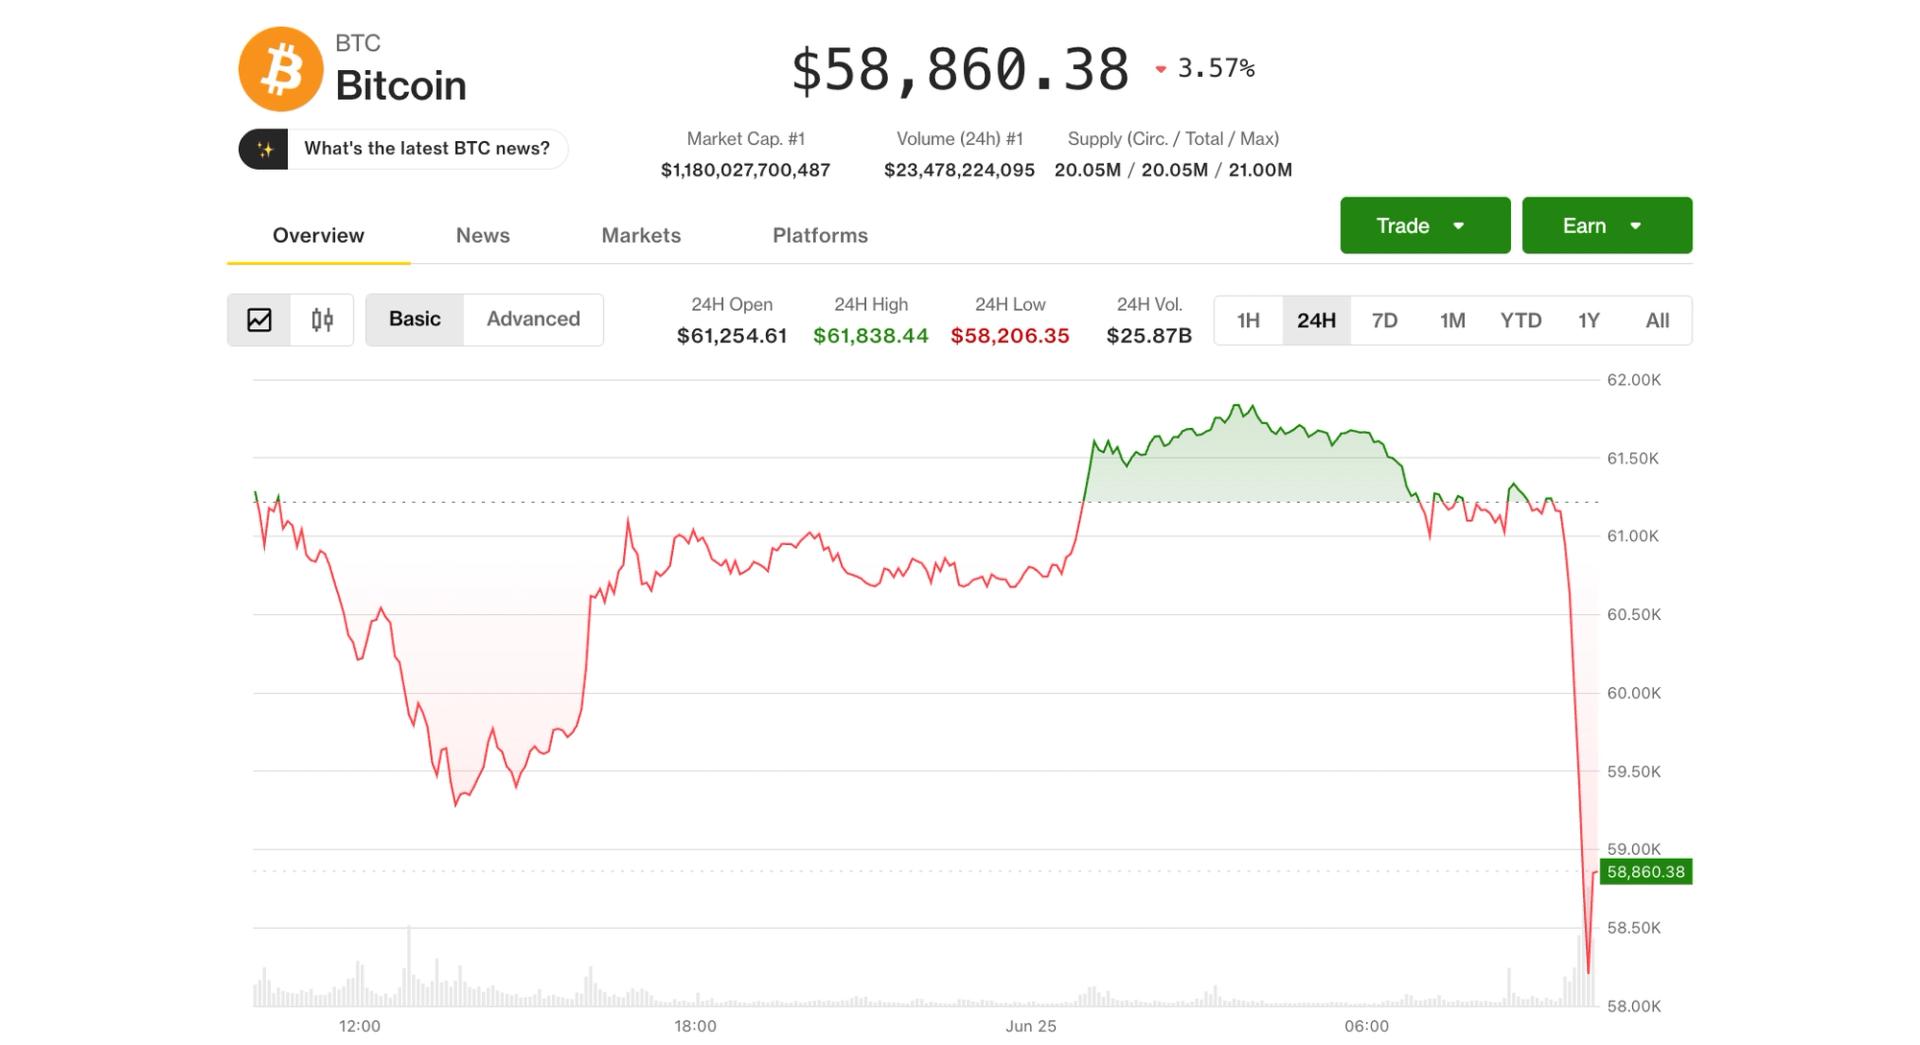
Bitcoin has slipped to around $58,000, a level that long-term power-law analyses have historically associated with major cycle lows. While the data stops short of confirming a precise “bottom,” several widely referenced support and quantile signals suggest BTC is trading in a statistically familiar drawdown zone rather than clearly breaking from its long-run behavior.
Derivatives pricing and liquidation maps add another layer to the picture. Traders are watching $55,000 for the next support magnet, while the $65,000–$68,000 area is emerging as a major upside liquidity pocket if downside momentum fades.
Key takeaways
- Power-law modeling cited by analyst Giovanni places BTC’s long-term trend near ~$135,000, putting $58,000 about 54% below the trend and within a historically “cycle-low-like” deviation band.
- The same framework points to a near-$68,000 “-1σ” support estimate, with a stronger long-run floor closer to ~$55,000.
- On the derivatives side, liquidation clustering shows roughly $4B of shorts near $65,000 versus about $1B below $55,000, implying a potential relief rally could run into $65,000–$68,000.
- Technical read-throughs hinge on whether BTC can reclaim $60,000 on a daily basis; a daily close above it would help preserve bullish RSI divergence across multiple time frames.
- Realized price levels near $54,000–$55,000 are highlighted as another historically reliable bear-market support zone going back to prior cycle bottoms.
Why $58,000 is getting attention from power-law models
The market’s latest move is being interpreted through a long-running statistical lens: power-law models designed to map Bitcoin’s historical trend and the distribution of deviations over multiple cycles.
According to Giovanni’s Bitcoin power-law model, the network’s long-term trend price sits near $135,000. With BTC at roughly $58,000, the drawdown is about 54% from the all-time high reference point used in the model’s framework and roughly 1.22 standard deviations below the estimated trend.
The key point for cycle context is that Giovanni’s model suggests past bear-market lows—in 2012, 2015, 2019, 2020, and 2022—arrived within a similar statistical range. In that view, the current decline fits a pattern consistent with prior deep lows rather than an abrupt break from Bitcoin’s longer-term growth path.
Support bands: $68,000 as a checkpoint, $55,000 as the bigger line
Giovanni’s estimates place a commonly referenced “-1σ” support zone near $68,000. However, the analyst also emphasizes that a more meaningful historical floor appears closer to $55,000. Importantly, Giovanni also noted that the power-law model would only be considered invalid if BTC traded below approximately $17,000 for more than a year—an assumption that, in the present context, remains far from being tested.
A second statistical metric referenced alongside the model also points toward “rarely seen” valuation. Bitcoin’s power-law quantile is cited at 6.2%, which implies the asset is cheaper than roughly 94% of its historical observations measured against the power-law trend. The article ties that pattern to earlier cycle lows, including 2015, 2020, and 2023, suggesting BTC has returned to a historically uncommon valuation band.
Investors should treat these signals as scenario probabilities rather than guarantees. Power-law work can indicate where markets often bottom, but it does not automatically confirm that a cycle bottom has already been printed—especially when short-term liquidity conditions and technical structure are still evolving.
Liquidations, $60,000 reclaim, and where the next liquidity sits
While the long-term math draws a wide “cycle-low” envelope, the near-term tape is being shaped by derivatives positioning. BTC reportedly printed a new yearly low near $58,000 after aggressive selling swept through Binance, according to taker sell volume metrics cited from CryptoQuant.
The flush included an hourly taker sell volume of about $2.1 billion, followed by another $1.9 billion in the next hour after the New York market open—described as Binance’s largest hourly sell pressure since May 4. Following that liquidation event, the move is said to have cleared more than $300 million in long BTC positions before price rebounded toward $60,000.
That $60,000 level is now central to the short-term technical narrative. A daily close back above $60,000 is described as preserving developing bullish RSI divergence across one-hour, four-hour, and daily time frames—an indication that selling momentum may be weakening even as price continues to mark lower lows.
Futures trader Byzantine General offered a related interpretation on social media: the drop to $58,000 allegedly cleared out leveraged longs while attracting fresh short selling. In his view, a daily close above $60,000 would strengthen the argument that a local bottom has been set for now.
Betting the range: upside liquidity near $65,000–$68,000 vs. the $55,000 floor
Derivatives positioning also highlights an asymmetry in where forced buying could emerge in a rebound. The liquidation map described the concentration of short liquidations near $65,000 at more than $4 billion, compared with roughly $1 billion below $55,000—creating a reported four-to-one imbalance. In practice, that means a relief rally might find additional fuel as shorts are forced to cover into rising prices.
Traders are also watching internal liquidity near $68,000, which the article links to a “daily fair-value gap” area of interest. The implication is that if BTC can recover from the current zone, upside pathways may be supported not only by technical recovery but also by derivative settlement dynamics.
On the other hand, a daily close below $60,000 would reinforce a bearish read across both short-term and longer-horizon charts. In that case, attention would likely shift back toward the $55,000 area—where multiple value frameworks converge.
The article adds another support argument by pointing to Bitcoin’s realized price. Realized price, which tracks the average cost basis of onchain coins, is described as having historically provided support at major Bitcoin bear-market bottoms since 2014. That historical relationship is used to frame the $54,000–$55,000 region as a key level to monitor if selling pressure continues.
For now, the market’s next decision point looks tied to whether BTC can hold and reclaim $60,000 on a daily basis; that would keep the door open for a move into the $65,000–$68,000 liquidity pocket. If it fails, the focus likely returns to the $55,000 and $54,000–$55,000 realized-price convergence, where historical cycle behavior suggests the most important support test may be underway.

Strategy’s options market has remained below historical crisis levels even as defensive Bitcoin positioning has climbed into the top fifth of historical readings, according to new research from Anchorage Digital.
Summary
- Anchorage Digital says Strategy’s options market is not signaling a severe crisis despite elevated downside hedging.
- Bitcoin and IBIT options show strong demand for protection, with put skew near historical highs.
- Legal scrutiny, insider share sales, and stock weakness have increased pressure on Strategy, but options traders are not pricing forced deleveraging.
According to a June 25 report by Anchorage Digital head of research David Lawant, traders across Bitcoin options, BlackRock’s iShares Bitcoin Trust (IBIT), and Strategy (MSTR) continue to pay a premium for downside protection, yet Strategy’s options market is not signaling fears of a severe company-specific breakdown.
The research examined options activity on Deribit alongside IBIT and MSTR, arguing that the combination offers a more complete picture of sentiment across crypto-native participants, institutions, and retail investors than any single market on its own.
The Put skew remained elevated in both Deribit and IBIT options, indicating that investors have preferred hedging against losses instead of chasing additional upside. According to the report, defensive positioning ranked in the 82nd percentile of IBIT’s history and the 84th percentile of Deribit’s five-year record.
Lawant also found that Bitcoin options have spent nearly half of 2026 pricing one-week implied volatility above one-month implied volatility. The report attributed the unusual pattern to repeated macroeconomic events, geopolitical developments, and crypto-specific catalysts that have kept traders focused on immediate uncertainty.
Lawant wrote that a return to one-month implied volatility trading above one-week levels would suggest investors are becoming more comfortable looking beyond current risks.
Strategy options remain below historical stress levels
Although Strategy has come under growing pressure in recent weeks, Anchorage Digital said its options market has not reached the conditions that accompanied previous periods of severe market stress.
According to the report, traders continue to buy downside protection, but put skew has not climbed to levels that typically signal expectations of forced deleveraging or a broader crisis surrounding the company.
The assessment comes as Strategy’s capital structure has faced fresh strain. The company’s perpetual preferred stock, STRC, dropped to $82.53 on June 22, about 17% below its $100 par value, before recovering after Strategy disclosed that it had increased its fiat reserves to $1.3 billion. By Thursday, STRC was trading near $75, leaving it roughly 25% below par.
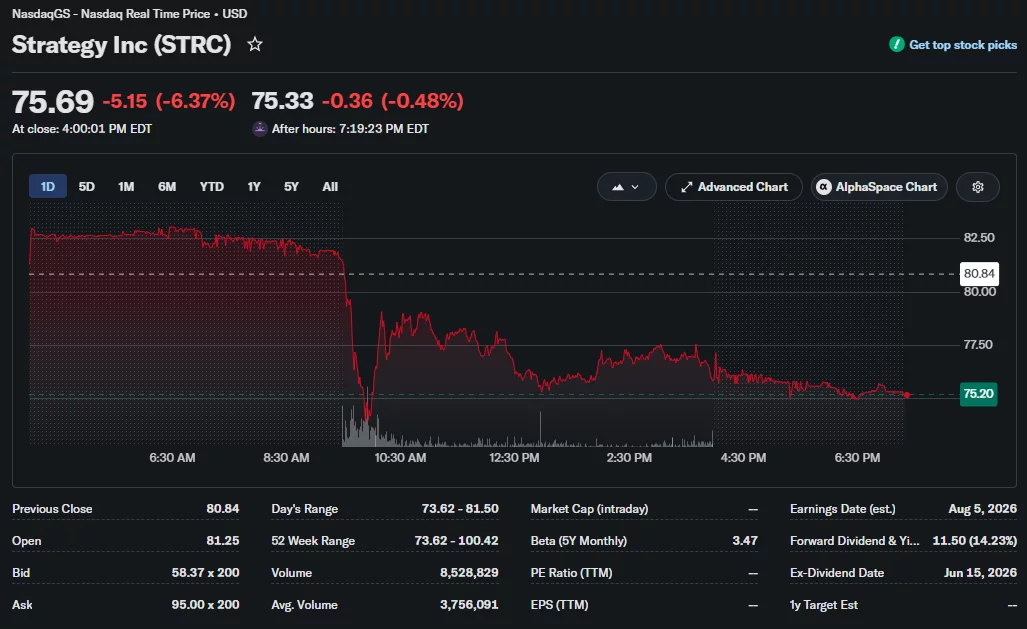
Pressure has also spread to the company’s common stock. Yahoo Finance data showed MSTR shares were trading around $85 on Thursday after falling about 78% over the past year and reaching a fresh 52-week low.
Legal scrutiny has intensified alongside stock weakness
Outside the options market, Strategy has encountered increasing legal and investor scrutiny.
Rosen Law Firm recently announced that it is investigating whether the company made materially inaccurate business disclosures. The firm said it is evaluating potential securities claims and considering a possible class action on behalf of shareholders who suffered losses.
The investigation followed public comments from Bitcoin critic Peter Schiff, who argued that investors in Strategy’s STRC preferred shares could have legal grounds to pursue claims if they purchased the security based on Michael Saylor’s promotion of the company’s Bitcoin treasury strategy. Schiff made those remarks before any law firm publicly disclosed an investigation into potential shareholder claims.
Adding to investor attention, Strategy director Jarrod Patten recently sold another 1,500 MSTR shares as the stock continued its decline.
Despite those developments, Anchorage Digital’s analysis indicates that options traders are preparing for additional volatility rather than pricing in a severe breakdown.
Strategy, led by Executive Chairman Michael Saylor, remains the world’s largest corporate holder of Bitcoin with 847,363 BTC on its balance sheet after pioneering the corporate Bitcoin treasury model in 2020.
Mark Zuckerberg Meta AI just built a 2026 predicts for XRP price prediction that reads less like a single number and more like three different doors that could all open at once.
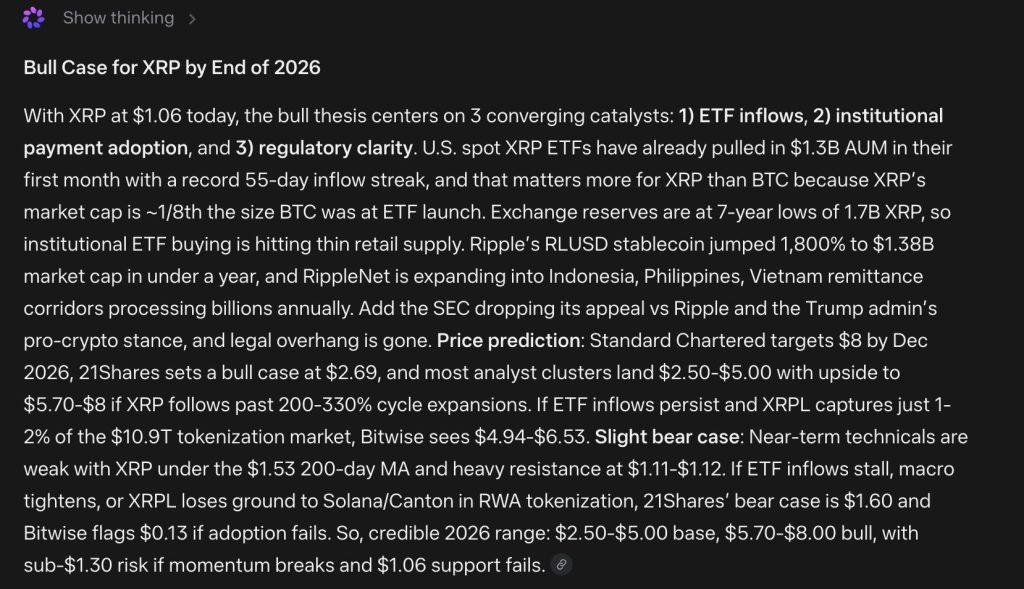
The model lands on a base range of $2.50 to $5.00, with a bull case stretching to $5.70 or even $8.00 if everything breaks the right way.
The bull case rests on three catalysts converging together rather than any single headline. XRP sits near $1.06 today, and the thesis starts with ETF inflows, since US spot XRP ETFs already pulled in 1.3 billion dollars in assets under management in their very first month, backed by a record 55-day inflow streak.
That matters more for XRP than it did for bitcoin, since XRP’s market cap is roughly one-eighth the size bitcoin was at when its own ETFs launched, meaning the same dollar inflow has a much bigger relative impact here.

Exchange reserves are also sitting at seven-year lows near 1.7 billion XRP, so institutional ETF buying is running into thin retail supply, which tends to amplify price moves. On the institutional payment side, Ripple’s RLUSD stablecoin jumped 1800% to a $ 1.38 billion market cap in under a year, while RippleNet continues to expand into remittance corridors across Indonesia, the Philippines, and Vietnam that process billions annually.
Add regulatory clarity to the mix: with the SEC dropping its appeal against Ripple and the Trump administration maintaining a pro-crypto stance, the legal overhang that weighed on XRP for years is essentially gone.
Wall Street price targets reflect that optimism too, with Standard Chartered calling for $8 by December 2026 and 21Shares setting a bull case at $2.69, while Bitwise sees $4.94 to $6.53 if XRPL captures just 1% to 2% of the 10.9 trillion dollar tokenization market.
The bear case is sharper than usual here. Near-term technicals are genuinely weak, with XRP trading under its $1.53 200 day moving average and running into heavy resistance at $1.11 to $1.12. If ETF inflows stall out, macro conditions tighten, or XRPL keeps losing ground to competitors like Solana or Canton in real-world asset tokenization, 21Shares puts its bear case at $1.60, while Bitwise flags a much grimmer $0.13 if adoption simply fails to materialize.
Momentum breaking down and the $1.06 support level failing would open the door to that kind of outcome.
XRP Price Prediction: Sits Below Its Own Ceiling Waiting For A Reason To Climb
The weekly chart shows XRP at $1.07009 after a long, steady decline from highs above $3.65 set back in mid 2025. That drop has been one of the more relentless downtrends in this entire series, with very few real bounces interrupting the slide.
The 200-day moving average mentioned in the prediction sits at $1.53, which is a long way above the current price and underscores just how far XRP has fallen below its own longer-term trend.
Resistance sits first at $1.11 to $1.12, the exact zone flagged as the immediate ceiling holding price down right now, then a heavier wall further up near $1.60 where multiple rejections have piled up historically.
Support is harder to define on pure price structure alone, but the current $1.06 level marked on this candle lines up directly with the support level called out as the line in the sand for the bear case. The chart shows a clean series of lower highs and lower lows for almost a full year, which is about as textbook a downtrend as it gets.
Momentum on the candles themselves looks weak, with red weeks dominating the recent stretch and very little follow through buying on the occasional green candle.
Overall, this chart looks like an asset still searching for a bottom rather than building toward a breakout. If XRP can reclaim that $1.11 to $1.12 resistance zone and eventually fight back above its 200 day average, the kind of catalyst driven move Meta AI is describing finally has a technical foundation to build on instead of just a fundamental story sitting on top of a weak chart.
LiquidChain May Be The XRP of This Cycle, Here is Why Retail & Meta AI Predicts Loving It
When market leaders stall, smart money looks elsewhere.
BTC, ETH, and XRP are all grinding under resistance. The catalysts that unlock the next leg, macro relief and institutional inflows, have not arrived. Waiting on them means waiting on things you cannot control.
Early-stage infrastructure plays exist in a different universe entirely. The upside is not priced in yet, which means a relatively small amount of capital can move the needle significantly.
LiquidChain is solving exactly that problem. Bitcoin, Ethereum, and Solana liquidity currently sits in isolated silos, costing users money and time on every cross-chain move. LiquidChain collapses all 3 into a single execution layer. Developers deploy once. Users move across ecosystems without ever feeling the seams.
The presale sits at $0.01454 with just over $850,000 raised. Ground floor, not a late entry.
Adoption, liquidity depth, and execution are all unproven. That risk is real. The question is whether the potential justifies it.
Established assets offer a smoother ride toward a ceiling that is already visible. LiquidChain offers an earlier seat at a table that has not been set yet.
Explore the LiquidChain Presale
The post Mark Zuckerberg Meta AI Predicts Eye-Opening XRP Price by End of 2026 appeared first on Cryptonews.


A CoinShares survey has found that 52% of UK financial advisers cannot see most of their clients’ cryptocurrency holdings because of firm-level restrictions.
Summary
- CoinShares found that 52% of UK financial advisers cannot see most of their clients’ crypto holdings.
- The survey says firm policies, not investor demand, are the main barrier to crypto oversight.
- Ripple executives and regulators point to growing crypto payment use and tighter oversight of digital assets.
According to a survey released by digital asset investment firm CoinShares on Thursday, more than half of UK financial advisers say most of their clients’ cryptocurrency holdings sit outside their view, even as digital assets become more common in investment portfolios.
The survey covered 261 wealth management professionals across Europe and found that 52% of advisers in the UK said the majority of their clients’ crypto exposure was effectively “invisible” to them.
Across the wider group of countries surveyed, including France, Germany, Italy, and Switzerland, the figure fell to 25%. CoinShares also found that 61% of respondents worked at firms that either restricted digital assets or had no clear internal policy on handling them.
Firm policies are limiting adviser visibility
Commenting on the findings, CoinShares co-founder and CEO Jean-Marie Mognetti argued that internal company rules, rather than investor demand or adviser knowledge, are preventing wealth managers from understanding their clients’ complete financial positions.
According to Mognetti, clients have already committed capital to digital assets, but advisers often cannot factor those holdings into portfolio management because firm policies stop them from discussing or overseeing them. He said this creates what he described as a “wrong-way risk,” where advisers are expected to manage wealth without access to a complete picture of client assets.
Mognetti also argued that advisers cannot properly allocate investments, manage risk, or build trust unless they first have visibility into those digital asset holdings.
“The capital has already been allocated. The people entrusted with managing it simply cannot see it, and in most cases not because clients are unwilling to engage, but because firm policy prevents them from doing so. This is not a knowledge problem. It is not a demand problem. It is a firm-policy problem becoming a wrong-way risk.”
The findings arrive as crypto ownership continues to grow in the UK. According to the UK’s Financial Conduct Authority, around 8% of adults in the country owned cryptocurrency as of its December report.
More recently, the regulator proposed allowing authorized investment funds to allocate up to 10% of their assets to cryptocurrency exchange-traded notes, signalling continued regulatory engagement with the sector.
Payment infrastructure is expanding alongside regulation
The survey comes as industry executives continue to argue that crypto’s next stage of adoption will be driven by payments rather than speculation.
As previously reported by crypto.news, Ripple executive Reece Merrick compared today’s crypto payments market with the early years of e-commerce, when online shopping represented only a small share of retail activity despite the underlying technology already being developed.
Merrick said improvements such as secure payment gateways, wider internet access, and smartphones eventually made e-commerce part of everyday life, and he believes scalable blockchains, stablecoins, regulated fiat on-ramps, and user-friendly wallets now play a similar role in crypto payments.
Separately, crypto.news previously reported that Ripple CEO Brad Garlinghouse said stablecoins are increasingly attracting interest from corporate finance teams and treasury departments evaluating blockchain-based payment systems and treasury management.
Regulators are also paying closer attention to how crypto transactions move through financial markets. In India, the Financial Intelligence Unit has asked at least three major cryptocurrency exchanges to provide records of over-the-counter crypto transactions exceeding $10,000, with the request covering data that exchanges must preserve from January 2026 onward.
The directive focuses on private OTC trades, which allow large transactions to avoid public order books but can make beneficial ownership harder to verify when intermediaries or closely held entities stand between exchanges and the original source of funds.

Saylor’s Bitcoin Flywheel Is Now Spinning in Reverse
Father-Daughter Moment With Jay-Z Has Fans Debating

Bike rider seriously injured after Hartlepool crash


-

 Fashion6 days ago
Weekend Open Thread: Miami – Corporette.com
-

 Entertainment5 days ago
Renter of Home in Anne Heche Crash Denies Settlement With Son
-
 Sports2 days ago
Two goals and an assist by sheer aura: Cristiano Ronaldo just entered the World Cup chat
-

 Tech4 days ago
Microsoft accidentally kills epic Outlook email threads
-

 Business5 days ago
Soccer-U.S. defends Iran World Cup travel restrictions, says discussions ongoing
-

 Politics6 days ago
Andy Burnham and the meaning of Makerfield
-

 NewsBeat6 days ago
Keir Starmer Allies Question His Chances For No 10
-

 Tech5 hours ago
A Look At A Gaggle Of Transputer Boards
-
Crypto World2 days ago
Bitcoin (BTC) Dips Below $62K, Ethereum (ETH) Plunges 6% Daily: Market Watch
-

 Crypto World2 days ago
Securitize Wraps Roubini's SEC-Registered ETF as Dubai VARA Digital Security
-
Business2 days ago
Entergy settles forward sale agreements, raises $672 million in cash proceeds
-
 Business6 days ago
Wall Street Week Ahead: Investors see Micron earnings as pulse check of AI rally momentum
-
 Crypto World6 days ago
Can Charles Hoskinson Really Rescue Cardano?
-

 Crypto World6 days ago
HIVE shares jump as $220M AI deal speeds Bitcoin mining pivot
-

 Crypto World6 days ago
Jake Chervinsky accuses CME of protecting derivatives monopoly
-

 Entertainment6 days ago
Jose Alvarado Wants Taylor Swift at More Knicks Games
-
 Tech4 days ago
Signal’s Meredith Whittaker says AI chatbots ‘are not your friends’ and calls Copilot agents a backdoor
-

 Sports11 hours ago
India vs Bangladesh LIVE Score, Women’s T20 World Cup: Bangladesh Opt To Bat; India Enter ‘Do-Or-Die’ Stage As Semi-Final Race Heats Up
-

 Tech3 days ago
Nearly 7,000 fake Amazon domains registered ahead of Prime Day 2026, researchers warn
-

 Sports7 days ago
FIFA World Cup 2026: Canada beat 9-men Qatar 6-0 to register first ever win | FIFA World Cup 2026
You must be logged in to post a comment Login