
Crypto World
Bitcoin and XRP Head for Strongest Weekly Close Since 2024: What’s Next?

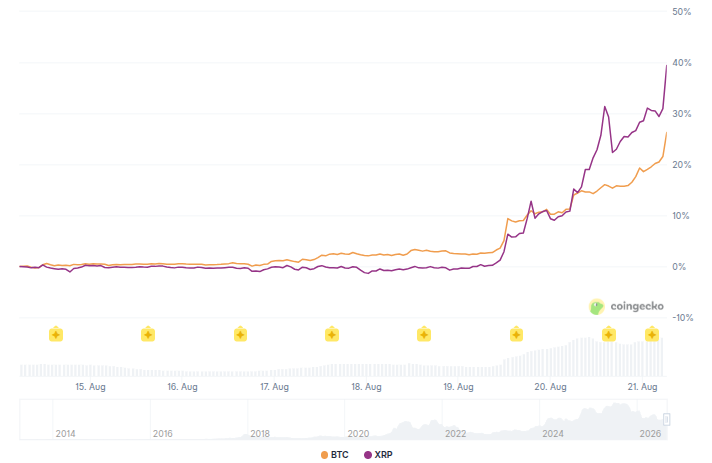
Bitcoin and XRP are surging toward their strongest weekly closes since 2024, powered by a historic short squeeze and a wave of supportive policy signals from Washington.
On-chain data now adds another layer, hinting this rally could mark more than a temporary bounce.

Bitcoin and XRP Surge as On-Chain Data Flashes a Rare Bottom Signal
The MVRV ratio compares Bitcoin’s current market value to its realized value, the average price at which coins last moved. Sharp vertical rises in this metric have historically preceded major cycle bottoms.
Bitcoin trades above $79,000, up roughly 25% over the past seven days and more than 13% in the last 24 hours, according to BeInCrypto data. Analysts called this the biggest weekly gain since February 2024, adding approximately $280 billion to market capitalization in under five days.
CryptoQuant analyst Crypto Dan flagged the MVRV signal as notable. He described the rebound as the first powerful signal in this bear cycle, echoing patterns seen at the end of previous downcycles.
“Bitcoin’s recent rebound is a signal that has emerged for the first time in this Bear cycle. The MVRV indicator, which measures Bitcoin’s present valuation, is showing a vertical rise. This signal is the very movement that appeared as the bottom range came to an end in every past downcycle. suggesting that the possibility of the market turning from decline to ascent is growing,” Crypto Dan said. Bitcoin (BTC).
Follow us on X to get the latest news as it happens.

XRP outperformed even more dramatically. The token changed hands near $1.40, up about 31% on the week and more than 18% for the day, after hovering near or below $1 just days earlier. Analysts called this XRP’s strongest week since November 2024.
A historic short squeeze drove most of the move. Billions in leveraged bearish positions were liquidated as prices broke higher, forcing sellers to buy back coins and accelerating the rally.
The US Treasury doubled long-term bond buybacks, while President Trump voiced support for the CLARITY Act at a White House meeting.

What Comes Next for Bitcoin and XRP?
Technical analysts are watching key levels closely. Trader Ted pointed to Bitcoin’s powerful weekly candle, which has smashed through multiple resistance zones.
The next major test lies between $78,000 and $80,000, and a successful reclaim could signal the end of the bearish structure that has dominated since late 2025.
For XRP, analyst ChartNerdTA emphasizes the weekly 20 and 50 EMAs, which are currently trading between roughly $1.20 and $1.50.
A sustained reclaim of those moving averages would mark a genuine macro bullish shift, while failure to hold above them could trigger consolidation or a deeper pullback toward longer-term support.
The short-term momentum looks undeniable, though the market remains volatile. Traders will watch whether the rally transitions from squeeze-driven gains into sustained organic demand, particularly through ETF flows and continued on-chain activity.
A healthy consolidation after such a sharp move would not be unusual and could set the stage for the next leg higher.
Both assets have reminded the market how quickly sentiment can reverse when catalysts align. The coming days will reveal whether this breakout marks the start of a durable recovery or a temporary relief rally.
Subscribe to our YouTube channel to watch leaders and journalists provide expert insights.
The post Bitcoin and XRP Head for Strongest Weekly Close Since 2024: What’s Next? appeared first on BeInCrypto.



Yesterday, an influencer pretended to suffer a $6 million short liquidation on bitcoin (BTC) to attract followers and clout. The stunt fizzled after some basic fact-checking.
Crypto trader Laanie posted fake evidence of a leveraged wipeout long enough to attract a few hundred thousand views, then deleted the claim a few hours later.
The engagement farmer then hosted a social audio space on X to discuss the non-existent trade, which attracted over a thousand attendees amidst a particularly bullish day for crypto markets.
Indeed, BTC was enjoying one of its steepest, single day gains of the year, rallying from $64,000 to $75,000 in under 24 hours.
A proposed Community Note on X challenged the $6 million loss. It explained that the trading display Laanie shared had Bybit’s Demo mode enabled, a subtle yet unmistakable label for the crypto exchange’s simulated trading view.
One skeptic explained the difference between a real Bybit trading account and Laanie’s paper money account. Another trader noted that Laanie’s screenshots cropped out the webpage tab, indicating their use of Bybit’s Demo mode.
The intraday, 17% rally in BTC made the claim plausible at first glance, especially due to Bybit’s large leverage offerings that would have amplified losses for short-sellers.
As unsophisticated observers happily engaged with the post and reposted across social media for clout, the engagement farmer won the prize of attention.
This short bitcoin liquidation never happened
Replies to Laanie’s follow-up post called the trader a LARPer, short for Live Action Role Player. Another skeptic wrote that Laanie is a “liar with a demo account.”
‘QE Lite,’ a multi-billion dollar expansion of US Treasury buybacks, plus positive BTC commentary from Donald Trump’s crypto meeting in Washington DC, drove the rally on August 19 and the dramatic follow-through yesterday.
Read more: Jim Chanos is calling for another MSTR short
Bybit’s Demo Trading feature auto-creates a simulated account for every user. Its demo mode seeds all customers with a fixed portfolio of virtual assets. Demo mode traders can adjust the funds in that account and flip to live trading with a single toggle.
A large enough leveraged position inside that sandbox produces the same liquidation math and shareable screenshot as a genuine trade. However, the underlying capital never exists, and trades never fill.
Got a tip? Send us an email securely via Protos Leaks. For more informed news and investigations, follow us on X, Bluesky, and Google News, or subscribe to our YouTube channel.


Cointelegraph is committed to providing independent, high-quality journalism across the crypto, blockchain, AI, and fintech industries.
All news, reviews, and analyses are produced with full journalistic independence and integrity. For more details on our standards and processes, please read our Editorial Policy.
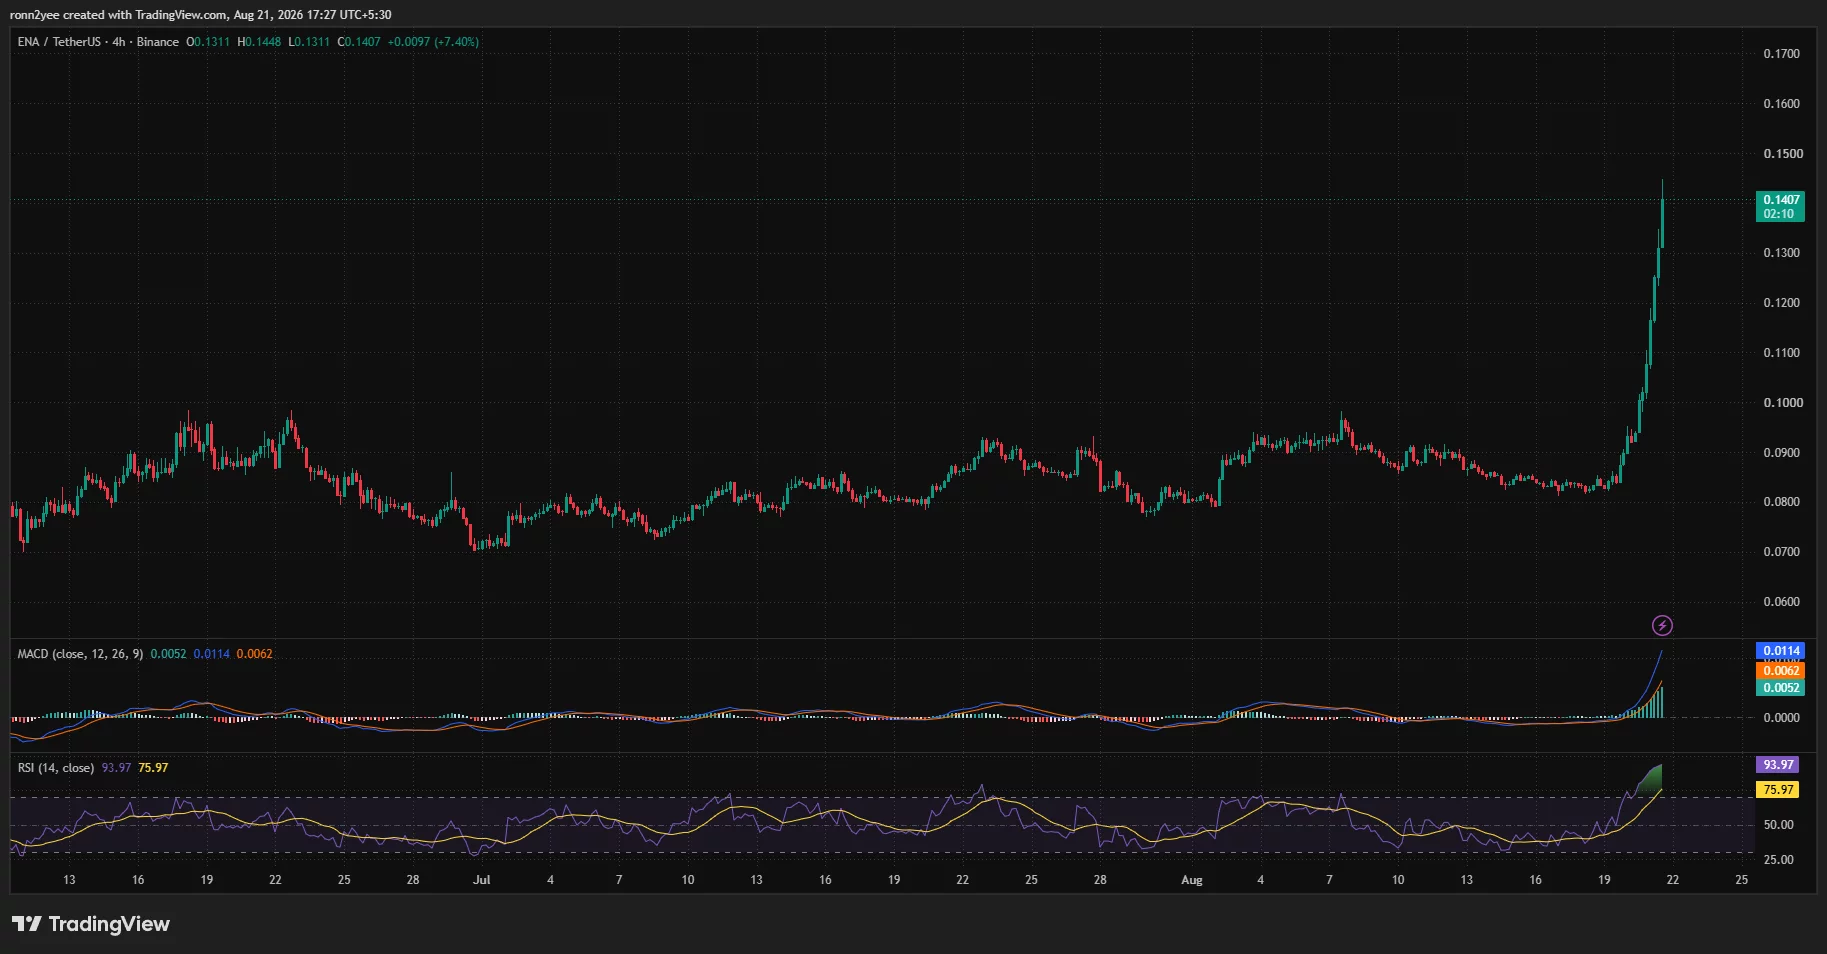
Ethena price extended its weekly gain to about 65% on Aug. 21, reaching $0.142 after a $1 billion lending deal with FalconX and bullish calls from Arthur Hayes fueled demand for ENA.
Summary
- Ethena price gained about 65% in seven days and reached an intraday high near $0.145.
- A $1 billion FalconX facility will fund overcollateralized loans using assets backing USDe.
- 4-hour RSI reached 93.97, warning that the near-vertical rally is overheated.
- A break above $0.1465 could expose $0.1587, while $0.1343 is the first support.
Ethena price action today
According to data from crypto.news, Ethena (ENA) price traded near $0.140 at press time, up about 20% on the daily chart. The token briefly reached $0.1448 after opening the session at $0.116, extending a rally that began near $0.082 on Aug. 18.
The move carried ENA through several resistance levels in less than three days. Buyers first reclaimed $0.10, which had limited previous recovery attempts, before breaking through $0.1099, $0.1221, and $0.1343.
ENA’s 4-hour chart shows that most of the advance occurred through consecutive large green candles. The token has gained more than 70% from its Aug. 18 low, leaving little consolidation between the previous trading range and its current price.
The breakout also reversed a longer period of weakness. ENA had fallen from above $0.21 at the start of 2026 and spent much of June through mid-August between $0.07 and $0.10.
What is driving the ENA rally?
The immediate catalyst was a $1 billion secured warehouse facility announced by FalconX and Ethena.
Under the arrangement, assets backing Ethena’s USDe synthetic dollar can fund overcollateralized loans to institutional borrowers. FalconX will originate and service the loans while also managing the collateral, which will be held with qualified custodians.
Ethena will hold a first-priority security interest over the assets in the lending vehicle. The structure gives the protocol another potential source of returns beyond crypto basis trades, whose yields can weaken when demand for leveraged futures positions declines.
The $1 billion figure describes the facility’s total capacity rather than confirmed capital deployed on its first day. Interest rates, eligible collateral, borrower requirements, and the initial amount drawn have not been disclosed.
Bullish commentary from BitMEX co-founder Arthur Hayes added to the momentum. Hayes wrote in an Aug. 21 X post that an “$ENA 5 bagger is just too easy,” alongside a chart pointing toward roughly $0.50.
Hayes had previously argued that stronger US dollar liquidity could lift Bitcoin, improve derivatives basis yields, and attract capital back into USDe. On-chain reports earlier in August also linked him to purchases totaling 22.64 million ENA worth about $2 million.
Trader Daan Crypto Trades separately identified $0.14 as an important level after ENA gained more than 30%.
“Could see some resistance there. If it breaks higher we’re off to the races,” the trader said in an Aug. 21 X post.
ENA has now reached that area, making its reaction around $0.14–$0.1465 central to the next move.
ENA indicators warn the rally is overheated
Momentum remains strongly bullish, although the 4-hour indicators show a growing risk of short-term profit-taking.
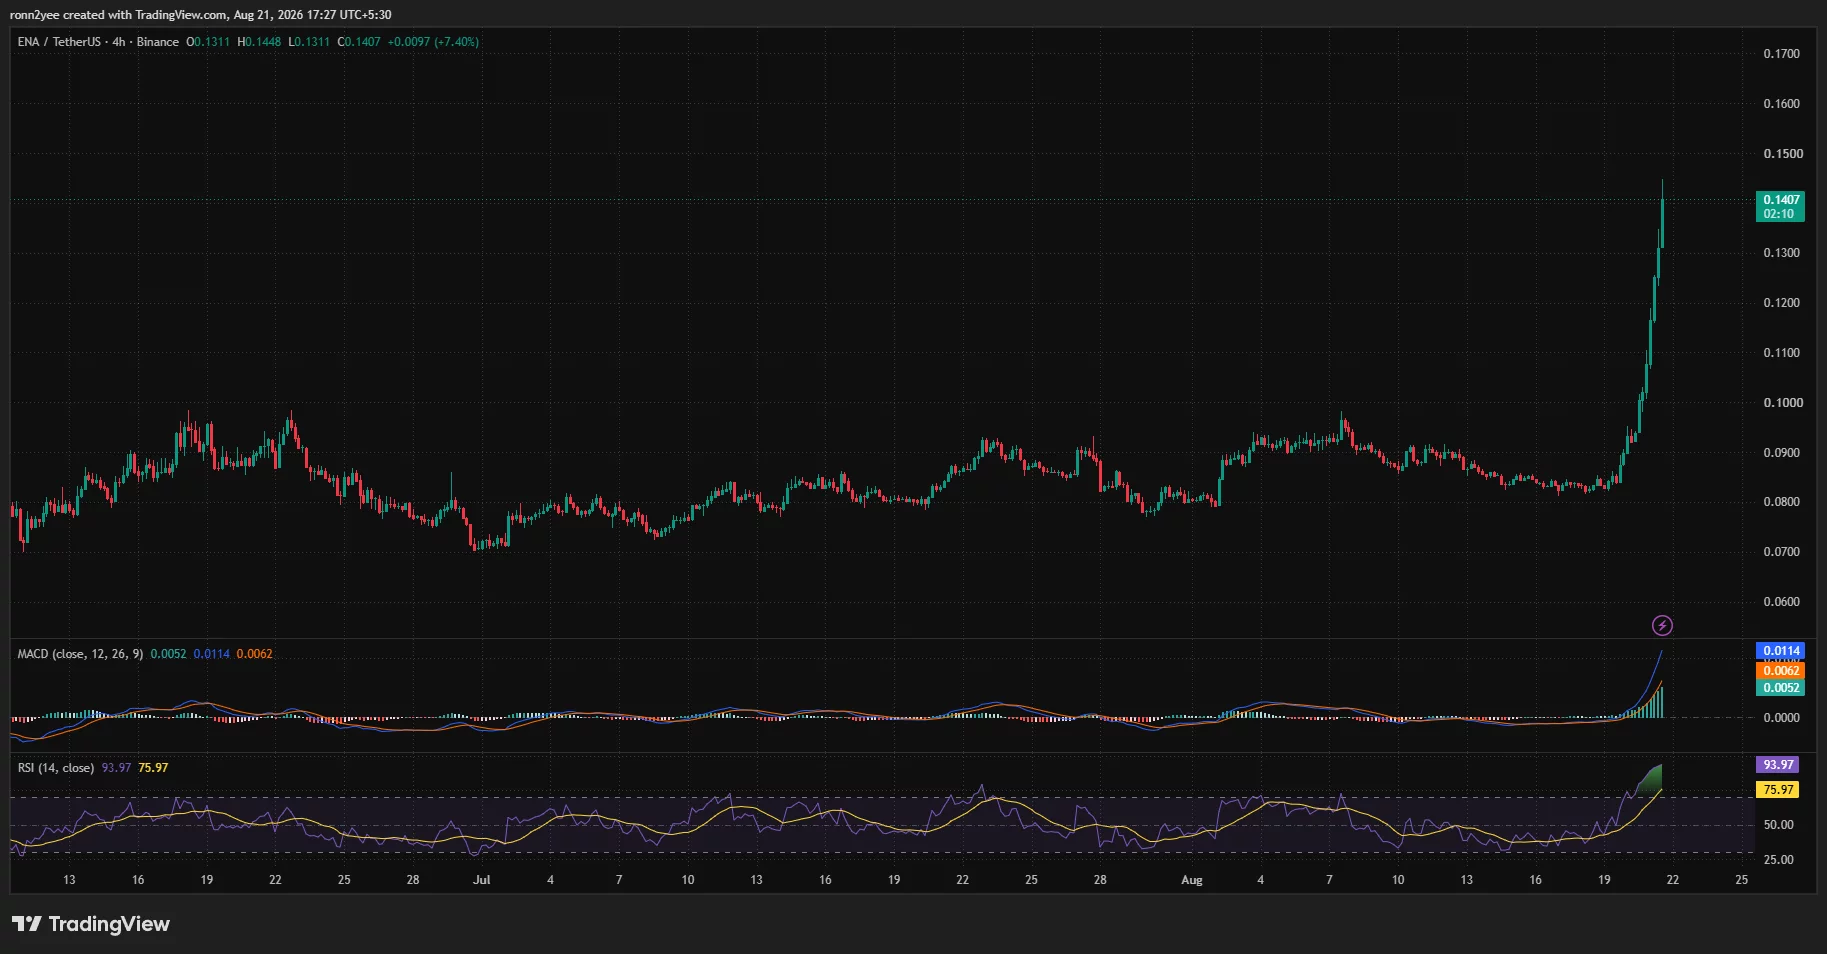
ENA’s 4-hour Relative Strength Index reached 93.97, far above the 70 level commonly associated with overbought conditions. Its RSI moving average stood at 75.97, confirming that momentum has remained elevated across several candles rather than during one brief spike.
The Moving Average Convergence Divergence indicator also supports the uptrend. The MACD line rose to 0.0114, above the 0.0062 signal line, while the positive histogram expanded to 0.0052. The widening gap shows that buying momentum was still accelerating when the chart was captured.
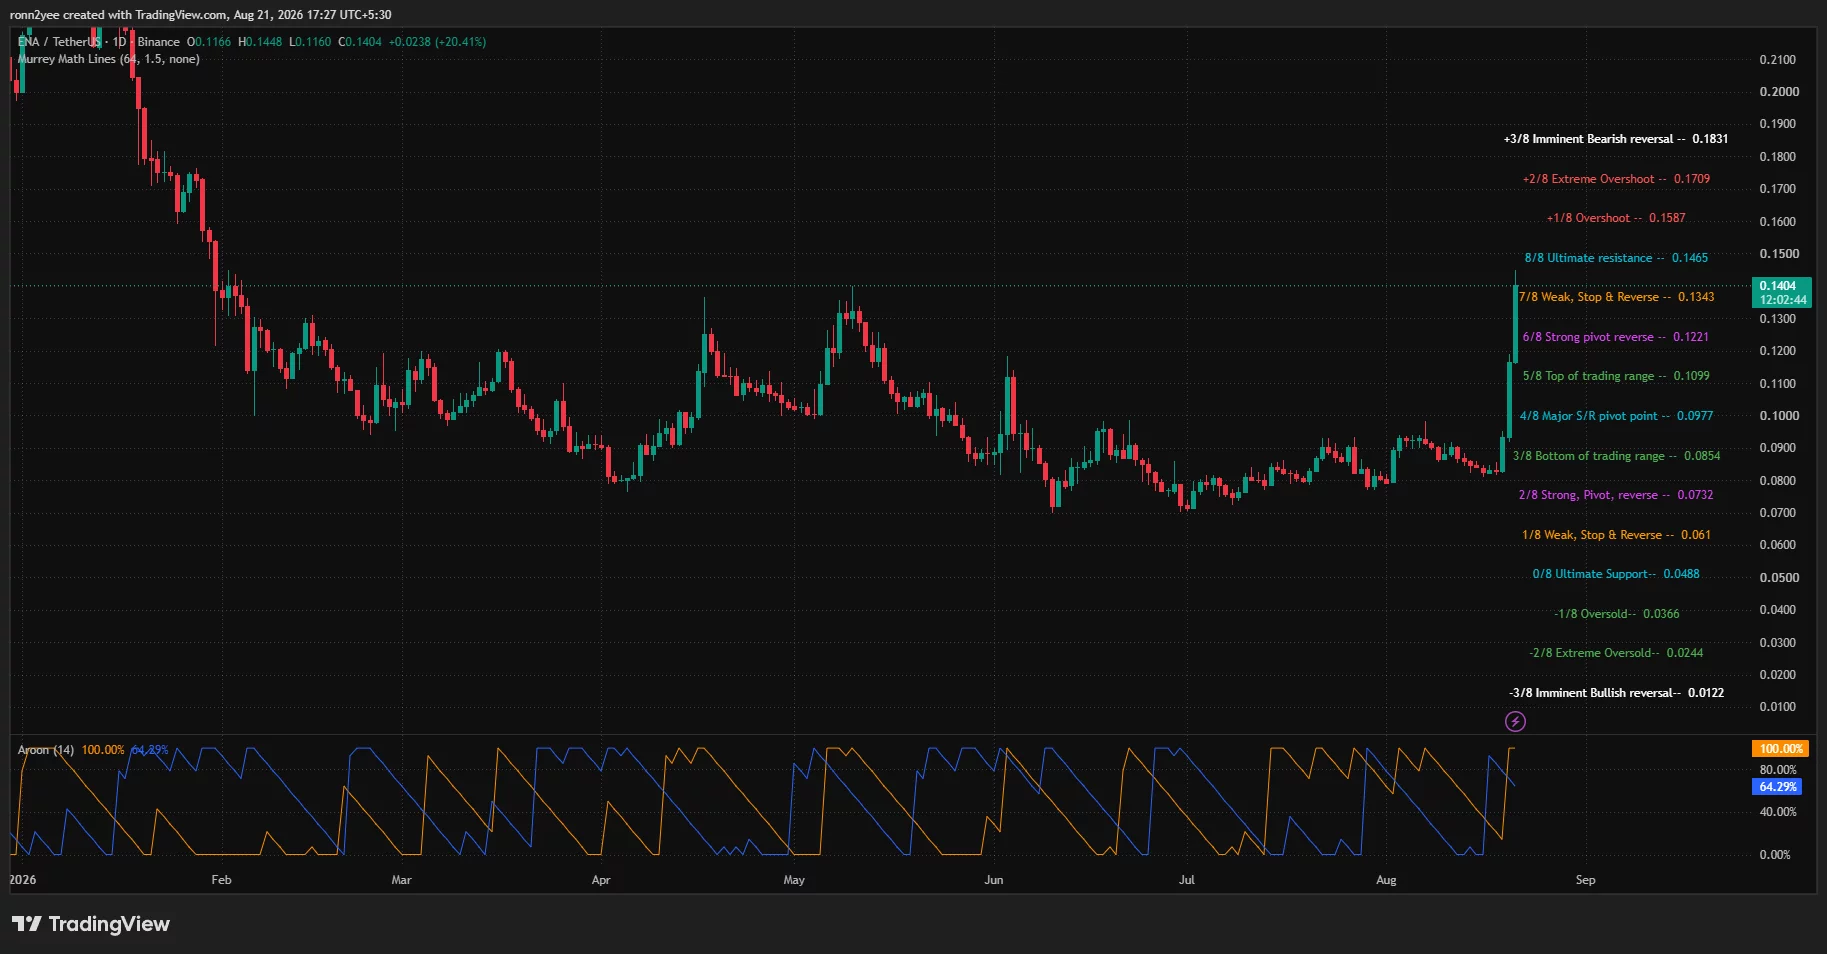
Daily Aroon readings provide another bullish signal. Aroon Up stood at 100%, consistent with ENA recording a fresh high, while Aroon Down was at 64.29%. The readings favor buyers but also reflect the speed and volatility of the reversal from ENA’s earlier lows.
Overbought readings do not guarantee an immediate decline. However, an RSI near 94 means traders entering after the vertical move face a greater risk if momentum slows or early buyers begin taking profits.
ENA price targets $0.1587 if $0.1465 breaks
The daily chart places $0.1465 at the next major resistance. ENA traded just below that level after its intraday high reached approximately $0.1448.
A daily close above $0.1465 would confirm a breakout from the current trading range. The next technical targets would be $0.1587 and $0.1709, followed by $0.1831 if momentum remains strong.
Failure to clear $0.1465 could produce a retest of $0.1343, which previously acted as a reversal level. Lower support sits at $0.1221, followed by $0.1099 and the former breakout area around $0.0977–$0.10.
CoinGlass’ three-day liquidation heatmap shows substantial leverage concentrations below the current price. The strongest nearby clusters appear around $0.118–$0.120, with additional liquidity between $0.104 and $0.116.
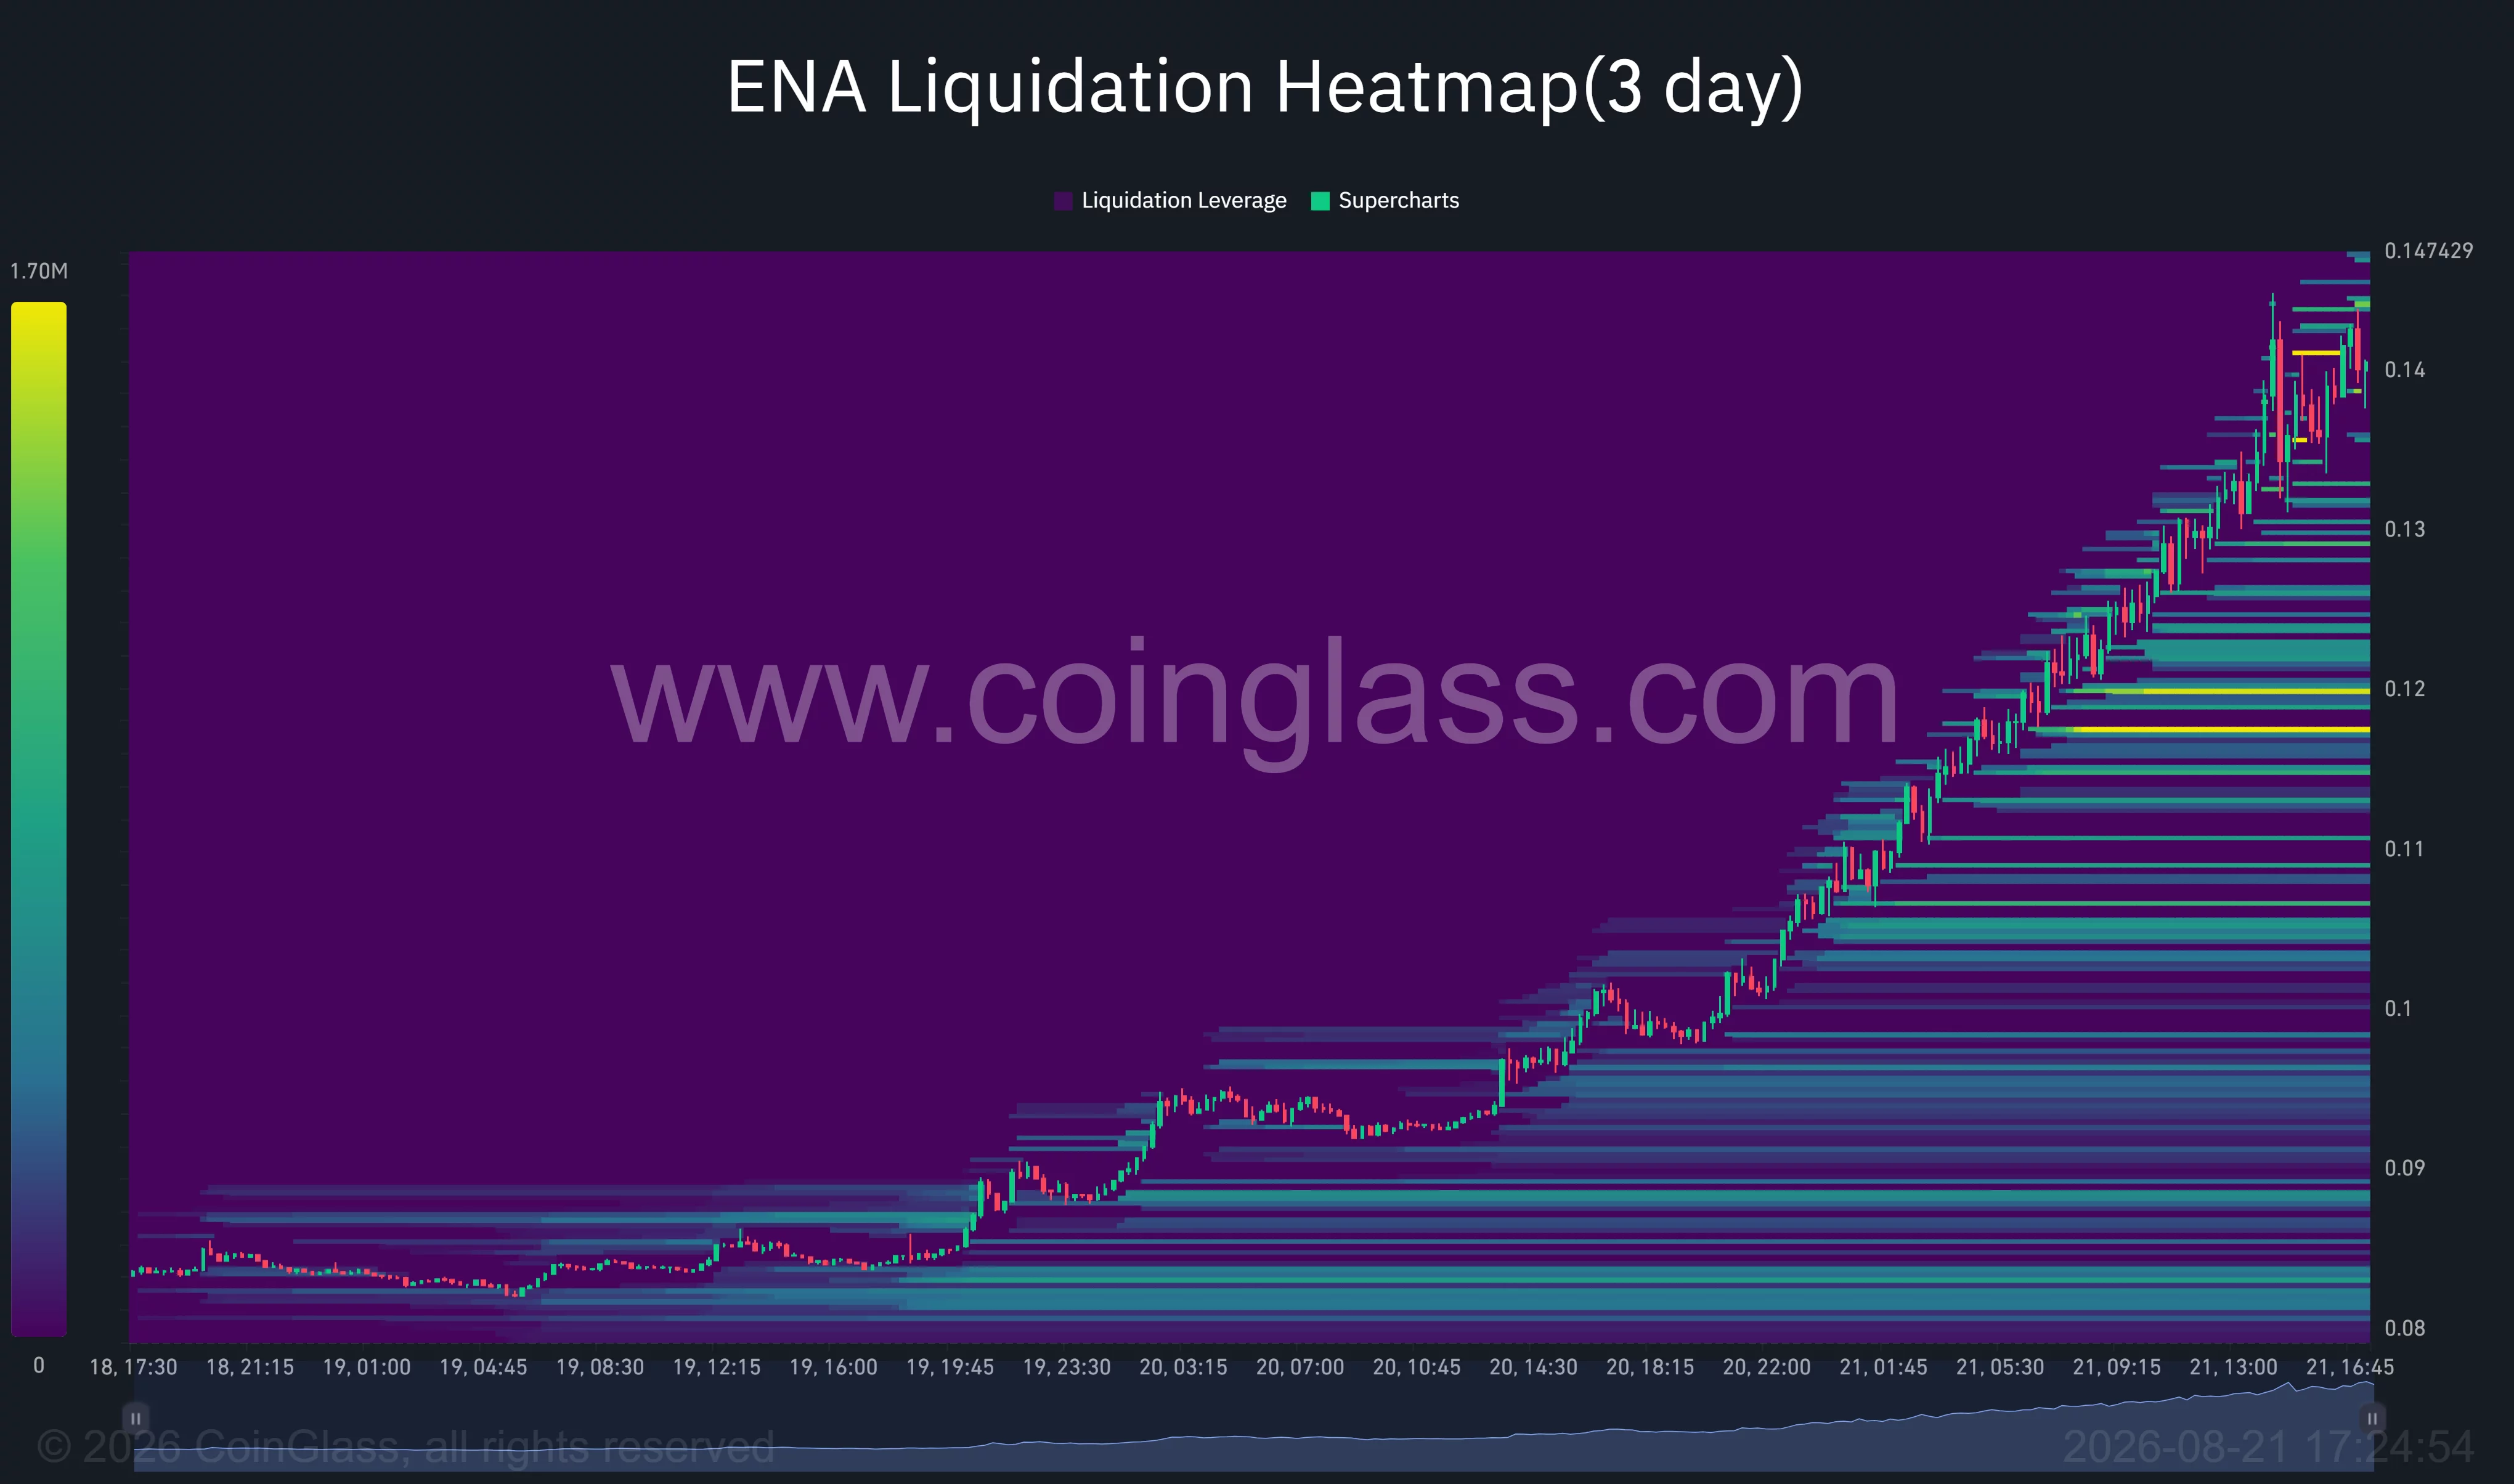
A decline through $0.1343 could therefore accelerate as leveraged long positions face pressure. Holding that level would allow ENA to consolidate without breaking the short-term bullish structure.
US market context remains tied to risk appetite
ENA’s rally has also benefited from a broader recovery across the crypto market as Bitcoin moved toward multi-month highs. Rising demand for higher-risk DeFi tokens often follows strength in Bitcoin and Ether, although such assets can also record sharper losses when market sentiment reverses.
FalconX’s US presence gives the lending agreement an institutional connection for American markets. FalconX Bravo, an affiliate of the prime broker, is registered with the Commodity Futures Trading Commission as a swap dealer focused on crypto derivatives.
The warehouse facility does not remove the risks attached to USDe or ENA. Borrower defaults, collateral declines, custody arrangements, smart-contract exposure, changing derivatives yields, and future token unlocks could still affect the protocol and its governance token.
For now, ENA’s breakout remains intact above $0.1343. A close above $0.1465 would support another leg toward $0.1587, while a rejection combined with the extreme RSI reading would raise the probability of a pullback toward $0.1221.
Disclosure: This article does not represent investment advice. The content and materials featured on this page are for educational purposes only.
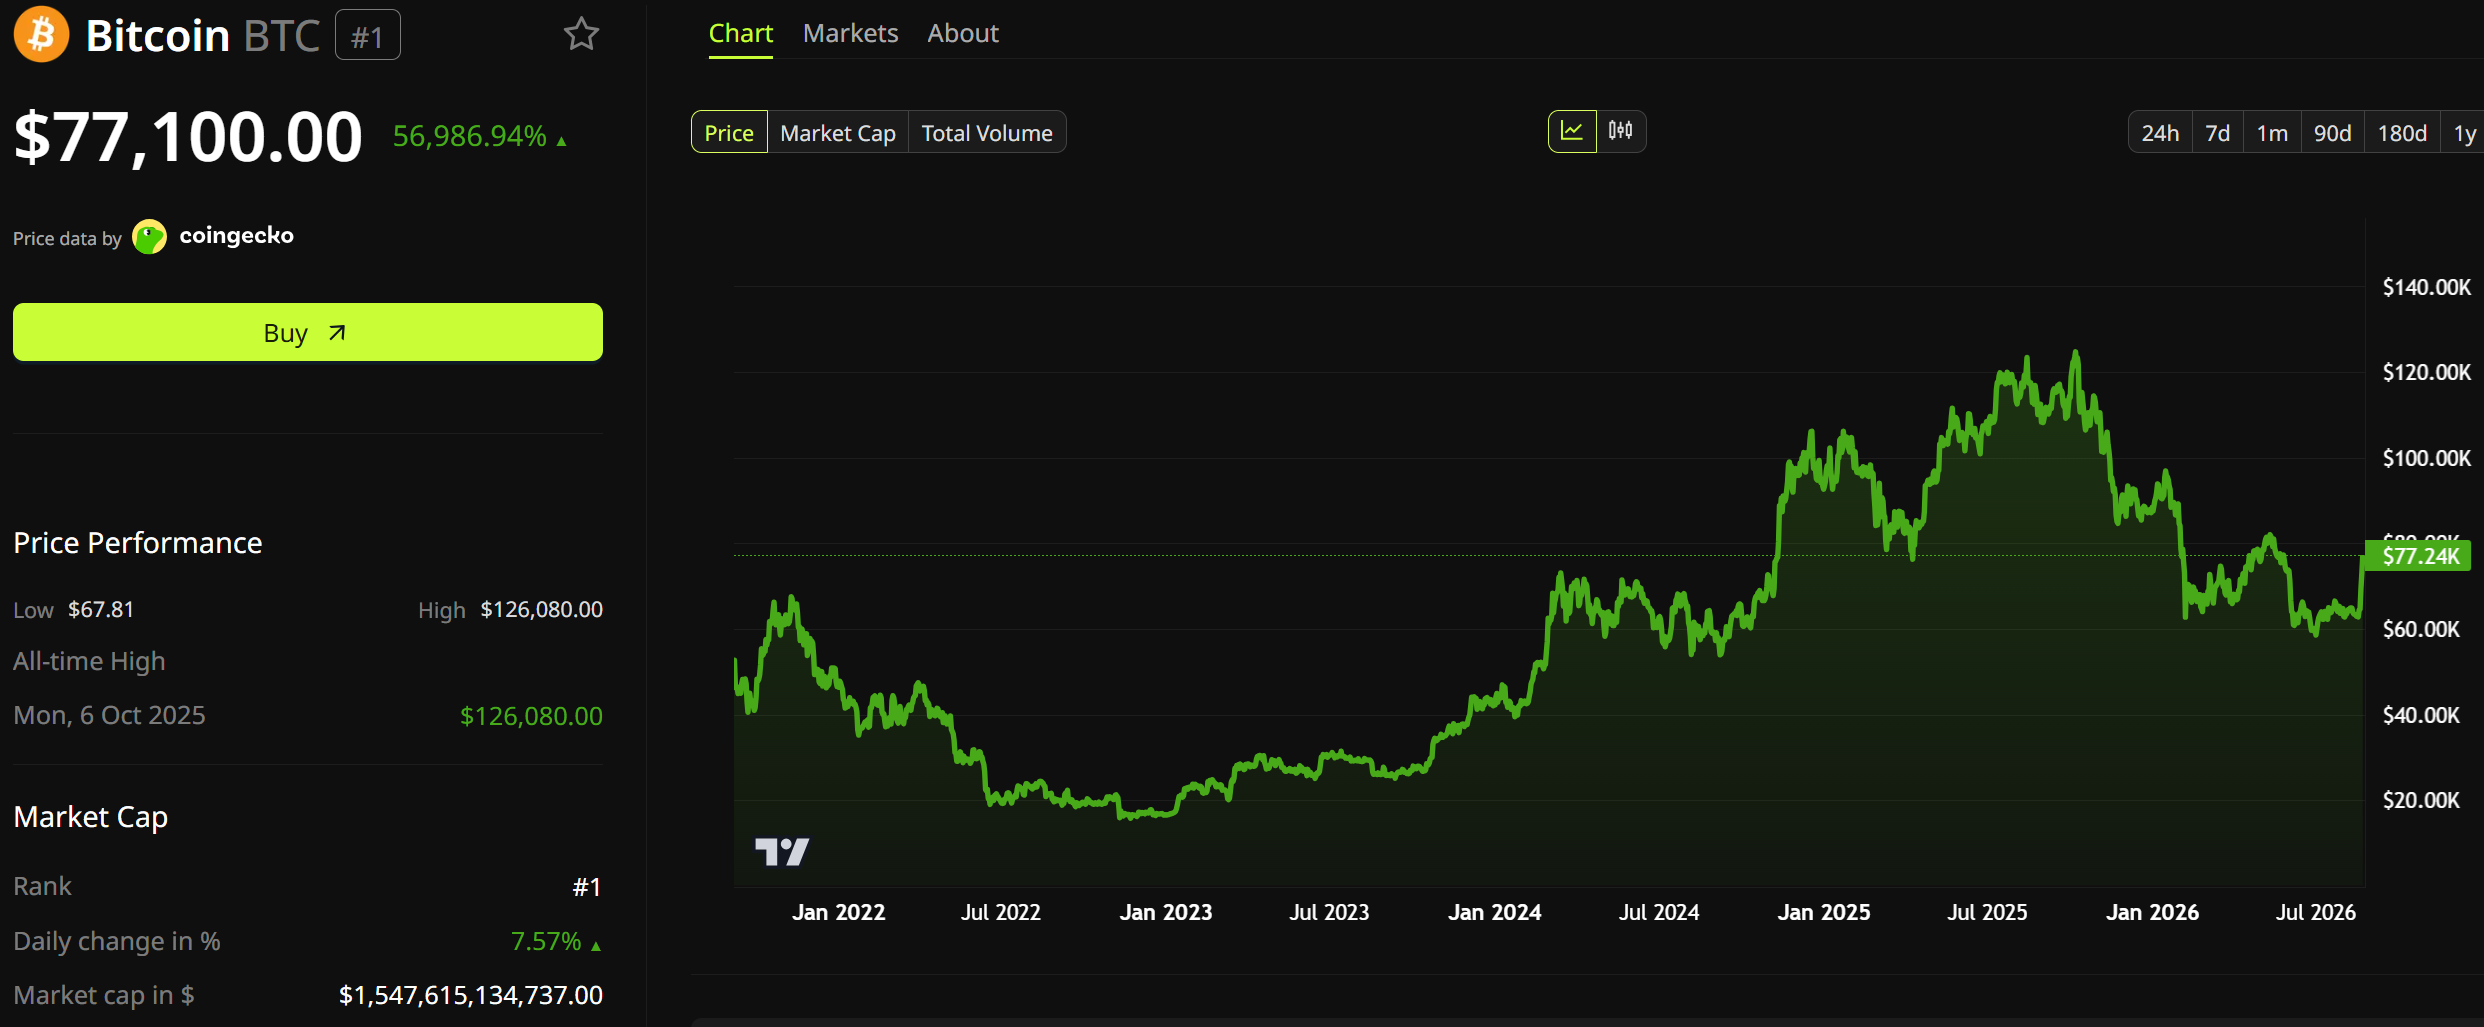
Bitcoin (BTC) gained more than 20% in five days, delivering the stock market’s average annual return about 140 times faster. The run then stalled at $79,500, just 0.6% short of $80,000.
BTC traded near $76,750 on Friday, up 6.6% on the day. That leaves $80,000 about 4% away. The daily relative strength index (RSI) sits at 84.64, its highest reading of 2026.
How Bitcoin Outran the Stock Market by 140 Times
The math is simple. Since 1928 the S&P 500 has compounded at 10.02% a year, dividends included, per New York University’s Stern School dataset.
Spread across five days, that yearly gain works out to 0.137%. Bitcoin did 20% in the same window. Call it 140 times the pace.
Low to high, the run reached 27%. BTC is heading for its strongest weekly close in two years.

Speed is not recovery. BTC still trades 39% below its record $126,080, set in October 2025.
Washington lit the fuse. The Treasury said on August 19 it would at least double its long-end bond buybacks, from $2 billion per operation to $4 billion.
The purchases cover 10-year to 30-year debt and run from September 9 through November 4. Long yields had just touched 20-year highs. Bond desks read it as a backstop.
Leverage did the rest. Bearish traders lost $1.06 billion in a day as short positions unwound.
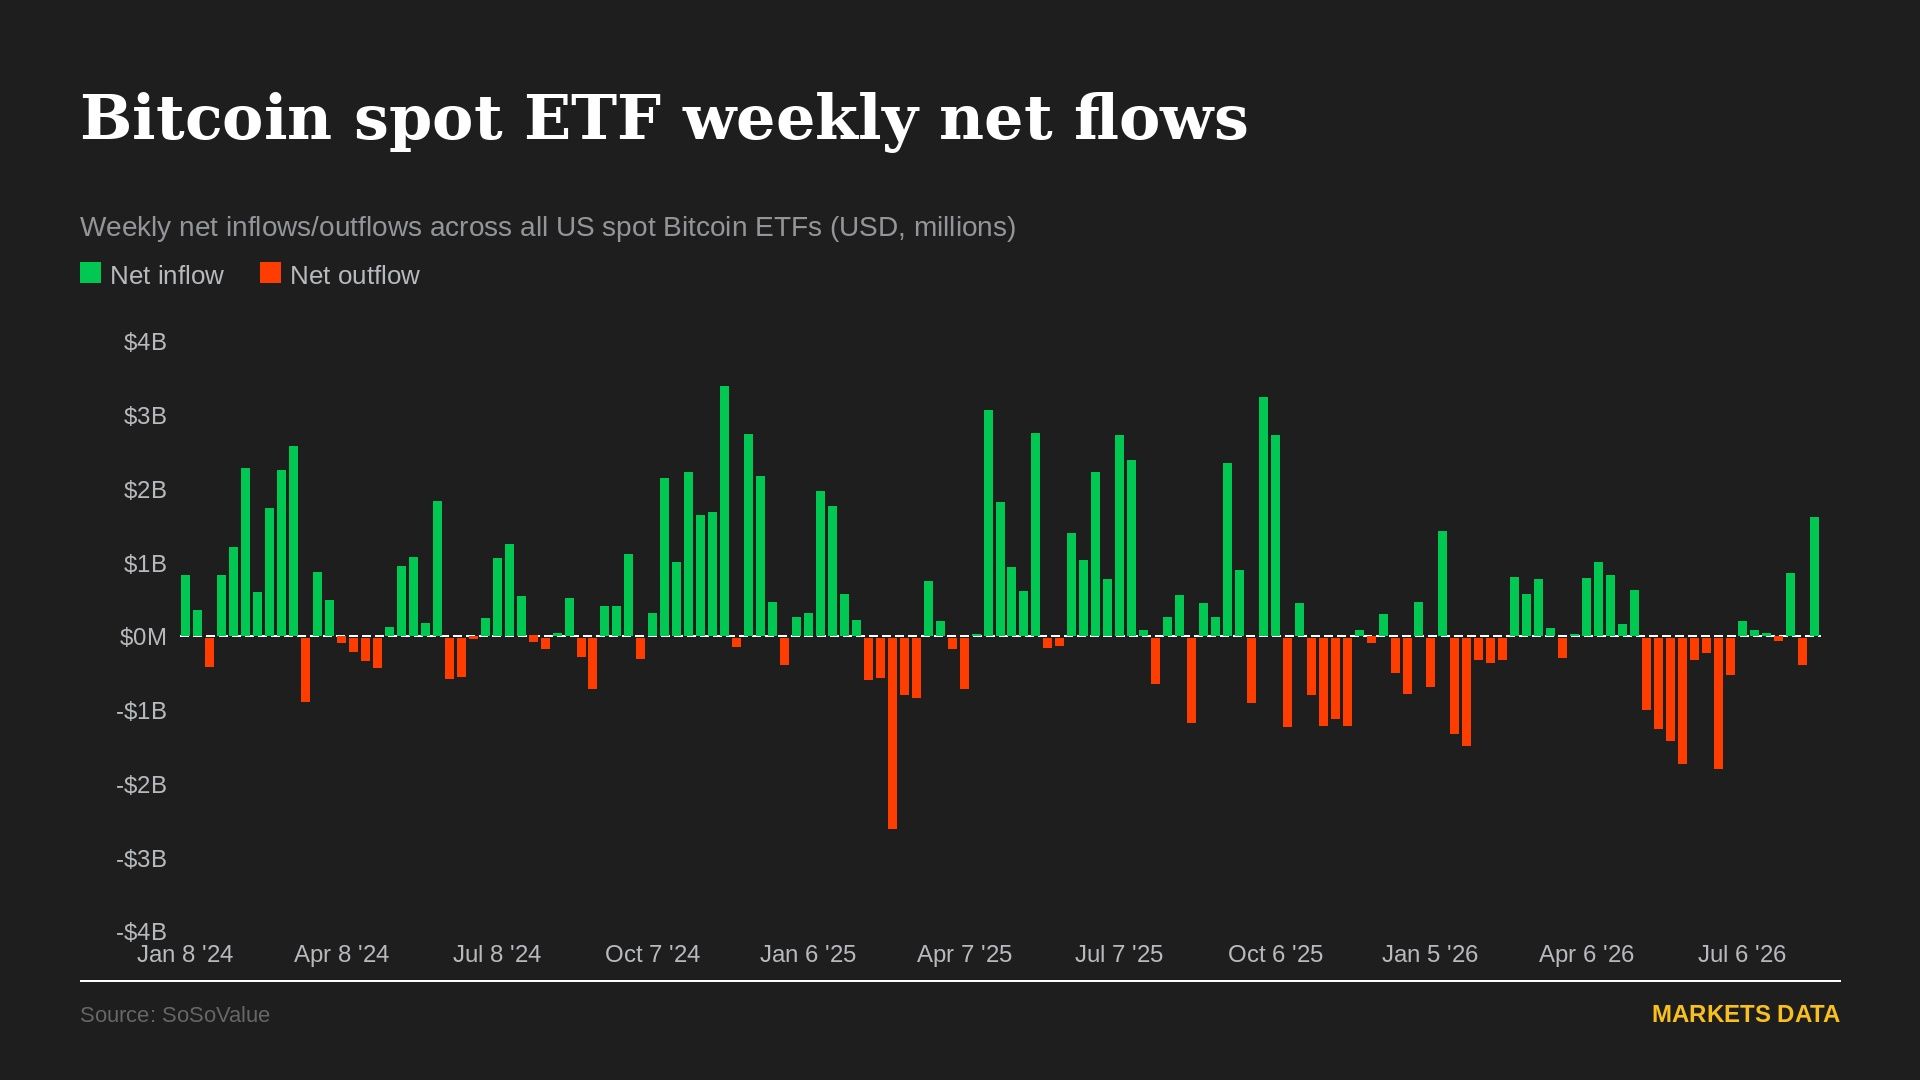
Spot buyers showed up too. US spot Bitcoin exchange-traded funds (ETFs) took $517.2 million on August 19, then $606.3 million on August 20. That was August’s biggest day, per Farside Investors.
Three Resistance Layers Block Bitcoin’s Path to $80,000
Friday’s candle opened at $73,027 and ran to $79,500. Then sellers took over. That high hit the rising trendline drawn off February’s lows. Bitcoin climbed it all spring. June’s slide to $58,000 broke it.
Friday’s rally returned to the line from below and failed. Old support now works as resistance.

Two more walls sit in the same pocket. A shelf at $79,427 capped May’s high. The round $80,000 sits just above.
Bitcoin’s current price has to clear all three. Support starts at Friday’s $73,027 open.
Follow us on X to get the latest news as it happens
Weekend Odds Favor Digestion Over a Breakout
Jamie Coutts of Helios Analytics weighed the jump against how calm the market had been. It ranks fifth since 2018.
He found 14 comparable moves. Bitcoin sat higher 71% of the time 30 and 90 days later. The median gain was near 10%. A random day since 2018 returned 1.2%.
The extremes run wide. A similar jump in April 2019 led to a 118.7% gain over 90 days. One in October 2019 led to a 23% drop in 30.
Coutts calls 14 examples a thin sample. His own significance tests came back short of proof.
His table prices the pain too. In the median case BTC dipped 8.4% below entry within 90 days.

“There is a wall of overhead supply at the low $80k range it needs to work through,” wrote Coutts, chartered market technician at Helios Analytics.
On-chain data leans the other way. CryptoQuant shows spot and futures demand positive together for the first time since October 2025.
A separate quicktake ties the bounce to MVRV, which compares price with what holders paid.
Analyst Darkfost put net new demand at a 2026 high of 25,000 BTC. That weighs new coins against coins idle over a year.

“BTC looking strong here. Rallies like this in bear markets usually signal the bottom is in. Might see a dip, but the bear phase is pretty much done imo,” said Ki Young Ju, founder and chief executive of CryptoQuant.
So can Bitcoin reach $80,000 this weekend? Possible, but not likely.
Weekend books run thin. Fewer large buyers trade Saturday and Sunday. Clearing three walls with RSI at 84.64 (overbought) takes size.
A slide back toward $73,000 would cool that reading without wrecking the week. Bitcoin’s longer-term outlook now rests on whether the low $80,000s give way.
The post Bitcoin Moved 140x Faster than Stocks This Week: $80,000 this Weekend? appeared first on BeInCrypto.
Your day-ahead look for Aug. 21, 2026
XRP is up 20% in the past 24 hours, and it gives no signs of stopping!
Ripple (XRP) Price Predictions: Analysis
Key support levels: $1, $1.3
Key resistance levels: $1.6, $2
Bulls Return with a Vengeance
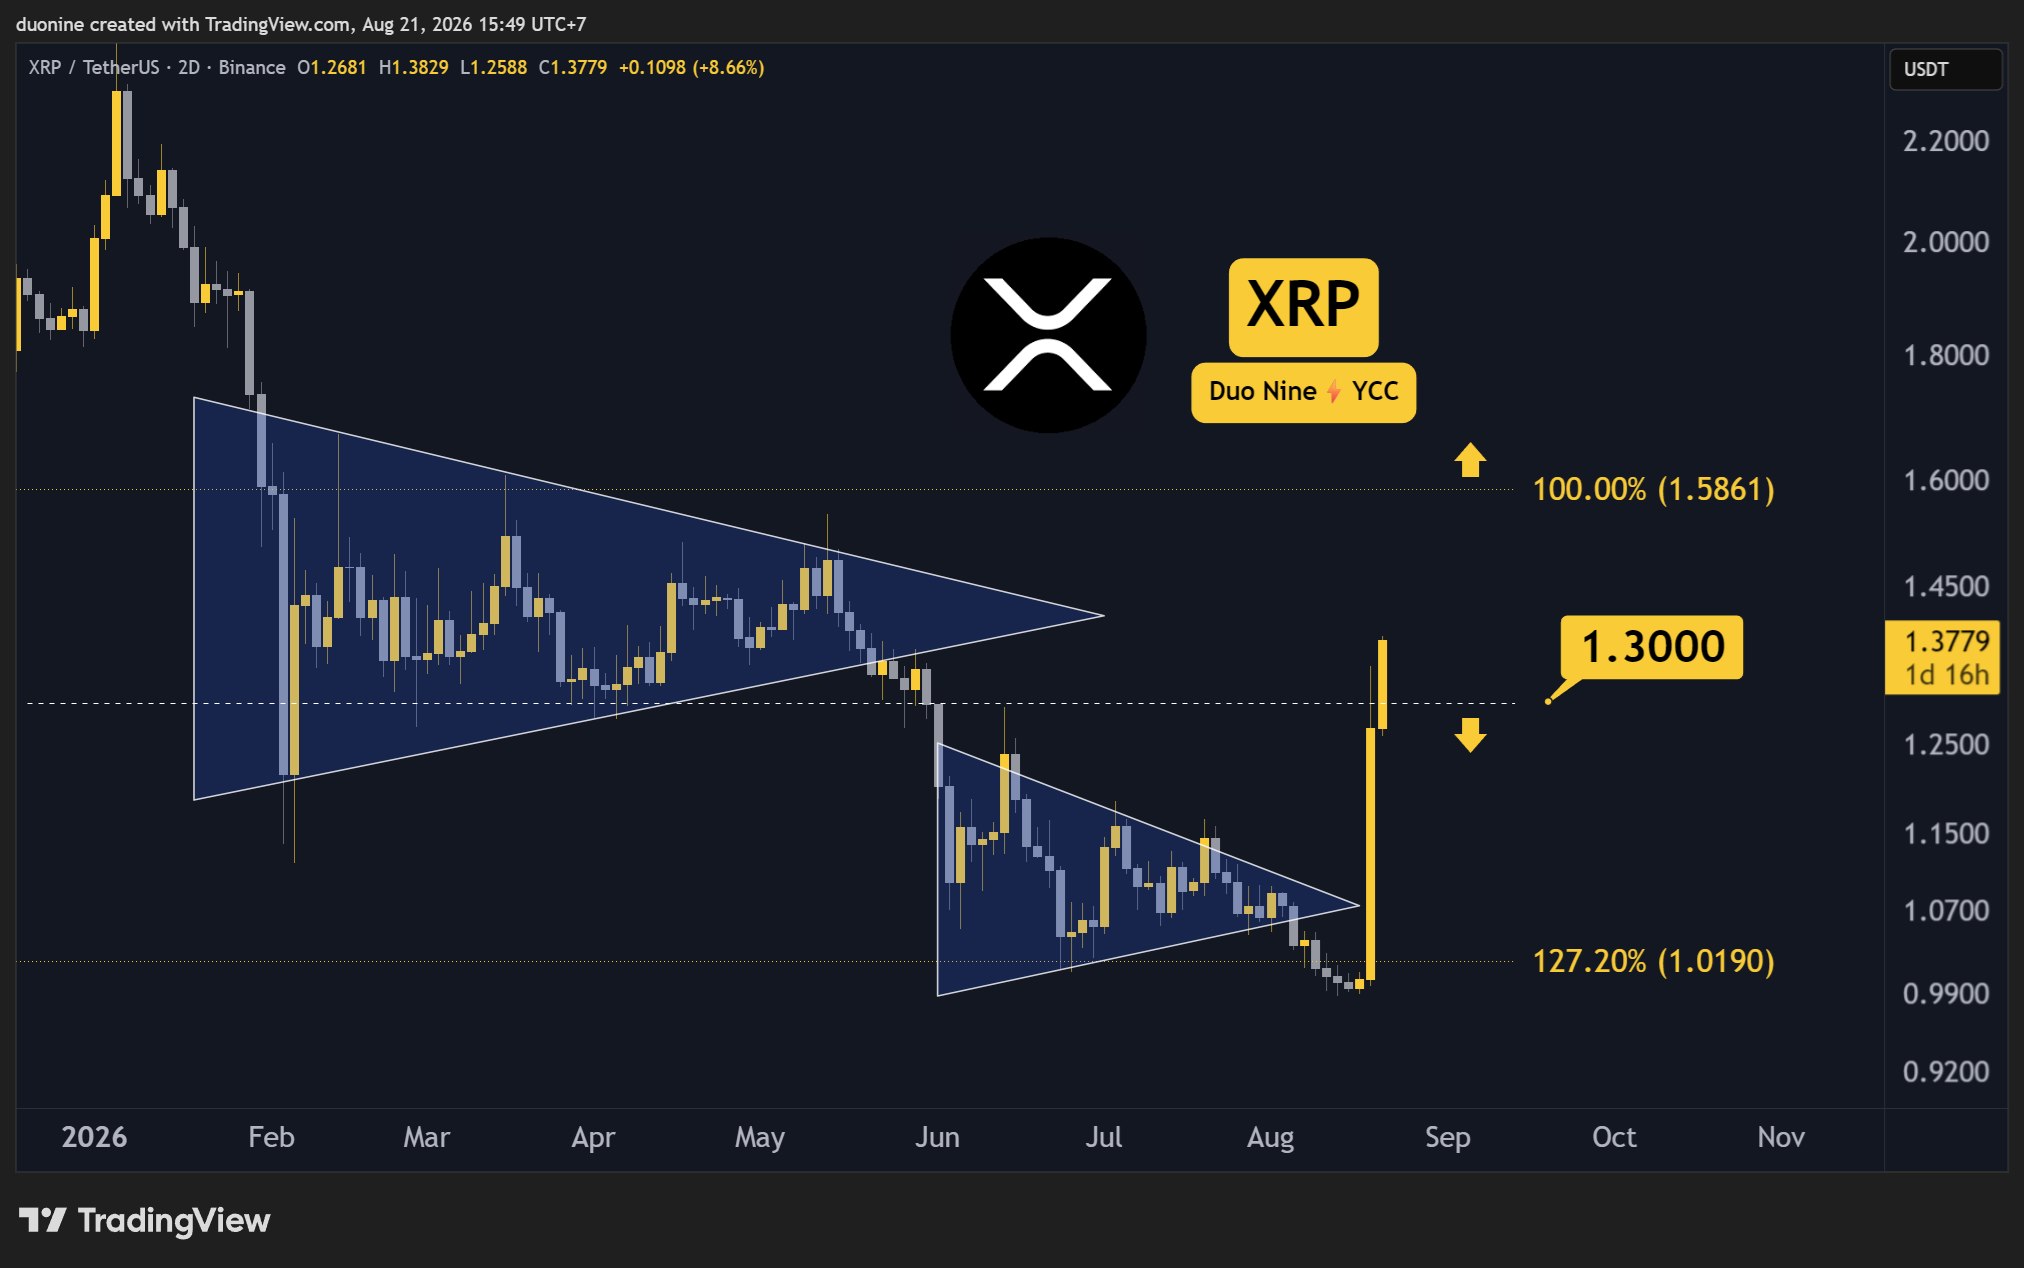
In an unexpected move, XRP has rallied by over 20% in the past 24 hours. This comes after the price nearly lost its support at $1. The ongoing rally is market-wide, and XRP has made the best of this opportunity.
At the time of this post, the price has just moved past the resistance at $1.3, which is likely to act as key support. If the rally is sustained, then the next major target is found at $1.6.
Buy Volume Explodes
After months of consolidation just above $1, buyers are finally back, and the volume has spiked to levels not seen since the February crash. The difference now is that buyers are dominating instead of sellers.
This rally is very strong and has erased most of the losses since the start of the year. If it can manage to claim $1.6 as well, then XRP will make a higher high and officially end its downtrend.

Daily RSI Enters Overbought Zone
This very aggressive buying has pushed the daily RSI above 80. That places it in the overbought area and signals caution for late buyers. Most of the move could be behind us even if XRP does eventually hit $1.6.
Whatever happens going forward, XRP has already made a big statement that could turn the price action bullish for the remainder of the year. Ideally, this cryptocurrency will consolidate and confirm the recent gains before going higher.

The post Important Ripple (XRP) Price Update: August 21st appeared first on CryptoPotato.

XRP price is changing hands at $1.3, up 18% on the day, extending a violent 22% rally that carried the token to $1.26 in a single 24-hour window days earlier, shrugging off bearish prediction. But what’s driving it, and more importantly, where does the smart money rotate once the easy gains are booked?
The rally wasn’t XRP-specific. It traces back to two August 19 announcements: the U.S. Treasury doubling its longer-term bond buyback program to inject market liquidity, and President Trump reiterating his push to make the U.S. a Bitcoin superpower while pressing Congress to pass the CLARITY Act.
Following all the catalysts, the total crypto market cap responded with an 8% jump to $2.5 trillion in 24 hours. XRP simply rode the wave harder than most large-caps.
That macro tailwind explains the spike, but it doesn’t answer whether XRP holds these levels or gives them back. The technical picture underneath the headline number tells a more complicated story.
Discover: The Best Crypto to Diversify Your Portfolio
XRP Price Prediction: Hit $1.50 This Week?
XRP printed an intraday high of $1.32 in the 24-hour session that shook out short leveraged positions. Recent rally analysis points to resistance clustering near $1.30–$1.34, the exact zone price is testing now, while support has shifted up to $1.10–$1.00 after repeated tests of the psychological $1 level earlier this month.
Momentum data, however, shows downside risk toward $0.62 if momentum fails, while Standard Chartered maintains a longer-term $2.8 target, a split that underscores how unsettled sentiment remains even mid-rally.

- Bull case: a clean break and hold above $1.34 opens room toward $1.60–$1.80.
- Base case: consolidation between $1.10 and $1.30 while the market digests the move.
- Bear case: a fade back below $1.10 invalidates the breakout thesis and re-tests $1.00.
Wave-count analysis suggests the reclaimed $1 level needs to hold as a floor for any of the bullish targets to stay credible.
Trade XRP Market on Kalshi and Get a $25 Signing-up Bonus
Bitcoin Hyper Targets Early Mover Upside as XRP Tests Key Levels
A 22% pop validates anyone who bought the dip below $1. But XRP is a multi-billion-dollar asset now, and a repeat of that percentage gain from here requires enormous capital inflow, not just sentiment.
That math is exactly why traders chasing outsized returns increasingly look toward earlier-stage infrastructure plays where the market cap ceiling hasn’t been tested yet. Some of that rotation lands on Ripple’s broader valuation story; some of it lands on presales building the next layer of crypto infrastructure entirely.
Bitcoin Hyper ($HYPER) is positioning itself as the first Bitcoin Layer 2 with native SVM integration, smart contract execution at speeds it claims outpace Solana itself, while settling back to Bitcoin’s base layer for security.
The presale is priced at $0.013685 and has raised $33 million so far, with staking rewards on offer for early participants. The pitch: solve Bitcoin’s slow, expensive, non-programmable core through a decentralized canonical bridge and low-latency execution layer.
Traders can research Bitcoin Hyper directly before the round progresses further.
Discover: The Best Token Presales
The post XRP Price Prediction: 22% Rally, But Ripple Still is Undervalued appeared first on Cryptonews.


Cointelegraph is committed to providing independent, high-quality journalism across the crypto, blockchain, AI, and fintech industries.
All news, reviews, and analyses are produced with full journalistic independence and integrity. For more details on our standards and processes, please read our Editorial Policy.
Ethereum has staged a sharp breakout from its multi-week consolidation, with ETH now trading around $2.4K after reclaiming the descending trendline that had capped the broader recovery. The move is supported by a strong acceleration in momentum and a noticeable rise in short liquidations, although the sharp increase in RSI readings suggests the rally could become vulnerable to a near-term pullback.
Ethereum Price Analysis: The Daily Chart
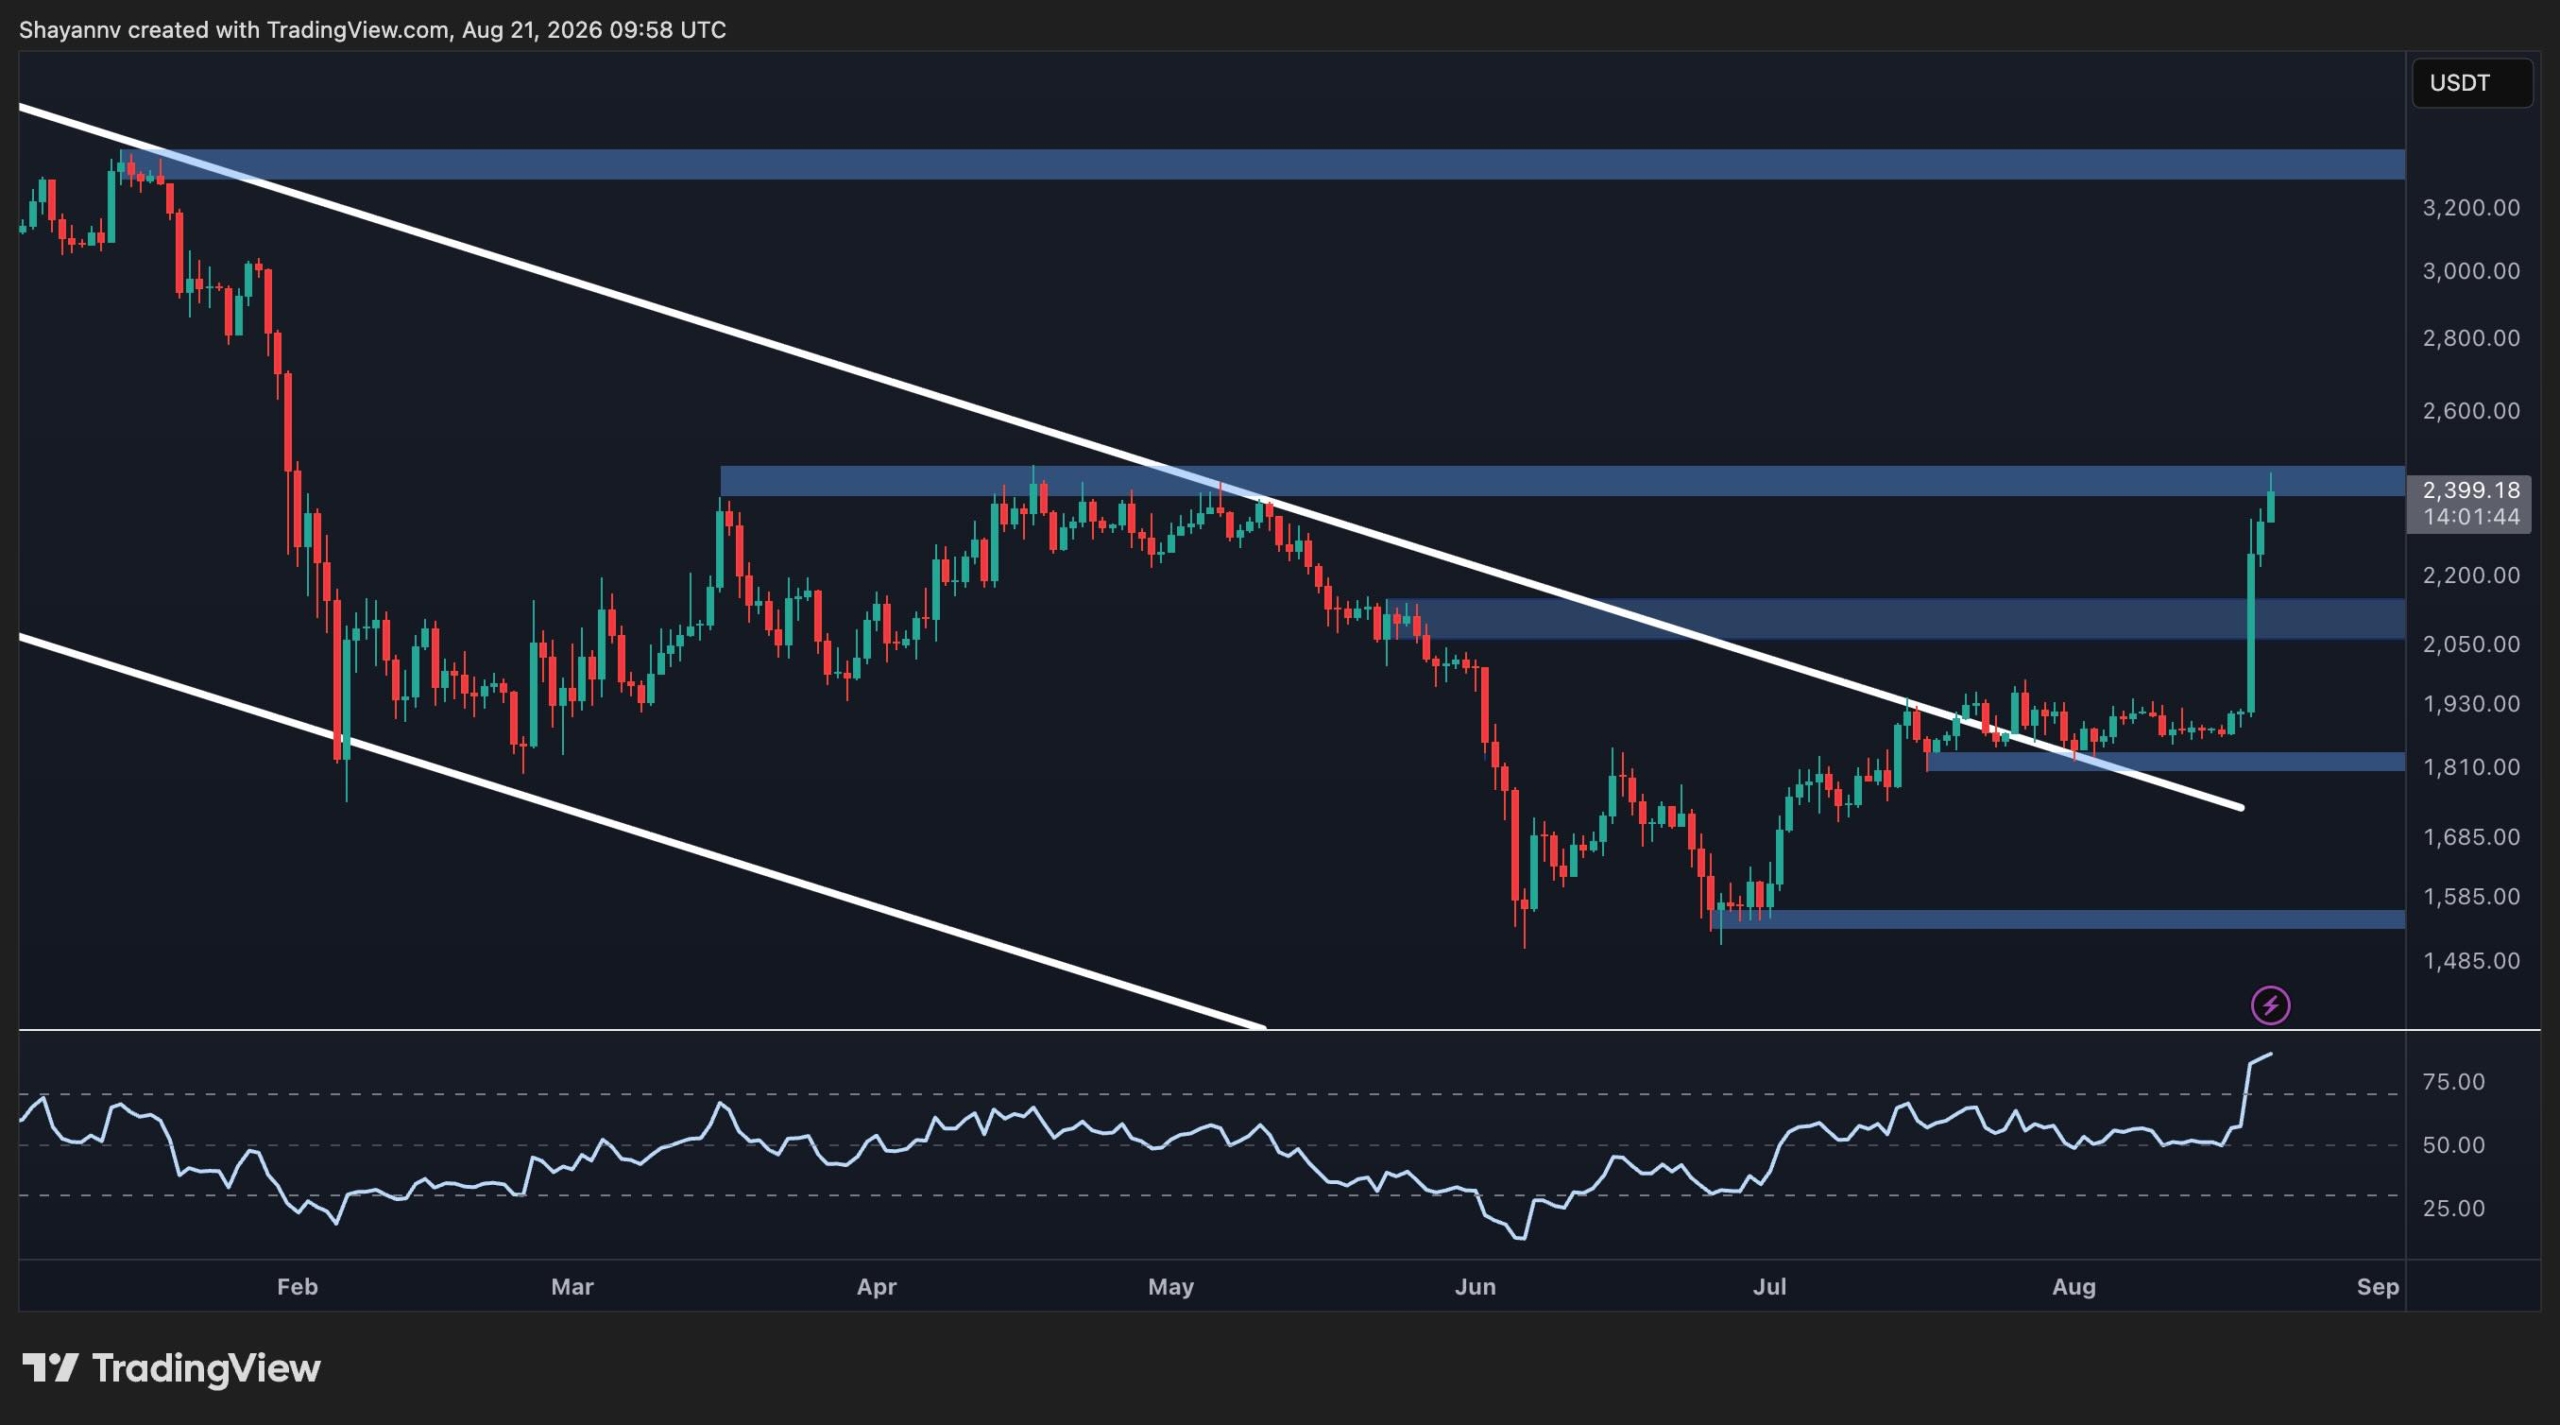
On the daily chart, ETH has decisively broken above the descending trendline that had been in place for months. The breakout is particularly significant because the price had spent several months consolidating below that resistance while forming higher lows from the June bottom near $1.5K.
The latest surge has carried ETH directly into the $2.1k resistance level, with the price currently testing the $2.4K supply zone. This area represents the immediate test for the breakout. A sustained daily close above the zone would strengthen the bullish structure and could open the way toward $3K and potentially higher.
On the downside, the former breakout area around $2.1K is now the first major support zone. Holding above it would keep the recent breakout structure intact. Below that, the $1.8K region represents another important support area, while the $1.5K zone remains the deeper structural floor.
Momentum has also shifted sharply in favor of the buyers. The daily RSI has jumped above 75, running deep into the overbought area. This does not necessarily invalidate the breakout, particularly during a strong expansion move, but it does increase the probability of consolidation or a retest before another sustained leg higher.
ETH/USDT 4-Hour Chart
The 4-hour chart provides an even clearer picture of the breakout. ETH spent much of the last few months moving sideways before suddenly breaking above the short-term mildly ascending channel and the $2.1K resistance zone.
The breakout was followed by an almost vertical advance toward $2.4K, indicating strong short-term momentum. The $2.1K zone is therefore the key area to watch if the rally starts to retrace. A successful retest of this region as support would provide a healthier confirmation of the breakout.
As observed on the daily chart, the next major resistance sits around $2.4K, where ETH is currently trading. A decisive move above this zone could extend the advance toward higher levels in the upcoming weeks. At the same time, the 4-hour RSI has surged far above 80 and is moving sideways in this region.
That reading highlights just how stretched the immediate move has become. A pullback toward $2.1K would therefore not necessarily be bearish and would likely be necessary for the market to cool down, provided ETH maintains the breakout zone.

Sentiment Analysis
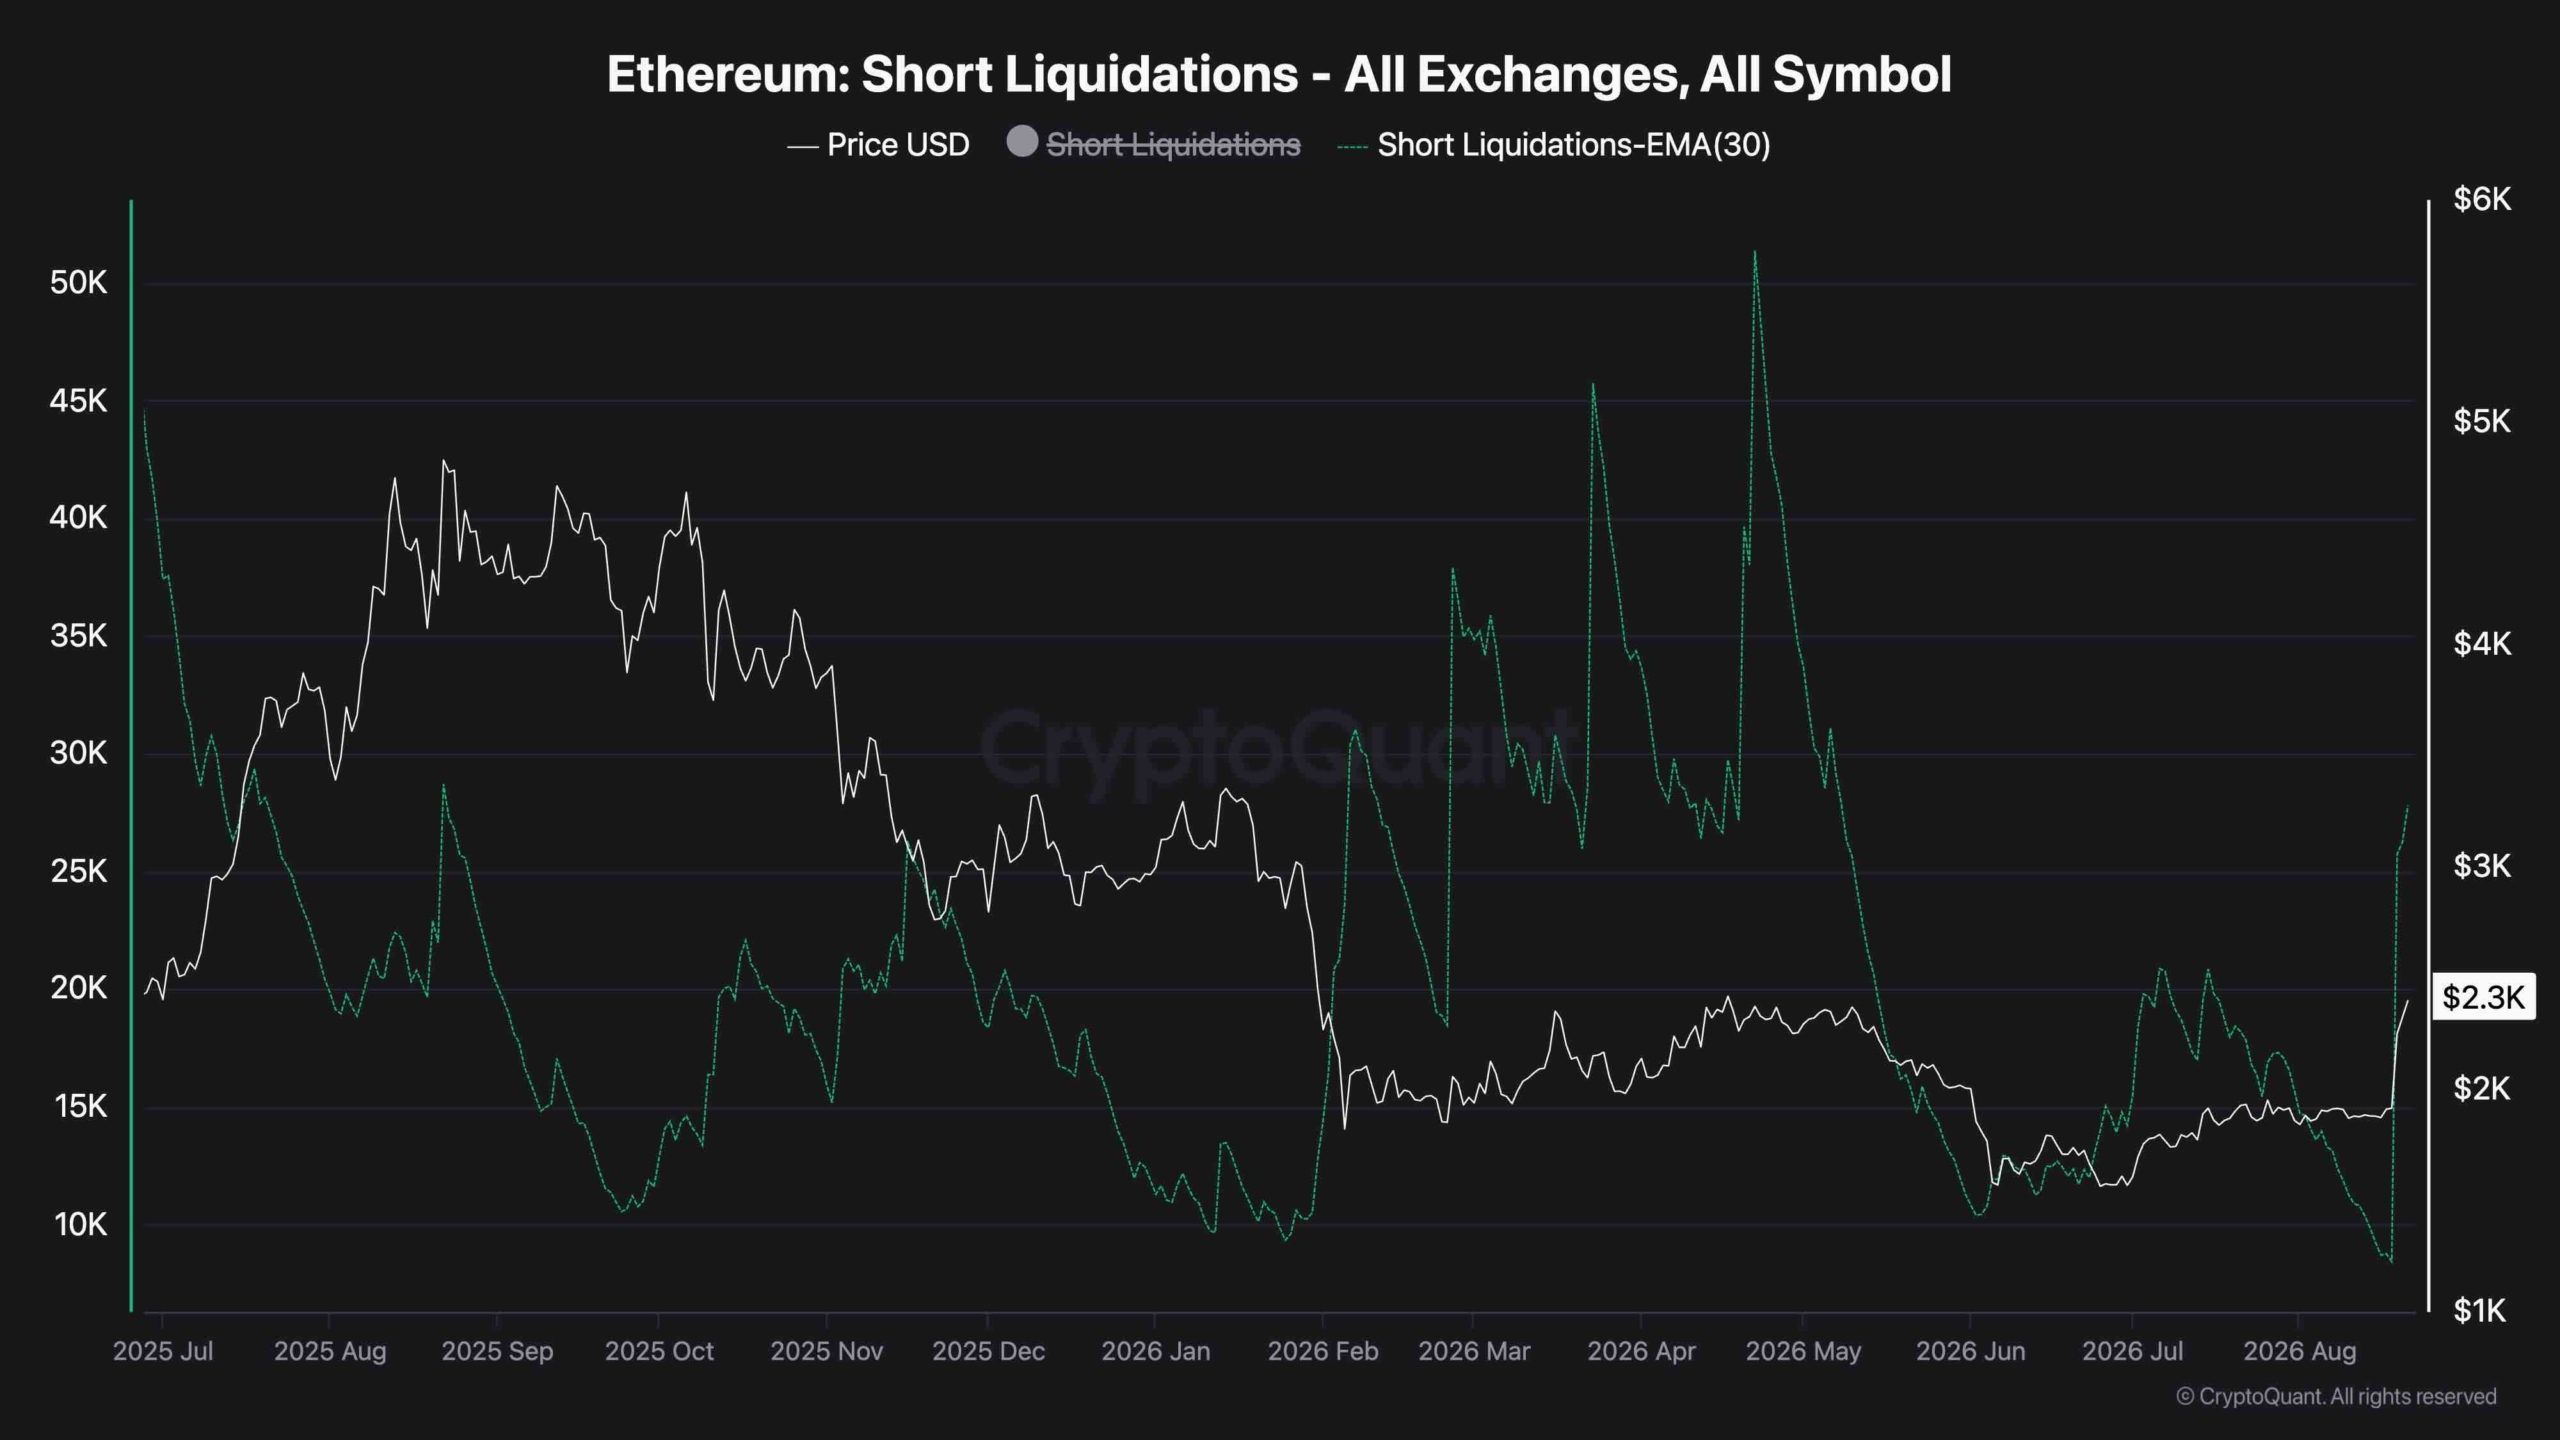
The liquidation chart shows a clear increase in Ethereum short liquidations alongside the latest price surge. Short liquidations have risen sharply toward roughly 28K on the latest spike, following a period in which the metric had remained comparatively subdued.
This suggests that the move above $2K has forced a growing number of bearish positions to close, adding forced buying pressure to the rally. In other words, the breakout appears to have developed a short-squeeze component.
However, the latest liquidation spike is still below several of the much larger liquidation events visible earlier in the chart, including episodes above 40K and 50K. That indicates the current squeeze has been significant but has not yet reached the most extreme levels seen during previous Ethereum rallies.
Overall, the charts favor a bullish interpretation as long as ETH holds the newly reclaimed $2K-$2.1K area. The immediate challenge is whether buyers can sustain momentum above the $2.4J resistance zone. With both the daily and 4-hour RSI heavily overbought and short liquidations accelerating, a temporary cooldown would be unsurprising, but the breakout structure remains constructive unless ETH loses its key support zones.
The post Ethereum Price Prediction: Has ETH Opened the Door to $3K After the Latest Breakout? appeared first on CryptoPotato.


- Flowra launches an open auction for Solana blockspace and MEV.
- Early tests showed a 20.6% increase in compute units per block.
- Programmable policies give Solana validators more control over blocks.
Flowra has launched an Open Orderflow Auction (OOA), a new block-building framework for Solana designed to introduce greater competition into the network’s maximal extractable value (MEV) market and potentially increase validator revenue.
The Seoul-based blockchain infrastructure company said the system allows registered searchers to compete for transaction inclusion through a transparent auction instead of relying on closed orderflow channels.
Flowra said the approach could improve price discovery while allowing validators to capture more of the value generated by MEV.
Flowra opens Solana block building to competition
The Open Orderflow Auction is intended to create an open marketplace for Solana blockspace, allowing searchers to compete through bids for transaction inclusion.
Flowra’s approach is inspired by competitive block-building models that have emerged on Ethereum.
The company said open bidding on Ethereum has contributed to higher proposer revenue and believes Solana’s high throughput and low-latency architecture could support a similar model.
In early testing on a single validator, a Flowra-enabled setup increased compute units per block by 20.6%.
The validator moved from 84% of the network average to 101%, according to the company.
Flowra also reported higher block fees than comparable validator software, alongside 100% block production and 99.999% block engine uptime during the test.
The results are based on early testing rather than a broader network-wide deployment.
Programmable policies give validators more control
Alongside the auction system, Flowra is introducing Programmable Block Policy, which allows validators to establish their own transaction inclusion policies at the block-building layer.
The company said the feature is designed to provide validators with greater operational flexibility, including the ability to meet regulatory and institutional compliance requirements without modifying the underlying Solana protocol.
Flowra recently announced a collaboration with compliance infrastructure provider Honeypot to bring sanctions and risk screening to this layer.
According to Flowra CEO Harry Hwang, Solana’s technical performance has helped make it a leading blockchain network, but its MEV market remains concentrated.
“By opening block building to transparent competition, we’re creating a more efficient market for blockspace,” Hwang said. He added that the system would give validators greater control over block construction while providing verifiability and auditability.
The company’s architecture separates these block-building policies from changes to the underlying network protocol, according to the announcement.
Flowra targets institutional validators
Flowra is currently onboarding institutional-grade validators to its Open Orderflow Auction, with a broader rollout planned as participation in the Solana ecosystem expands.
The OOA is now available to validators and searchers participating in the Solana ecosystem, although the company did not provide details on the number of participants currently using the system.
Flowra describes itself as a blockchain infrastructure company focused on validator and orderflow solutions for Solana. Its products include validator infrastructure, delegation programs and MEV-related technologies.
The company said its broader objective is to improve transaction transparency, value distribution and incentive alignment among validators, users and builders.
The launch comes as Flowra seeks to apply a more market-based approach to Solana’s block-building process.
Its initial testing suggests potential improvements in block utilization and validator fees, while the Programmable Block Policy adds a mechanism for validators to customize transaction inclusion.
The broader impact of the system will depend on adoption among validators and searchers as Flowra expands its rollout across the Solana ecosystem.

How Much Does Dropbox Actually Lose When Its Service Goes Down for an Hour?

Bitcoin short-seller staged a $6 million liquidation

Ronaldinho to make football comeback aged 46





-

 Fashion7 days ago
Weekend Open Thread: Ann Taylor
-

 Sports6 days ago
Birmingham 2026: Day 6 Timetable for Irish Athletes
-
 NewsBeat6 days ago
Myanmar says over 300,000 Rohingya refugees verified for repatriation as exodus enters ninth year
-

 Business3 days ago
SMA Solar Technology AG (SMTGY) Q2 2026 Earnings Call Transcript
-

 Politics6 days ago
SEQ Code: The Three Letter Boarding Pass Code That Could Give You The Worst Seat
-

 Crypto World6 days ago
Pi Network Protocol 27 endgame: last upgrade before what?
-

 Tech3 days ago
Qwen3.8-27B runs frontier-class coding agents and reasoning locally, no cloud API required
-

 Crypto World4 days ago
OCC Greenlights Trump Family Crypto Firm for Trust Charter
-
 Tech6 days ago
Every fusion startup that has raised over $100M
-
 Entertainment6 days ago
Marvel Studios Reveals New X-Men Cast Including Adam Driver and Sadie Sink
-
 Business6 days ago
Monarch Mutual Fund set to enter MF space with maiden overnight fund; files draft with Sebi
-

 Fashion7 days ago
Weekly News Update, 8.14.26 – Corporette.com
-

 Fashion7 days ago
Silver bangles for women – Newbridge Silverware
-

 Business6 days ago
Facebook Down Now? Users Report Login And Loading Problems As Outage Trackers Monitor Ongoing Issues
-

 Business6 days ago
Cristiano Ronaldo’s Secret Wedding Deepens As Presenter Claims Family Learned ’30 Seconds’ Before
-

 News Videos1 day ago
Don’t Leave Your Financial Future To Chance | August 19, 2026
-

 Crypto World5 days ago
Data of 54K Wallet Users Leaked, Clarity Odds Just 10%: Hodler’s Digest, Aug. 16
-

 Fashion7 days ago
Cart Confidential Vol. 44 – Julia Berolzheimer
-

 Crypto World4 days ago
NAVI Prime launches institutional lending framework on Sui
-

 Politics5 days ago
Britain is facing a housing disaster
You must be logged in to post a comment Login