
Crypto World
AUD/CAD Analysis: Gap Pushes Price Beyond the Broadening Triangle

On 19 August, Reserve Bank of Australia Deputy Governor Andrew Hauser adopted a more hawkish tone, warning that another rate increase could become necessary if the inflation risks highlighted by the central bank — including the conflict in the Middle East, a surge in demand from the AI sector and weak productivity — begin to materialise.
His comments came one week after the RBA decided on 11 August to leave its policy rate unchanged at 4.35% for a second consecutive meeting.
For the Canadian dollar, oil prices remain a more important driver. Crude has continued to rise this week amid heightened geopolitical tensions and concerns over potential supply disruptions. Higher oil prices can traditionally support the Canadian dollar given the country’s significant commodity exports.
Technical Analysis of AUD/CAD
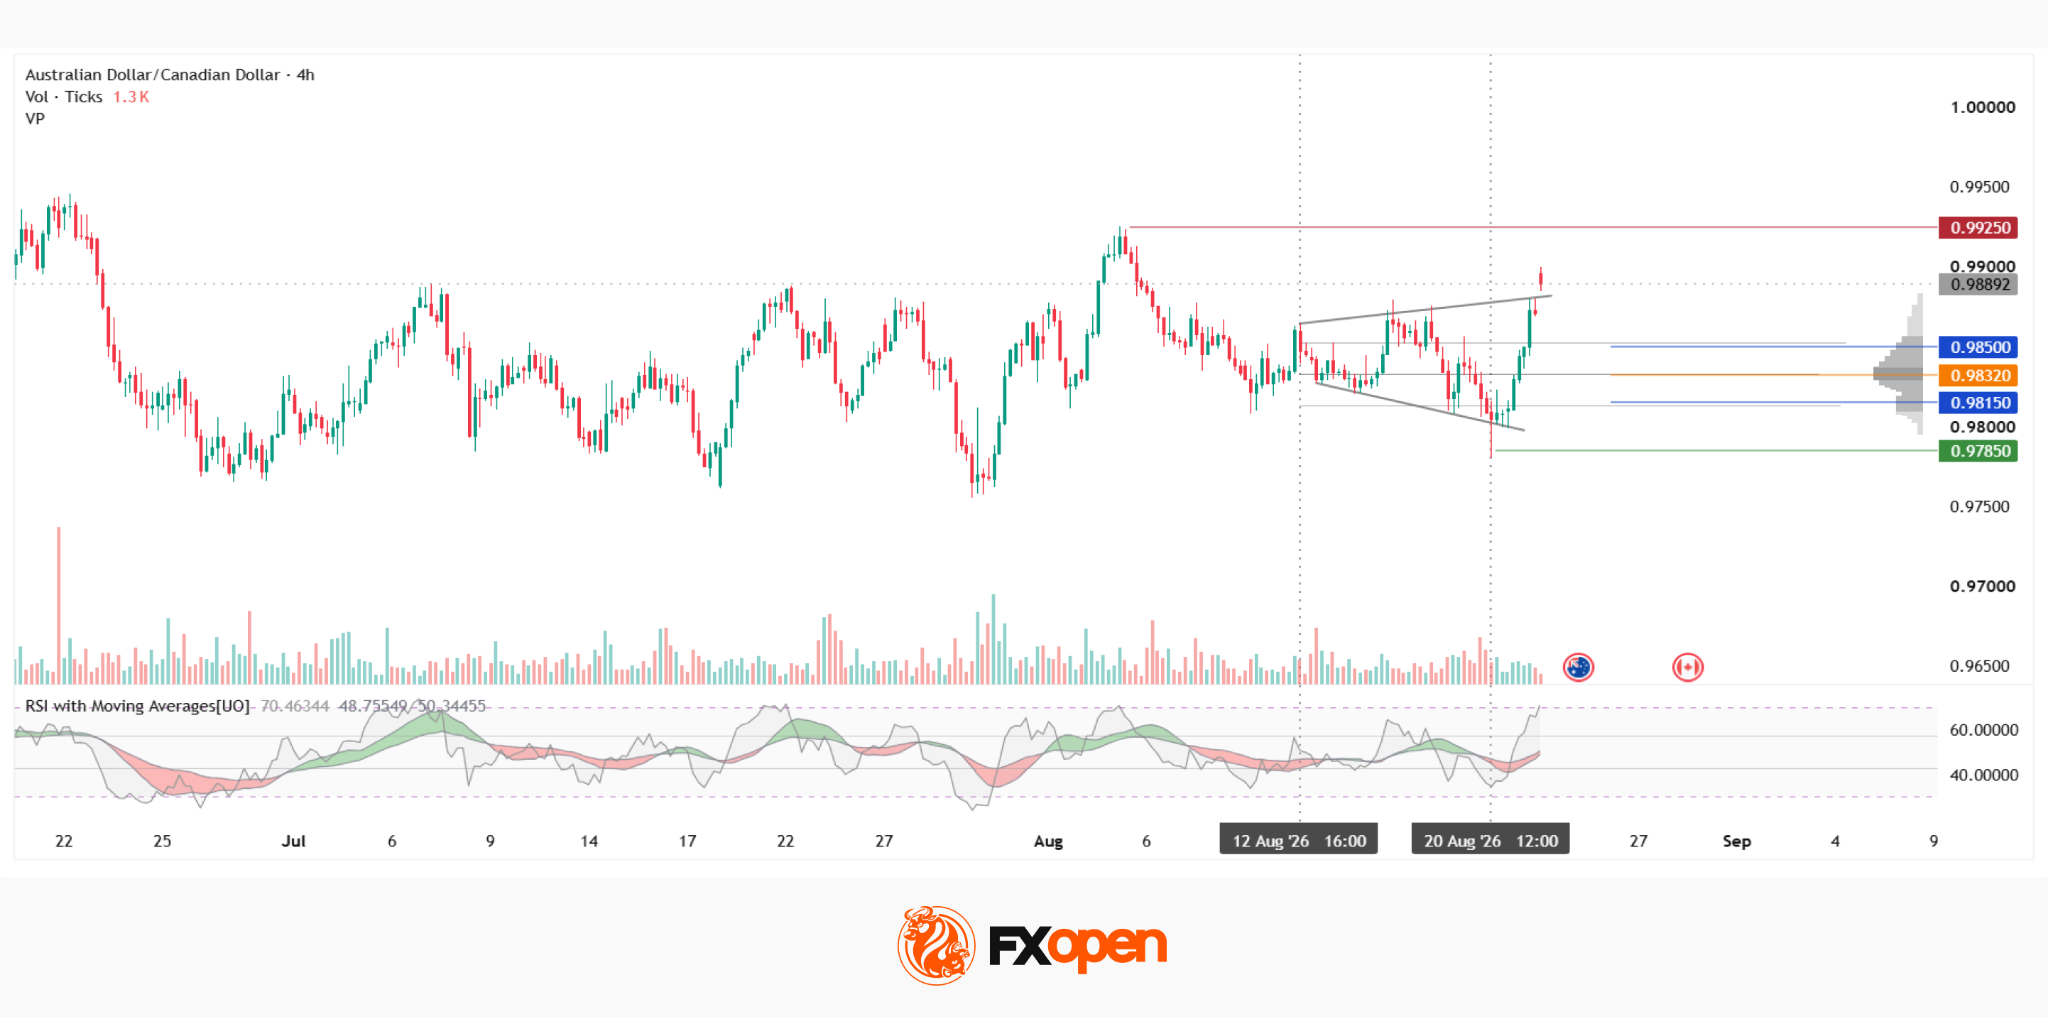
On the four-hour AUD/CAD chart, a medium-term sideways range has been developing since April. Within this range, the price has formed a broadening triangle, characterised by trendlines that diverge rather than converge and reflecting progressively wider price swings.
On Monday, 24 August, trading opened with a gap above the upper boundary of the formation. If the bullish impulse continues to develop, the next significant obstacle could be the red resistance level at 0.9925.
A failed breakout and subsequent reversal lower would bring several key levels within the current market profile into focus. These include the upper profile boundary at 0.9850, the Point of Control (POC) at 0.9832 and the lower profile boundary at 0.9815.
Below the profile’s main area of concentration, near the base of the triangle, lies the green support zone around 0.9785.
The RSI + MAs indicator currently shows readings of 71, 48 and 50. The oscillator is approaching overbought territory, while both moving averages remain around the middle of the neutral zone, providing little confirmation of the strength of the current move.
Key Takeaways
The elevated RSI reading and neutral moving averages are yet to produce a coordinated signal, leaving the sustainability of the gap and the attempted breakout uncertain.
The fundamental backdrop is also sending mixed signals. The RBA’s increasingly hawkish rhetoric provides support for the Australian dollar, while higher oil prices could strengthen the Canadian dollar. The balance between these two forces may prove decisive for the next move in AUD/CAD.
Trade over 50 forex markets 24 hours a day with FXOpen. Take advantage of low commissions, deep liquidity, and spreads from 0.0 pips (additional fees may apply). Open your FXOpen account now or learn more about trading forex with FXOpen.
This article represents the opinion of the Companies operating under the FXOpen brand only. It is not to be construed as an offer, solicitation, or recommendation with respect to products and services provided by the Companies operating under the FXOpen brand, nor is it to be considered financial advice.

EUR/USD has regained ground in recent sessions, with the pair trading near 1.17 as broad-based weakness in the US dollar continues to dominate the foreign-exchange market. The main driver remains the changing monetary-policy outlook, with investors focused on whether the Federal Reserve can maintain a restrictive stance while the US economy shows signs of slowing.
The dollar faces a key test this week as Fed Chair Kevin Warsh prepares to deliver his first speech at Jackson Hole on Friday. Persistent inflation and rising long-term Treasury yields could encourage a hawkish tone, particularly if Warsh signals that rate cuts in September are far from guaranteed. Conversely, weaker US growth or softer inflation data would reinforce expectations of easier monetary policy and could extend the dollar’s decline.
In Europe, euro-area inflation rose to 2.9% in July, keeping price pressures above the ECB’s 2% target. The ECB has kept interest rates unchanged since June, but higher energy prices and renewed inflation risks could limit the scope for further easing.
With EUR/USD trading near multi-month highs, the Jackson Hole symposium and upcoming US PCE inflation data could determine whether the euro can extend its advance or whether a hawkish Fed response triggers a renewed recovery in the dollar.
Technical Analysis of EUR/USD
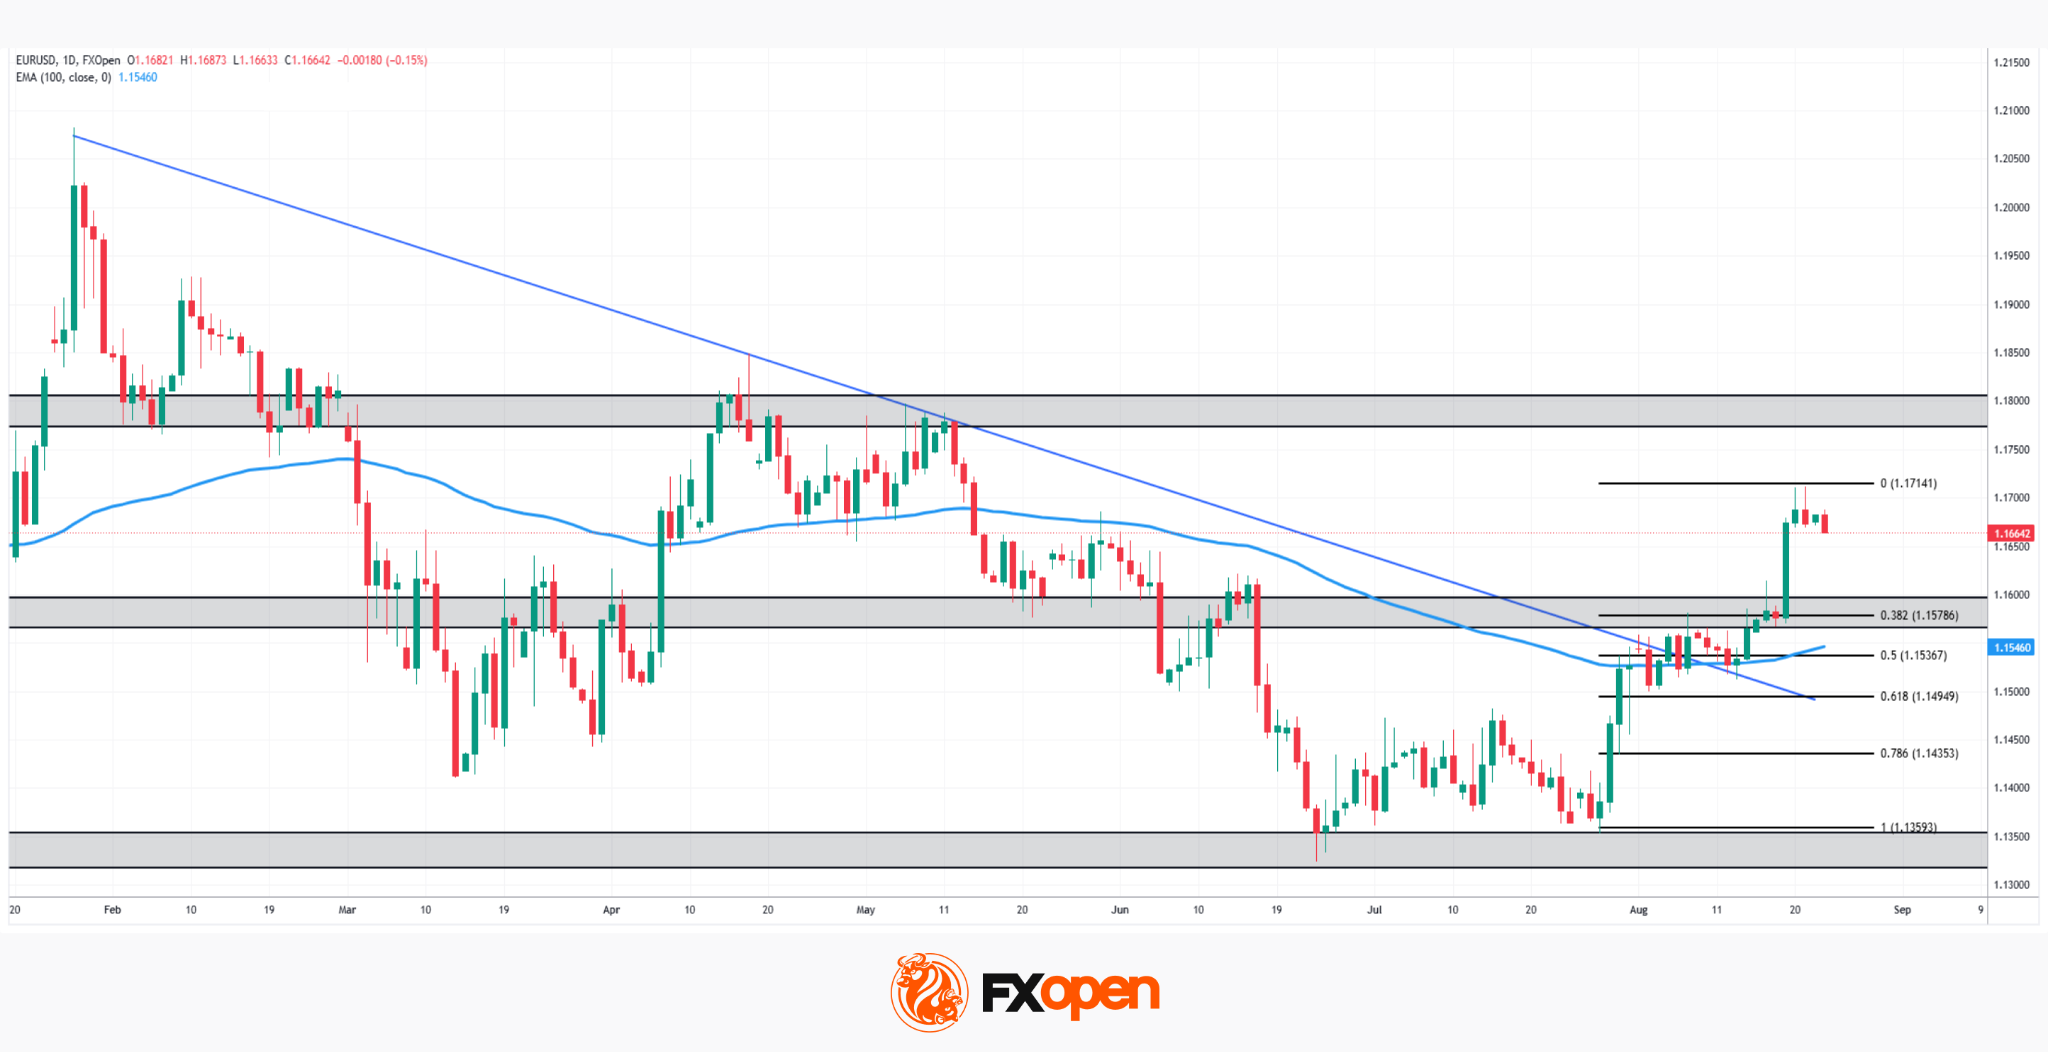
As the daily EUR/USD chart shows, the pair has broken decisively above the descending trendline that had capped price action since the February highs, marking a significant shift in the medium-term structure.
The pair is now trading around 1.1665, comfortably above both the 100-period EMA at 1.1546 and the 0.382 Fibonacci retracement at 1.1579. The breakout has also lifted EUR/USD away from the 1.1537–1.1495 support area, leaving the 1.1714 Fibonacci resistance level as the next major test.
Bullish Scenario
If buyers can maintain control above the 1.1579 Fibonacci level and the 100-period EMA, the bullish structure remains intact.
A break above 1.1714 would open the way towards the 1.1775–1.1800 resistance zone, where previous price action has repeatedly stalled. A sustained move above this area would strengthen the case for a broader recovery and suggest that the longer-term downtrend may have been decisively reversed.
Bearish Scenario
Conversely, a rejection at 1.1714 followed by a break below 1.1579 would weaken the current setup and expose the 100-period EMA around 1.1546, which is closely aligned with the 0.5 Fibonacci level at 1.1537.
A deeper decline through this confluence would bring the 0.618 retracement at 1.1495 into focus, followed by 1.1435 and the 0.786 Fibonacci level as the next downside references.
With EUR/USD testing major Fibonacci resistance after breaking above its descending trendline, the key question is whether buyers can turn the breakout into a sustained advance towards 1.1800, or whether resistance will once again send the pair back towards its key support zone.
Trade over 50 forex markets 24 hours a day with FXOpen. Take advantage of low commissions, deep liquidity, and spreads from 0.0 pips (additional fees may apply). Open your FXOpen account now or learn more about trading forex with FXOpen.
This article represents the opinion of the Companies operating under the FXOpen brand only. It is not to be construed as an offer, solicitation, or recommendation with respect to products and services provided by the Companies operating under the FXOpen brand, nor is it to be considered financial advice.
Crypto World
XRP could rise 570% short-term to $10; XRPPower launches automated trading with up to $17,000 daily earnings


Disclosure: This article does not represent investment advice. The content and materials featured on this page are for educational purposes only.
XRP’s volatility is driving interest in XRPPower, which promotes automated yield plans as an alternative to relying on price gains.
Summary
- XRP’s volatile price history has renewed interest in its potential to reach $10, though market conditions will determine future gains.
- XRPPower promotes automated yield plans powered by AI, allowing users to participate in digital assets without relying solely on price gains.
- XRPPower highlights multi-layer security, automated monitoring, and transparent plan information as it expands its digital asset services.
XRP has recently attracted market attention again. Data shows that XRP reached an all-time high of approximately $3.65 in July 2025, while the price briefly fell to around $0.98 in 2026 before rebounding to around $1.50, indicating continued market volatility.
As the price gradually stabilizes, some market analysts are beginning to focus on XRP’s future upside potential. From approximately $1.50, reaching $10 would represent a nearly 570% increase. However, $10 is a market prediction target, not a fixed price; the actual price movement will depend on market demand, liquidity, and the overall crypto market environment.
For XRP holders, while they can profit from price increases, they also bear the risk of market downturns. Therefore, some users are starting to look at automated digital asset services that don’t solely rely on price increases.
Against this backdrop, XRPPower launched an automated yield program, providing users with a new way to participate in digital assets through AI technology and an automated system. According to information published by the platform, the maximum daily return for these plans can reach $17,000, with actual returns depending on the specific contract chosen and the platform’s rules.
How to get started with XRPPower?
After learning about XRPPower, users can complete account setup and explore platform features by following these steps:
01|Create a personal account
02|Understand platform plans
After logging into your account, view the currently available yield plans and choose a suitable plan based on your needs. It is recommended to understand the corresponding period, rules, fees, and risks before participating.
03|Choose supported digital assets
XRPPower supports mainstream cryptocurrencies including BTC, XRP, and ETH. Specific usable assets and payment methods are subject to the information currently displayed on the platform.
04|View account records
According to the rules of the plan you participate in, the relevant returns will be automatically returned to your account balance daily. Users can withdraw directly or continue to purchase other contracts to earn more returns.
05 | Share invitation link
Each user can share the platform using their exclusive invitation code or link. Eligible friends who complete registration and related operations will receive invitation rewards according to the current event rules, with a maximum reward of $100,000.
Beginner’s guide to earning contracts
Investment Amount: $1,000, Investment Period: 7 days, Daily Yield: $13.2, Principal Refund at Maturity: $1,000
Investment Amount: $5,000, Investment Period: 15 days, Daily Yield: $70.5, Principal Refund at Maturity: $5,000
Click to view all contract earnings
XRPPower smart system: Secure architecture and transparent services
Multi-layered security mechanisms protect accounts and data.
XRPPower strengthens security management at multiple levels, including accounts, data, and system infrastructure. It employs technologies such as SSL/TLS encryption, 2FA dual authentication, cold and hot wallet isolation, and multi-signature, and continuously optimizes access management and data protection mechanisms.
Intelligent monitoring ensures more stable system operation.
The platform combines AI analytics and automated monitoring technologies to continuously identify system status, data changes, and abnormal activity. Combined with DDoS protection and WAF (Web Application Firewall) cybersecurity measures, it enhances the platform’s overall protection capabilities.
Clear information makes the platform easier for users to understand.
XRPPower continuously optimizes information display and service processes, clearly explaining relevant functions, scheme rules, cycles, participation conditions, and risk warnings to help users make informed choices.
Continuous upgrades drive the development of digital asset services.
XRPPower will continue to optimize its AI technology, system security, risk control, and infrastructure to improve platform stability and provide a more convenient and clear digital asset service experience for global users.
About XRPPower
Since its launch in 2023, XRPPower has continuously explored the integration of digital asset services and artificial intelligence technologies. Currently, the platform has over 3 million registered users, serving more than 180 countries and regions worldwide.
Register for XRPPower for free now to learn about the platform’s features and explore the new experiences brought by the integration of AI and digital assets.
For more information, visit the official website.
Disclosure: This content is provided by a third party. Neither crypto.news nor the author of this article endorses any product mentioned on this page. Users should conduct their own research before taking any action related to the company.
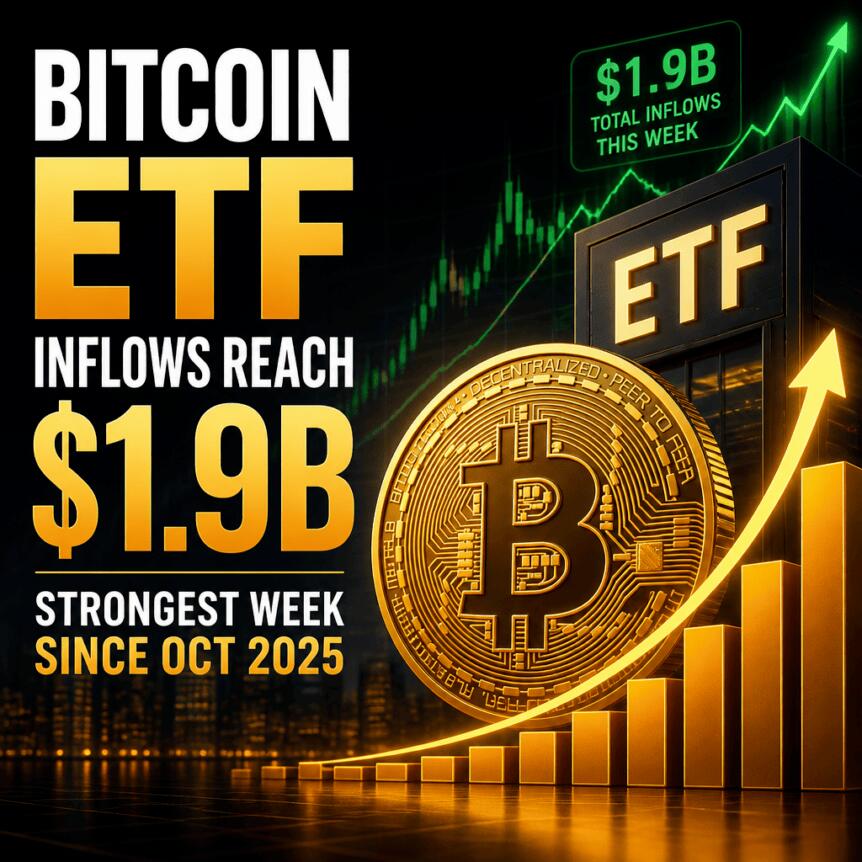
US spot Bitcoin exchange-traded funds (ETFs) posted their best weekly inflows in nearly 10 months, drawing close to $2 billion as Bitcoin’s price surged over the same period. According to SoSoValue data, the week ending Friday saw $1.92 billion in net inflows—the strongest result since early 2026.
The comeback in demand appears to have been broad rather than isolated. ETF analyst Nate Geraci said on Sunday that spot Ether ETFs also attracted roughly $700 million, with Bitcoin and Ether funds each posting their strongest weekly inflows since October 2025.
Key takeaways
- US spot Bitcoin ETFs pulled in $1.92 billion in net inflows for the week ending Friday, their strongest weekly performance in nearly 10 months, per SoSoValue.
- Bitcoin rose more than 20% over the week, briefly breaking above $79,000 after starting near $63,000, according to CoinGecko.
- Despite last week’s rally, US spot Bitcoin ETFs remain down for 2026 with about $2.91 billion in net outflows so far.
- BlackRock’s IBIT led the rebound with about $1.33 billion in net inflows across five consecutive trading days, according to Farside Investors.
Inflows rebound as Bitcoin accelerates
The latest ETF surge arrived after a stretch of uneven flows that had weighed on sentiment around the category. SoSoValue’s weekly figures show that capital returned quickly once spot Bitcoin gained momentum, with the week ending Friday delivering $1.92 billion in net inflows.
CoinGecko data cited in the report shows Bitcoin climbed more than 20% last week, moving from roughly $63,000 to briefly exceed $79,000 on Friday. That price strength matters because it often changes investor behavior at the margin—buyers become more willing to allocate into spot products when returns are visibly improving.
Geraci’s comments suggest the demand was not limited to Bitcoin alone. He said spot Ether ETFs drew about $700 million, and that both Bitcoin and Ether funds logged their strongest weekly inflows since October 2025.
2026 still shows persistent outflows
While last week was a clear improvement, the broader picture for 2026 remains negative. The report notes that US spot Bitcoin ETFs are down overall by about $2.91 billion in net outflows so far this year.
Flow patterns have been especially weak around mid-year. The funds recorded their heaviest monthly outflows in June at $4.51 billion, following $2.43 billion in withdrawals in May. In contrast, August has turned more supportive, with $2.38 billion in net inflows through Friday, making it the strongest inflow month of 2026 to date.
That contrast is important for investors watching whether the ETF complex is transitioning from a sell-the-rally posture to a sustained buying trend. A single strong week can happen within a broader downcycle, but sustained monthly inflows would signal a more durable shift.
The October 2025 inflow cycle—and why comparisons matter
Earlier ETF strength also preceded a major market shock. During the last significant inflow wave in October 2025, the funds attracted $3.42 billion. The report links that period to the Oct. 10 crypto market crash, which it says triggered the largest liquidation event in the industry’s history—wiping out about $19 billion in leveraged positions within 24 hours.
Bitcoin’s drawdown over the same broad interval provides additional context. Since Oct. 6, when the asset traded near $124,700, the report states Bitcoin has fallen roughly 38%.
These comparisons don’t imply a repeat outcome, but they do highlight a recurring dynamic: ETF inflows can accelerate during bullish price phases, yet high leverage in the broader market can still produce abrupt reversals. For traders and portfolio managers, the practical takeaway is that ETF flow strength should be assessed alongside overall market positioning and volatility, not treated as a standalone predictor.
IBIT drives the resurgence with shifting daily momentum
The rebound last week was heavily influenced by BlackRock’s IBIT. According to Farside Investors data cited in the report, IBIT accounted for about $1.33 billion in net inflows over five consecutive trading days.
The product’s daily flow profile also showed a noticeable ramp-up before cooling. The report states IBIT’s daily inflows rose from $160.2 million on Monday to $503 million on Thursday, before easing to $239.3 million on Friday.
Bloomberg ETF analyst Eric Balchunas characterized the flow sequence as a “classic Flipping the Bird pattern” and suggested it represented a bullish signal. While interpretations of daily flow patterns can vary, the market relevance is straightforward: when large allocations repeatedly enter an ETF on consecutive sessions, it often reflects active demand rather than a one-day reaction.
For readers tracking whether this week’s inflow surge is the start of a broader trend, IBIT’s trajectory is likely to remain a key point of observation—both in terms of whether consecutive inflow days persist and whether the category-wide momentum extends beyond one or two products.
Going forward, investors should watch whether August’s inflow strength continues and whether the weekly pattern holds in the coming sessions; the category is still net-negative for 2026 overall, so follow-through beyond a single standout week will be the clearest test of whether demand is truly regaining durability.


Key takeaways
- Bitcoin trades around $77,000 after gaining more than 23% last week, its strongest weekly performance since March 2023.
- Investors realized $1.72 billion in profits on Friday, the highest daily total since November 2024.
- US spot Bitcoin ETFs attracted $1.92 billion in weekly inflows, their strongest showing since October 2025.
- BTC faces immediate resistance at $78,490 and $80,000, with additional upside targets at $81,059, $87,599 and $88,990.
Bitcoin is trading around $77,000 on Monday after surging more than 23% last week, its strongest weekly gain since mid-March 2023.
The rally followed the US Treasury’s announcement that it would expand its debt buyback operations, improving sentiment across cryptocurrency markets.
Strong institutional demand also supported the advance, with US spot Bitcoin exchange-traded funds recording their largest weekly inflows since October 2025.
However, on-chain data suggests some investors are taking profits as BTC approaches the psychologically important $80,000 level.
That selling activity could result in a temporary consolidation phase or a short-term pullback before Bitcoin attempts another move higher.
Bitcoin investors realize $1.72 billion in daily profits
CryptoQuant data shows Bitcoin holders realized approximately $1.72 billion in profits on Friday.
The figure marked the highest daily realized profit total since late November 2024. Last week’s rapid price increase moved many investors back into profitable territory, encouraging some holders to sell and secure their gains.
Historically, sharp increases in realized profits can precede a period of consolidation or a temporary correction as additional supply enters the market.
The profit-taking does not necessarily signal the end of Bitcoin’s broader recovery. However, it does indicate that the market may face increased selling pressure near major resistance levels.
Despite the increase in profit-taking, Bitcoin’s underlying spot demand has improved. CryptoQuant’s apparent demand metric has moved into positive territory after remaining negative since late February.
The shift suggests net buying interest has strengthened, potentially providing support even as some investors reduce their positions.
A sustained improvement in spot demand would help offset selling pressure and support the case for a continuation of Bitcoin’s rally.
However, traders will be watching whether buyers can maintain that momentum while BTC consolidates below $80,000.
Institutional investors played a significant role in last week’s price advance. US spot Bitcoin ETFs recorded approximately $1.92 billion in net inflows, according to SoSoValue data.
The figure represented the highest weekly inflow so far this year and the strongest since mid-October 2025.
Continued inflows could provide additional support for Bitcoin as it attempts to overcome nearby resistance.
Conversely, a slowdown in institutional demand may make it more difficult for BTC to sustain its recent gains, particularly while short-term momentum appears stretched.
BTC caces immediate resistance at $78,490
Bitcoin recently tested the 61.8% Fibonacci retracement level at $78,490. The level is derived from the move between the August 2024 low near $49,000 and the October 2025 record high of $126,199.
A weekly close above $78,490 would strengthen the bullish technical outlook and could open the way toward the 50-week Simple Moving Average at $81,059.
Before reaching that level, Bitcoin must also clear the psychological resistance at $80,000.
If buyers push BTC above both barriers, the next major upside target would be the 50% Fibonacci retracement level at $87,599.
The 100-week SMA near $88,990 represents another significant resistance level within the same price zone.
Bitcoin remains above its 200-week SMA at $64,571 following its recent breakout from a prolonged consolidation phase.
The weekly Relative Strength Index stands near 55, comfortably above the neutral level of 50.
This reading suggests that momentum has improved without yet reaching an extreme on the weekly timeframe.
The weekly Moving Average Convergence Divergence indicator also remains bullish after recording a positive crossover in mid-July.
Rising green histogram bars suggest that upward momentum continues to build. Together, these indicators support the possibility of additional gains if Bitcoin can overcome resistance between $78,490 and $81,059.
The daily chart presents a more cautious picture despite Bitcoin’s strong overall structure.
BTC trades well above its 50-day, 100-day and 200-day Exponential Moving Averages, located at $66,786, $67,415 and $71,781, respectively.
However, the daily RSI has climbed to approximately 79, placing Bitcoin firmly in overbought territory.
Such readings do not automatically imply an imminent reversal, but they often indicate that a market may need to consolidate or retrace after a sharp advance.
The daily MACD remains positive, confirming that bullish momentum is still in place, although the strength of the recent move leaves BTC vulnerable to profit-taking.
If Bitcoin pulls back, the 200-day EMA near $71,781 represents the first major technical support level.

The psychological $70,000 mark is another important area that could attract buyers if selling pressure increases.
A deeper decline would expose the 100-day EMA at $67,415 and the 50-day EMA at $66,786.
The nearby horizontal support at $66,500 strengthens that broader demand zone. If those levels fail, Bitcoin could fall toward the next major support area around $62,300.
For now, BTC’s immediate outlook depends on whether buyers can absorb profit-taking and push the price above $78,490 and $80,000. A successful breakout would keep $81,059 and the $87,599 to $88,990 region in focus.


Households shown bitcoin’s prior-year return were 23% more likely to report owning crypto in a follow-up survey.

XRP has moved from under $1 to around $1.50 in less than two weeks, crowding news headlines with its rally. Now, is it time to bank gains into strength, or keep full exposure to a trade that is increasingly running on leverage rather than fresh spot demand?
XRP briefly touched $1.69 on August 22 before retreating toward the $1.50–$1.53 range. By August 23, the token was at $1.48, up 47.77% over seven days, with a market cap of $92.95 billion and $22.45 billion in daily volume.

The rally is also riding a strong market backdrop. Bitcoin climbed from $62K to $77K over the same window, while the crypto Fear & Greed Index reached 67, classified as Greed. XRP has simply moved much faster, with spot ETF inflows adding another layer of demand.
Discover: The Best Token Presales
The Overbought Signal and a Long Heavy Derivatives Book
Spot XRP ETFs recorded $18.38 million in net inflows on August 21, with Bitwise accounting for about $16.89 million. Weekly inflows approached $40 million, reportedly the strongest week for XRP ETFs since May. Cumulative net inflows are near $1.55 billion.
That gives XRP a legitimate spot demand story. The problem is that tens of millions in weekly ETF inflows remain small compared with a market cap above $90 billion. The rally, therefore, appears to be getting help from both real demand and increasingly aggressive derivatives positioning.

The technical picture adds another warning. One widely cited reading placed daily RSI near 85.4, deep into overbought territory, while other estimates put it between 70 and 83. Neither guarantees a reversal, but both show how far XRP has moved in a very short period.
Leverage tells the more concerning story. XRP futures open interest jumped 34.49%, or roughly $939 million, to about $3.66 billion over seven days. Binance positioning data showed 72.1% of accounts long versus 27.9% short.
That is a crowded trade. Twenty-four-hour liquidations reached $70.74 million, with longs accounting for $54.68 million, or 77.3% of the total. Three-day liquidations reached $145.15 million, while the largest single wipeout hit $50.27 million on August 22.
Funding also remained positive at 0.01% every four hours, equivalent to an annualized rate near 24.94%. Longs are still paying a premium to stay in the trade even after taking heavy losses.
Short covering helped fuel the earlier move, too. At present, roughly $2.2 million in short positions are at risk as XRP pushed through $1.40 to $1.50. But forced short covering is less durable than unleveraged spot buying.
That makes taking some profit increasingly reasonable. A 20% to 30% trim around current levels would lock in part of the gain while retaining exposure to a possible move toward $1.65 to $1.70 and potentially $2.
Trade XRP on Bybit and Get a Chance to Win Our $1,000 USDT Airdrop
Forget The News, XRP Still Has a Structural Bull Case
The bullish case is not purely technical noise. Ripple CEO Brad Garlinghouse joined the inaugural meeting of the CFTC’s Innovation Advisory Committee alongside representatives from major financial institutions. He described the group as an “Olympic roster of crypto.”
That is notable for XRP, which spent years fighting an SEC enforcement action. Still, the committee seat is a policy forum role, not a court ruling or formal legal classification. The SEC’s new “Regulation Crypto Assets” proposal also does not settle the separate Ripple case.
The CLARITY Act remains another major variable. The legislation could classify XRP as a digital commodity under CFTC oversight, but political momentum does not guarantee passage. That uncertainty leaves the rally exposed to disappointment if expectations run ahead of reality.
RLUSD adds to the Ripple ecosystem story, with its market cap growing to roughly $2.1 billion from about $1.5 billion at the start of the year. However, apart from the news, this does not prove direct demand for XRP because the two assets serve different functions.
However, after a 50% rally in less than two weeks, taking something off the table is not the same as turning bearish. It simply means keeping exposure to the upside while making sure the market does not take back gains that are already there.
Discover: The Best Crypto to Diversify Your Portfolio
The post XRP News: Price Rally, Take Profit or Let It Run? appeared first on Cryptonews.
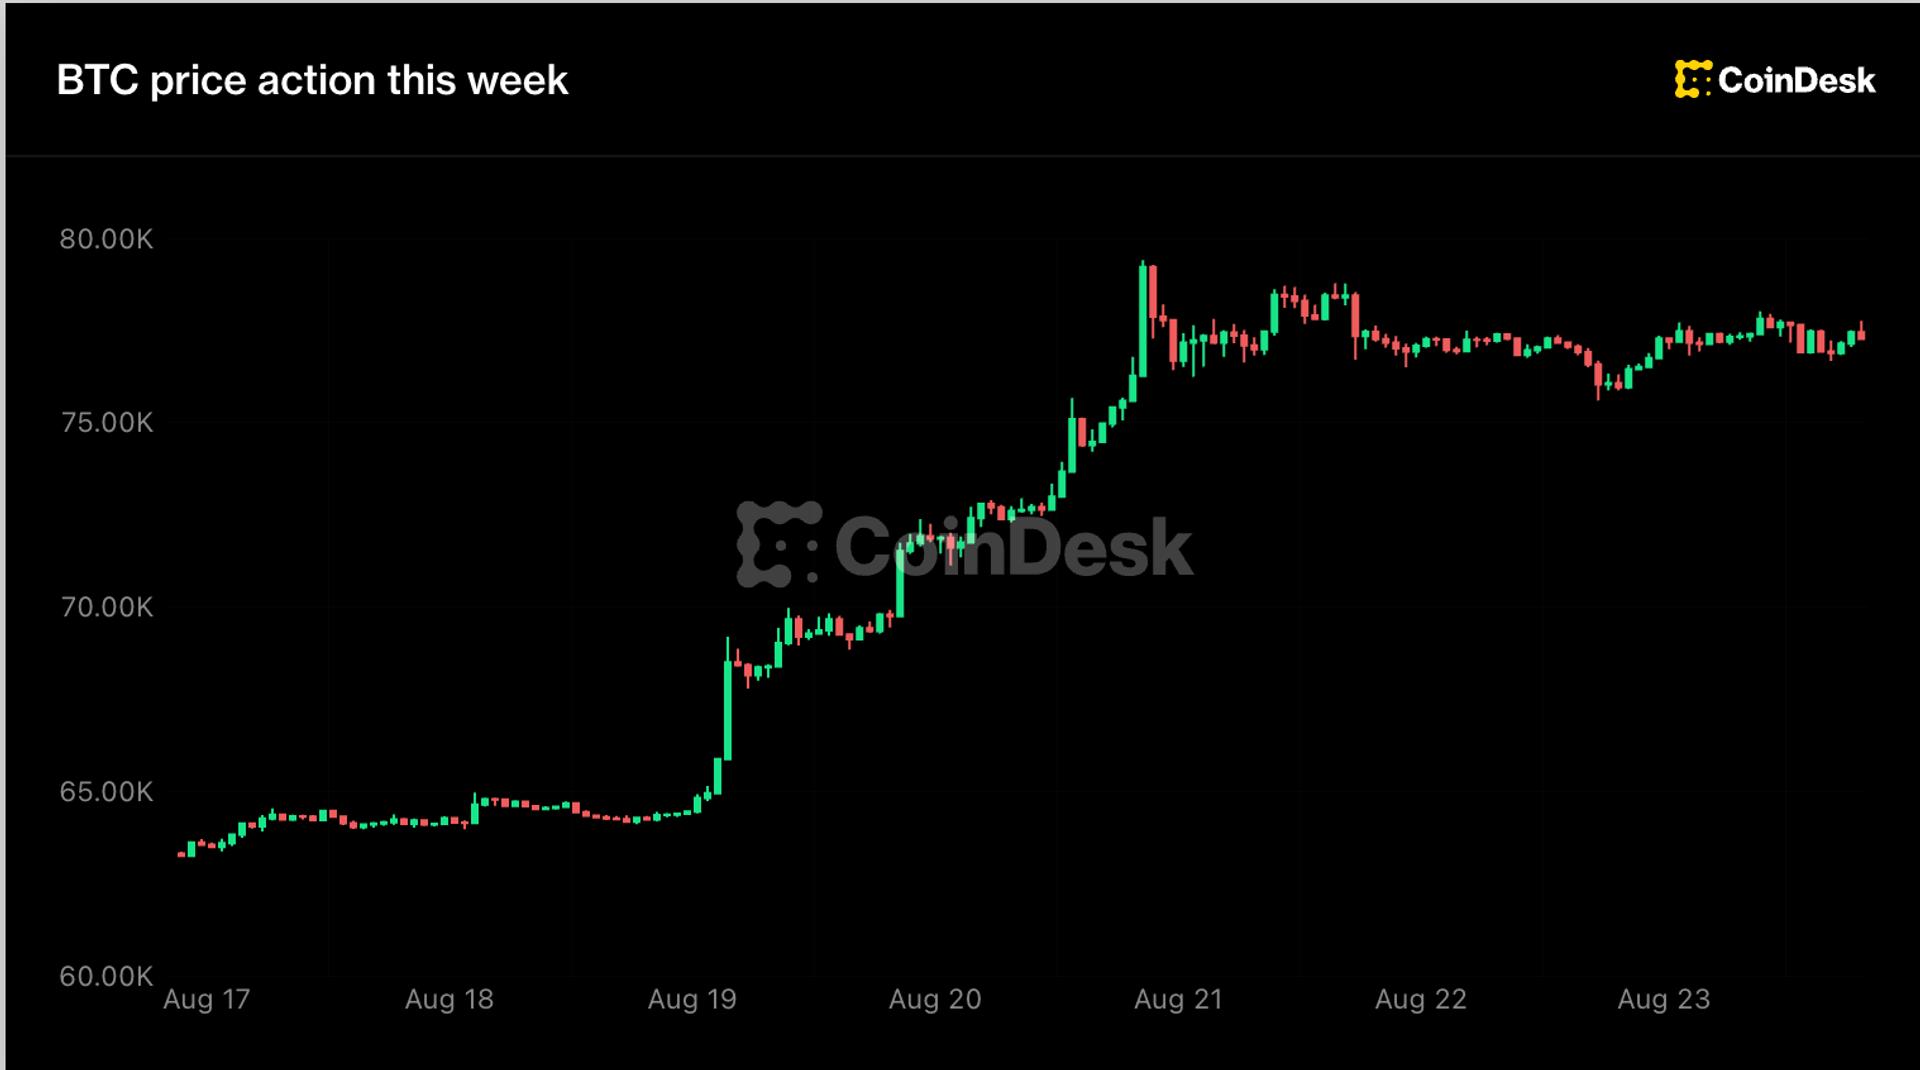
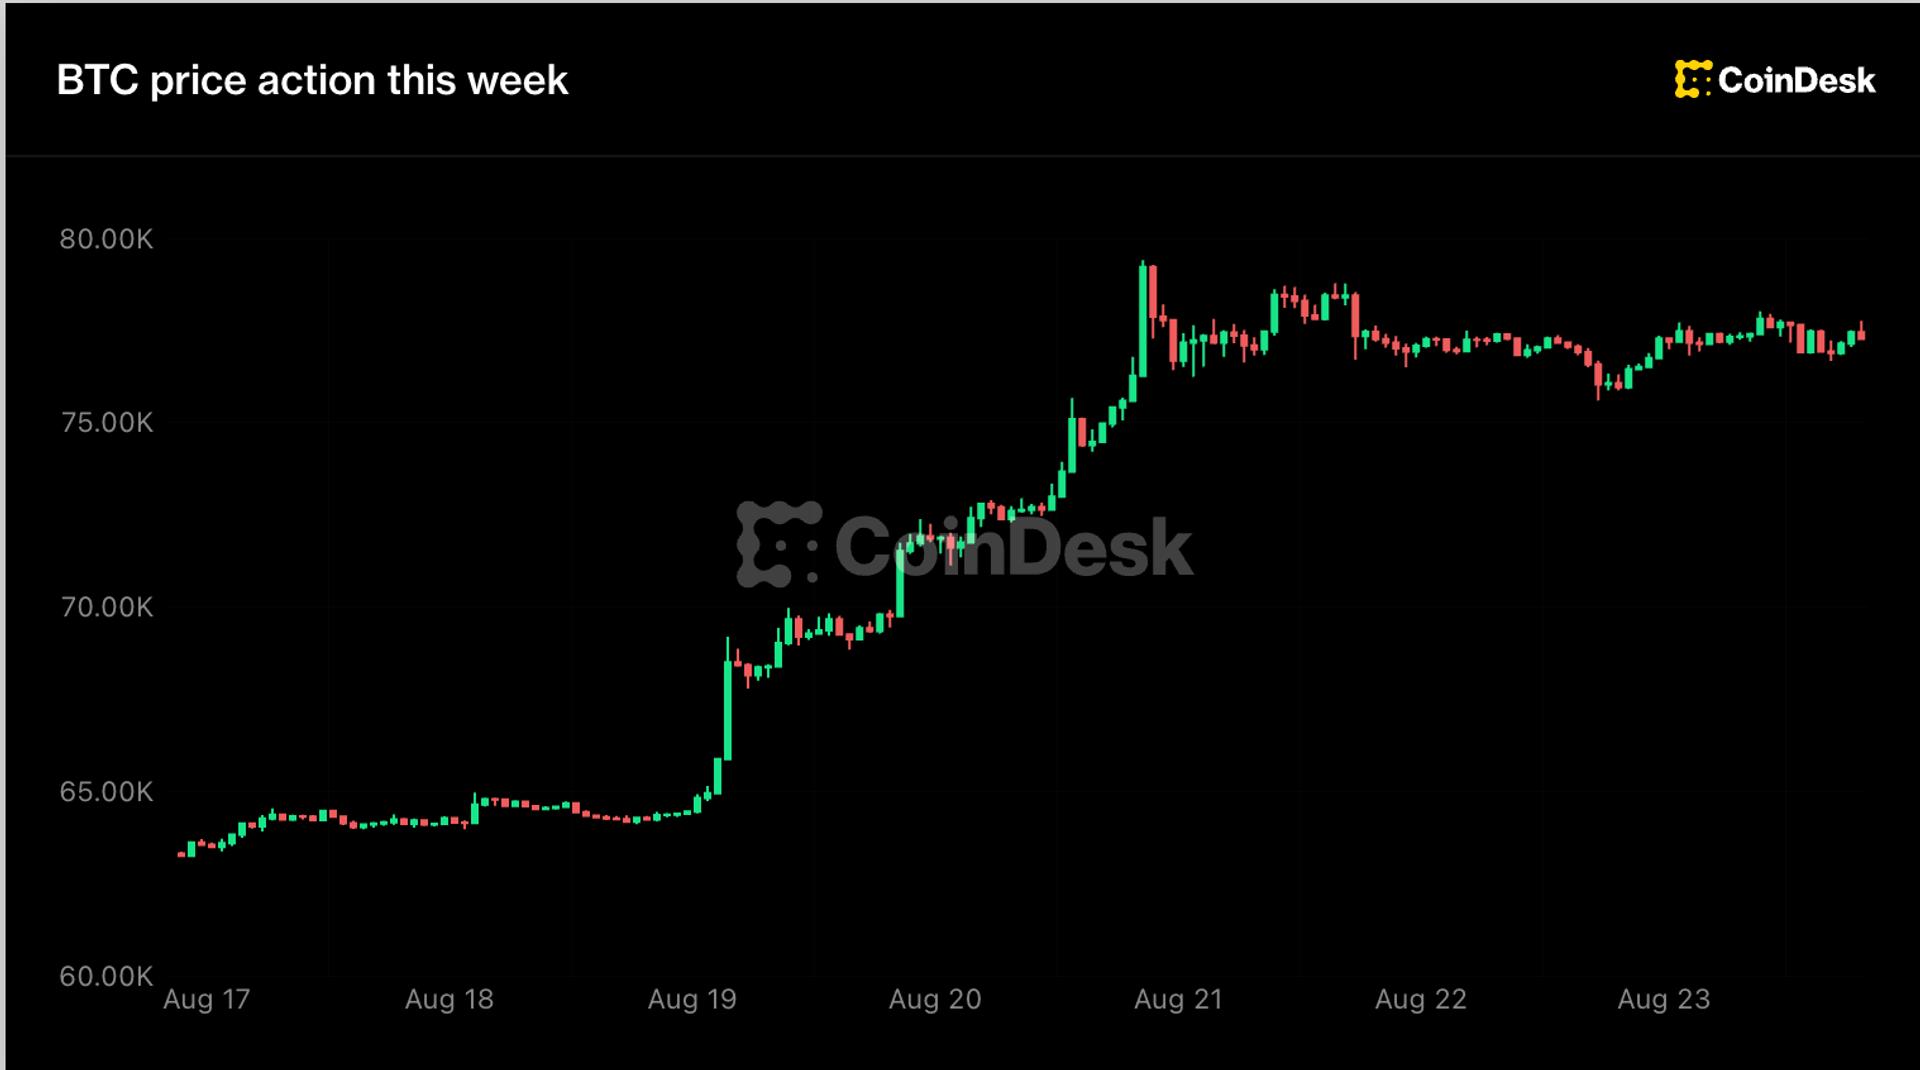
Bitcoin holds its gains near $77,000 after a 22% week, while last week’s biggest altcoin winners steady, with focus turning to Fed Chair Warsh’s Jackson Hole debut.
US spot Bitcoin exchange-traded fund (ETF) inflows surged last week after months of uneven flows, with investors pouring nearly $2 billion into the products amid a surge in Bitcoin’s price.
Bitcoin ETFs recorded $1.92 billion in net inflows during the week ending Friday, marking their strongest weekly performance in nearly 10 months, according to SoSoValue data.
ETF analyst Nate Geraci said Sunday that spot Ether ETFs also attracted about $700 million. He added that Bitcoin and Ether funds each posted their strongest weekly inflows since October 2025.
The renewed ETF demand came amid Bitcoin jumping more than 20% last week, briefly surging past $79,000 on Friday after starting the week near $63,000, according to CoinGecko.
Bitcoin ETFs remain in the red for 2026
Despite the latest surge, US spot Bitcoin ETFs have recorded about $2.91 billion in net outflows so far in 2026.
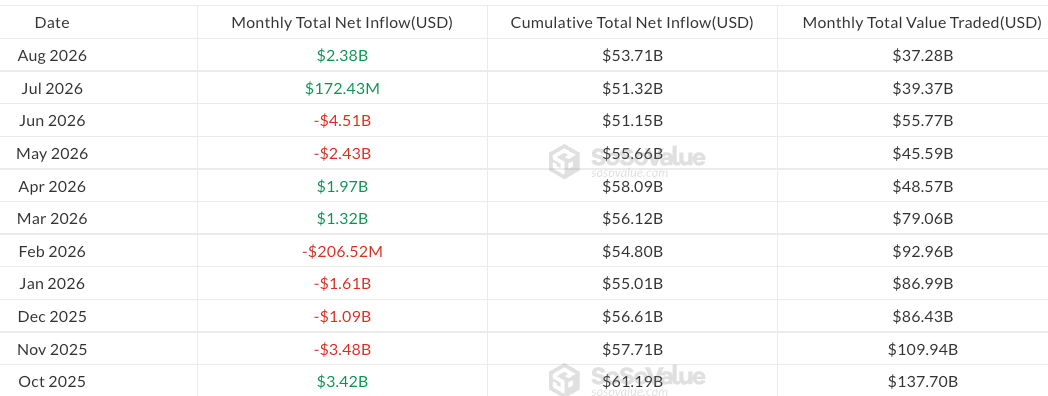
The funds saw their heaviest monthly outflows in June at $4.51 billion, following $2.43 billion in withdrawals in May. August has brought $2.38 billion in net inflows through Friday, making it the strongest month for inflows so far this year.
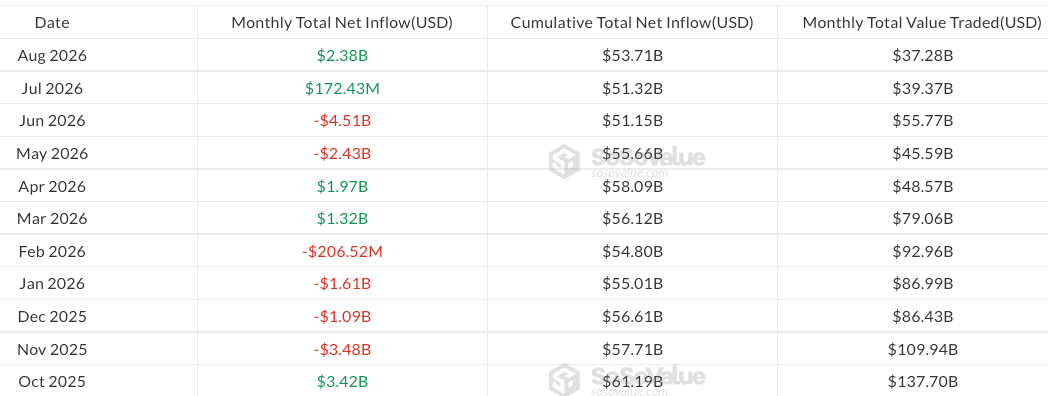
Monthly spot Bitcoin ETF flows since October 2025. Source: SoSoValue
During the last major inflow wave in October 2025, the funds attracted $3.42 billion. The October inflows preceded the Oct. 10 crypto market crash, which triggered the largest liquidation event in the industry’s history, wiping out roughly $19 billion in leveraged positions within 24 hours.
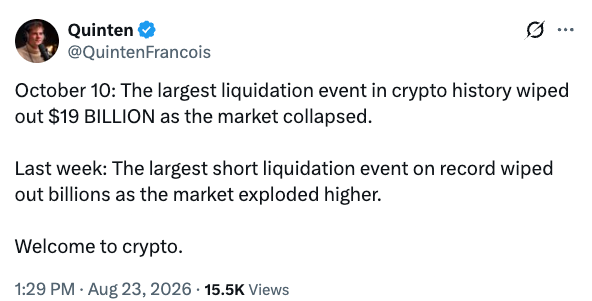
Source: Quinten
Since Oct. 6, when Bitcoin traded near $124,700, its price has plummeted roughly 38%.
BlackRock’s IBIT flashes a “bullish signal”
BlackRock’s iShares Bitcoin Trust ETF (IBIT) was responsible for much of last week’s resurgence, attracting about $1.33 billion in net inflows across five consecutive trading days, according to Farside Investors data.
IBIT’s daily inflows rose from $160.2 million on Monday to $503 million on Thursday, before easing to $239.3 million on Friday.
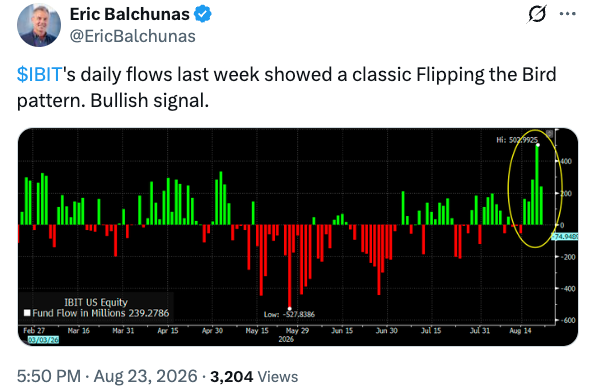
Source: Eric Balchunas
Bloomberg ETF analyst Eric Balchunas took to X to highlight what he described as a “classic Flipping the Bird pattern” in IBIT’s daily flows, adding that he viewed it as a bullish signal.
Magazine: We are so back! Bitcoin’s 23% rally on US debt policy: Hodler’s Digest
Crypto World
Gate Releases Latest Proof of Reserves Report: Total Reserve Ratio Reaches 127%; Total Reserves Exceed $8.215 Billion
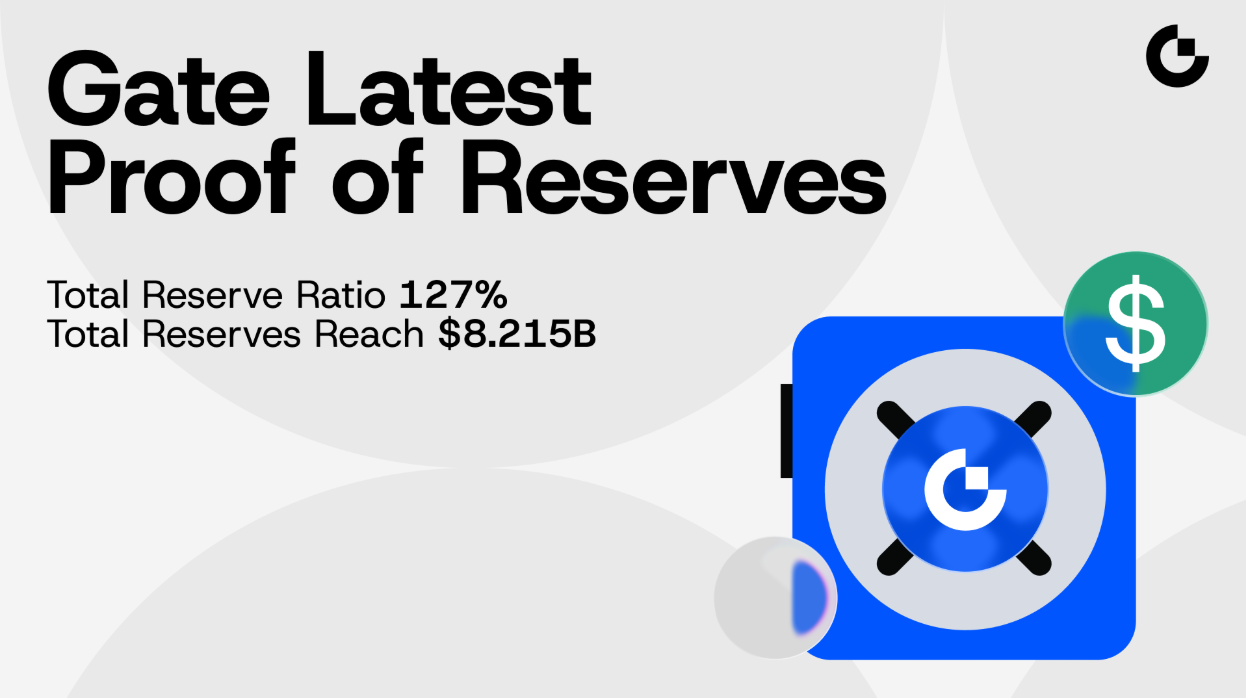

According to the official announcement, Gate has released its latest Proof of Reserves report. As of August 19, 2026, Gate’s total reserves increased to $8.215 billion, with an overall reserve ratio of 127%, remaining well above the industry security benchmark of 100%. The ample surplus reserves further strengthen the platform’s ability to withstand market volatility and potential liquidity risks, reflecting its robust asset management and risk control capabilities.
Reserve holdings for core assets continued to grow. BTC user holdings increased from 21,557 BTC in the previous report to 22,436 BTC, while Gate’s reserve holdings rose from 26,775 BTC to 27,550 BTC, representing an excess reserve ratio of 22.79%. ETH user holdings increased from 374,348 ETH to 375,429 ETH, while the platform’s reserve holdings grew from 456,798 ETH to 458,203 ETH, with an excess reserve ratio of 22.05%.
For stablecoins, total user assets across USDT, USDC, USD1, and GUSD increased from $1.336 billion in the previous report to $1.578 billion, while the platform’s corresponding reserves rose from $1.59 billion to $1.761 billion. This represents an aggregate reserve ratio of 111.63% and an excess reserve ratio of 11.63%.
In addition, major assets such as GT and XRP maintained reserve ratios well above the 100% benchmark, reaching 131.15% and 116.09%.
Gate has consistently regarded asset security and transparent governance as fundamental to the platform’s long-term development. As one of the early platforms in the industry to advance proof-of-reserves transparency, Gate continues to improve its publicly accessible and verifiable reserve mechanisms. Through technologies and solutions including zero-knowledge proofs (ZKP), Merkle tree verification, hot and cold wallet management, and user asset snapshots, Gate enhances the transparency and verifiability of reserve disclosures. At the same time, Gate continues to strengthen its internal risk management framework, implementing multiple measures such as asset segregation, access control, and security audits to enhance asset security and operational management capabilities, supporting the platform’s long-term and stable operations.
Building on its robust security and infrastructure foundation, Gate continues to expand its product ecosystem and global asset services. The platform now serves more than 59 million users worldwide and supports trading in over 4,900 crypto assets and more than 12,800 stocks and ETFs, with its stock business spanning four major markets: U.S., Hong Kong, Korean, and Japanese equities. On this basis, Gate continues to expand its stock and related financial product offerings, including Pre-IPOs, IPO Access, and gStocks tokenized stocks, providing users with diversified investment options across different stages and asset classes.
Looking ahead, Gate will continue to advance the development of its proof-of-reserves transparency, security infrastructure, and risk management systems, while continuously optimizing its product ecosystem and global service capabilities around user needs. As digital assets and traditional financial markets become increasingly integrated, Gate will continue to explore more asset classes and trading scenarios, building a more open, diversified, one-stop asset trading and management experience for users worldwide through a transparent, secure, and efficient service framework.
Details can be found here.
About Gate
Gate, founded in 2013 by Dr. Han, is one of the world’s leading cryptocurrency and integrated financial services platforms. Serving over 59 million users globally, it supports trading across 4,900+ digital assets and 12,800+ stock assets, while providing access to a comprehensive range of TradFi assets, including metals, stocks, indices, forex, and commodities, delivering users a one-stop, multi-asset trading experience and blockchain-related services. As an industry benchmark, Gate was among the first platforms to implement 100% Proof of Reserves. Its ecosystem includes Gate Wallet, Gate Ventures, Gate for AI Agent, and a wide range of products and services.
For more information, please visit: Website | X | Telegram | LinkedIn| Instagram | YouTube
Disclaimer:
This content does not constitute an offer, solicitation, or recommendation. You should always seek independent professional advice before making investment decisions. Note that Gate may restrict or prohibit certain services in specific jurisdictions. For more information, please read the User Agreement.
The post Gate Releases Latest Proof of Reserves Report: Total Reserve Ratio Reaches 127%; Total Reserves Exceed $8.215 Billion appeared first on BeInCrypto.

What our eschatologies excuse
Three tech leaders, three different pictures of humanity’s ultimate destiny—resignation, survivalism, apocalypticism. But I would assert that they share the same consequences. For one, in each version, the future isn’t something we build together. It’s something they get to build on our behalf.
And notice who is left out of each version. Altman’s future has room for “great companies” and “expanding human capability,” but arguably less concern for the people whose jobs AI might make irrelevant in the process. Musk’s future may have some room for wealthy people who can book a seat on a colony ship but less for the rest of us. Thiel’s future has room for innovation, but little for those who want to question what we are innovating for and towards. In every case, the very people who have a stake in the future are not part of building that vision of that future.
This also helps explain why some tech bros seem so disinterested in philanthropy or profit-sharing. If you genuinely believe the human era is ending and something else is taking its place, it stands to reason you have no need to feel obligated to the people around you. Why invest in public health, or housing, or building a robust civil society, if the relevant future doesn’t include most of the people who’d benefit? Why fund a school, or fix a subway, or pay taxes toward anything you won’t personally need in twenty years? This eschatology doesn’t just fail to produce ethics. It actively excuses their absence. Empathy stops looking like a virtue and starts looking like a waste of resources on people who, in this version of the future, don’t really count.

At Close of Business podcast August 24 2026

EUR/USD Analysis: Is the Dollar Rally Really Over?

Race Across The World Contestant Jo Gardiner Has Died, Aged 61





![[KPOP IN PUBLIC] LISA - 'MONEY' | Cover by BN DANCE TEAM FROM VIETNAM](https://wordupnews.com/wp-content/uploads/2026/02/1770893501_maxresdefault-80x80.jpg)
-

 Fashion3 days ago
Weekend Open Thread: Madewell – Corporette.com
-

 Business6 days ago
SMA Solar Technology AG (SMTGY) Q2 2026 Earnings Call Transcript
-

 Crypto World2 days ago
anatomy of crypto’s biggest liquidation event since 2021
-

 Business2 days ago
Musk’s Tesla, SpaceX Confirm $16.8 Billion ‘Terafab’ Chip Plant as World’s Largest Building in Texas
-

 Tech6 days ago
Qwen3.8-27B runs frontier-class coding agents and reasoning locally, no cloud API required
-

 Crypto World6 days ago
OCC Greenlights Trump Family Crypto Firm for Trust Charter
-

 Politics2 days ago
6 months on, Irish renters crushed by effects of government housing bill
-
 NewsBeat2 days ago
The ‘Lucky Dip Gang’ causing carnage for clicks: After five thugs were killed speeding in the wrong direction on a motorway, GUY ADAMS investigates a sick new trend… and why police aren’t even allowed to pursue them
-

 Crypto World6 days ago
NAVI Prime launches institutional lending framework on Sui
-

 News Videos4 days ago
Don’t Leave Your Financial Future To Chance | August 19, 2026
-

 Tech5 days ago
GLM-5.3 hits the API at $1.4/$4.4 per million tokens
-
Tech6 days ago
5 Of The Most Reliable Car Brands To Consider If You’re Buying A Used SUV
-
 Crypto World6 days ago
Dow’s 3-Year Winning Run Isn’t a Crash Signal, Still 49% Odds of Double-Digit Gains
-

 Business6 days ago
Stock Market Today: Tech Futures Slide As Treasury Yields Jump; Nvidia, Micron, Sandisk Sell Off
-

 Tech7 days ago
Straight Up the Cliff, Yunnan’s New Fuyao Ladder Turns a Three-Hour Climb Into a 50-Second Ride for Students
-

 Tech6 days ago
Keychron K8 Ultra 8K review: a great value keyboard with comfort issues
-
 Tech6 days ago
Nvidia discloses $21B stake in SpaceX
-
Business6 days ago
Fabrinet (FN) Q4 2026 Earnings Call Transcript
-

 Business4 days ago
Five Below: Kids Discount Retailer Reaps Rich Rewards
-

 Business5 days ago
Marvell Shares Jump 7% as Google Chip Deal Confirms Custom AI Silicon Partnership, Analysts
You must be logged in to post a comment Login