


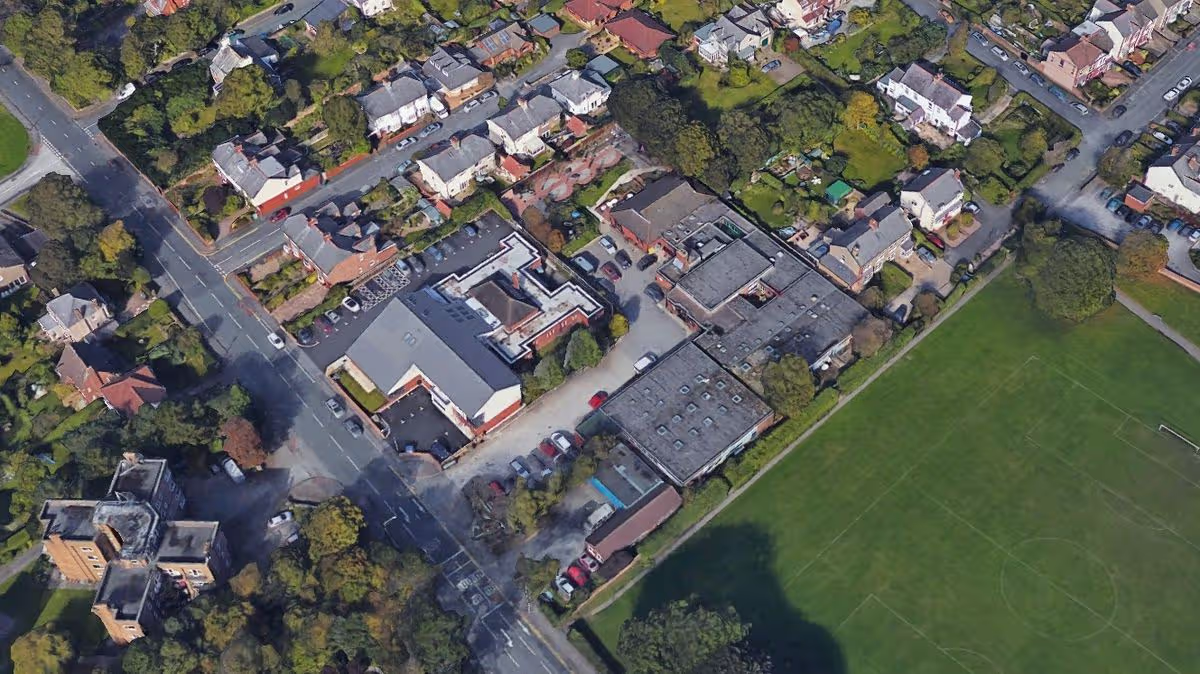
Heswall Day Centre approved for sale in September 2025

The Heswall Day Centre site(Image: Google Maps)
A Wirral Council building in a “prime location” less than half an hour from Liverpool is up for sale. People are being invited to send in offers for what could be a lucrative site for a developer.
Heswall Day Centre was approved for sale by senior councillors in September 2025. The centre on Telegraph Road, near the town’s Tesco was one of nine facilities providing adult social care services but closed in September 2024.
A council report said this was due to a heating failure with the building left in a dilapidated condition. The service had helped support 52 adults who have been moved to other facilities.
A survey carried out by the council found it would cost a significant amount of money to refurbish and bring it back into use, something the financially-struggling authority said it can’t afford. It was estimated over £500,000 will be needed to bring the building back into use while estimates for a full refurbishment of the building could have costed as much as £5.6m.
Before it closed in September 2024, the centre was closed earlier in the year to remove toxic asbestos from the building. When it reopened in July, further issues were found due to the condition.
In September, the heating failed and services were moved out while investigations took place. A report before councillors said the asbestos made things tricky as “the investigation and survey involved disturbing the sub-structure and piping where there were asbestos risks.”
The possible sale was criticised by two parents in June 2025 Peter Linnane and John Daby said the closure of Heswall had had a massive impact on their sons Mark and Ben. When he heard about the plans at the time, Peter said: “I was absolutely horrified. I couldn’t believe it.”
Now the centre has been put on the market. An advert for the 1.09 acre site said it “provides a prime redevelopment opportunity subject to the necessary planning consents” in a “prime location” and “may be suitable for various uses”. The site is bordered by the Heswall Ambulance Station as well as the Heswall and Pensby Medical Centre.
If sold, the sale could generate a significant sum of money for Wirral Council to spend on other projects. Heswall is one of the wealthiest areas in Wirral with an average house price of £488,645 and detached houses in the area selling on average for £632,015.
A brochure attached to the advert highlighted that it is 24 minutes from Liverpool city centre and 65 minutes from Manchester city centre by car. It is also six minutes from Heswall railway station, 10 minutes from Arrowe Park Hospital, 24 minutes from central Chester, and 40 minutes from Liverpool John Lennon Airport..
The document produced by Lambert Smith Hampton said: “The opportunity is located within a well-established suburban area with strong residential characteristics. Heswall is home to popular bars, restaurants, shops and coffee shops which results in the town being popular for locals and visitors alike.”
To find all the planning applications, traffic diversions, road layout changes, alcohol licence applications and more in your community, visit the Public Notices Portal.


You must be logged in to post a comment Login