


The West of England’s biggest film and TV studios is actually a money-generating service

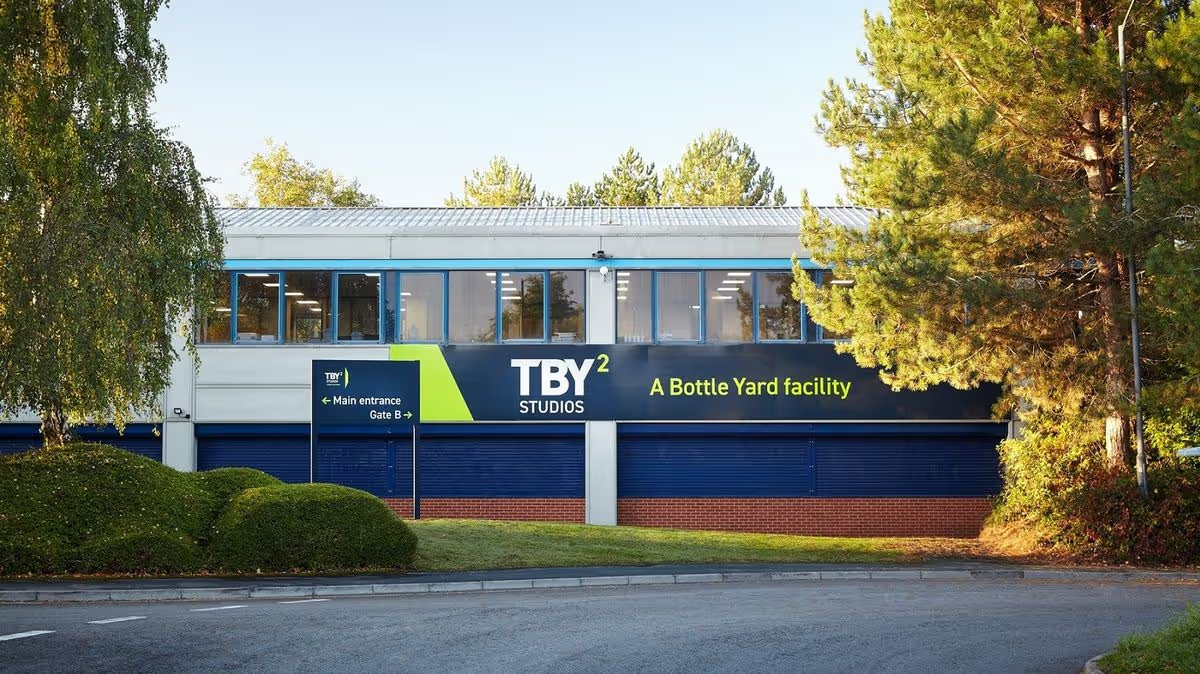
The entrance of The Bottle Yard Studio’s TBY2 facility in Bristol(Image: Tony Gilbert)
The West of England’s largest film and television studios has released information about its finances for the first time, Business Live can exclusively reveal. The Bristol City Council-owned Bottle Yard, in Hengrove, provided the details following a Freedom of Information (FOI) request.
The studios, which have hosted big-name productions such as popular BBC comedy-drama Boarders and Sky Original thriller Inheritance, came under fire last year for refusing to confirm whether it makes a profit for council taxpayers. Previous requests by journalists, local councillors and members of the public for any information on the Bottle Yard’s finances have repeatedly been rejected on the grounds the accounts are “commercially sensitive”.
Business Live logged an FOI on January 27 and Bristol City Council took 64 days to reply, despite regulations requiring public bodies to respond within 20 days. It comes months after the local authority lost a legal battle with the Information Commissioner’s Office over failures to clear an FOI backlog built up under the last administration.
In its response to the FOI, the council told Business Live that over the last financial year (2025-2026) the Bottle Yard’s budget was -£177,625. However, the negative figure does not mean the Bottle Yard is making a loss – in fact it is the opposite. It is understood that Bristol City Council uses an accounting approach that targets zero to balance the books over the year, with money generated by the studios used to reach that target.
Business Live understands the Bottle Yard is an income-generating service – meaning it makes money for the council – and was targeting a surplus of £177,625 for the year. It is understood the studios achieved a surplus for 2025-2026, but it is not yet known whether that surplus is at the full target. As Business Live understands, this is because the council has not yet completed its year-end outturn calculations.
The council also provided details of the Bottle Yard’s budget for the new financial year, which was set on Wednesday, April 1. According to the FOI, the budget for 2026-2027 is -£81,740. Although this year’s income budget is lower, it is understood the Bottle Yard is fully funded for the next 12 months and is expected to make a surplus of £81,000.
The release of the information comes just months after Bristol City Council declined a Freedom of Information request by investigative journalist and council transparency campaigner Andrew Lynch for any financial figures.

The costume department at Bottle Yard(Image: Hannah Baker)
Bristol City Council refused a number of other information requests logged by Business Live, however, including how much Katherine Nash, head of studios at the Bottle Yard, gets paid. Nash, who was appointed in September, is responsible for all the commercial aspects of the studios’ two sites and 11 stages, including sales, operations and partnerships.
The local authority told Business Live it could not provide details of her earnings, including bonuses, as it fell under personal data as defined by the Data Protection Act – and because this was information about another individual they were not able to share it. It also refused to disclose who was considering buying the studios last year. In July, the sale of the Bottle Yard to a private and unknown buyer collapsed, costing taxpayers some £430,000.
The council told Business Live it could not reveal the details, claiming it was part of a “confidential process”. When asked if the council would put the studios back up for sale, it told Business Live a decision had not been made yet but the studios remain open for business.
Last year, Bristol City Council leader Tony Dyer said the council’s aim was “to secure a sustainable future for the studios and the opportunity to grow into its huge potential.”
“Those aims remain the same as does our determination to ensure that one of our city’s most successful regeneration projects continues an upward trajectory to deliver more jobs and more investment for Bristol,” he said at the time.
According to Bristol Film Office – a division of Bristol City Council – films and television shows produced in Bristol over 2024-2025 boosted the local economy by more than £46m. Some 29 major productions were assisted by the Bottle Yard Studios over the period, including three feature films and 26 high-end television productions, with a total of 736 filming days supported in the studio and on location.



































You must be logged in to post a comment Login