
Crypto World
$360,000,000 XRP bought by whales in one week, is a rally coming?

Ripple’s native token has returned to focus after crypto analyst Ali Martinez, known as Ali Charts on X, said whales accumulated 360 million XRP over the past week.
Summary
- XRP whales accumulated 360 million tokens in one week as price held near resistance levels.
- Ali Charts flagged a bullish setup, with $1.55 now the key breakout level.
- wXRP on Solana and WhatsApp trading added fresh attention to XRP’s recent momentum story.
The large buying activity came as XRP traded at $1.44, with a 24-hour trading volume of $2.67 billion. The token was up 1.59% over 24 hours and 4.98% over seven days (according to CoinGecko data).
The whale accumulation has added to market attention around XRP’s next move. Traders are now watching whether strong buying from larger holders can help support another push higher after recent gains slowed near resistance.
Technical signals point to a possible breakout
As we previously reported, Ali Charts said ”$XRP consolidates in a symmetrical triangle, pointing to a potential 35% move.” That pattern has kept XRP in a tight range as traders wait for a breakout in either direction. The comment has added to speculation over whether XRP could be preparing for a larger price swing.
The analyst also said on April 18 that ”$XRP: SuperTrend flips bullish!” He added that the daily chart showed its first bullish flip since Jan. 17. According to the post, the key level remains $1.55.
Meanwhile, open interest in XRP futures climbed to $2.61 billion, with gains reported across CME and Binance. At the same time, short liquidations rose between April 15 and April 16 after XRP moved above $1.40. That activity showed rising trader interest as price pushed into a higher range.
Support is now seen around $1.37 to $1.38. If XRP holds that zone, traders may look for another test of $1.50. If buyers clear that resistance, $1.65 could become the next level in view.
Broader developments add to market activity
Part of XRP’s recent move has also been linked to Ripple’s work with Kyobo Life Insurance on tokenized government bonds in South Korea. That development added a fresh use case narrative as interest around tokenization continued to grow.
The launch of wrapped XRP on Solana also brought new attention to the asset. Through Hex Trust and LayerZero, users can now access wXRP in new trading flows, including an AI-powered interface on WhatsApp that lets users buy and trade through text commands.
Together with the rise in the Crypto Fear and Greed Index to 62, these factors have added more momentum to the current XRP discussion, though price still needs to break key resistance before a stronger rally can be confirmed.
Disclosure: This article does not represent investment advice. The content and materials featured on this page are for educational purposes only.

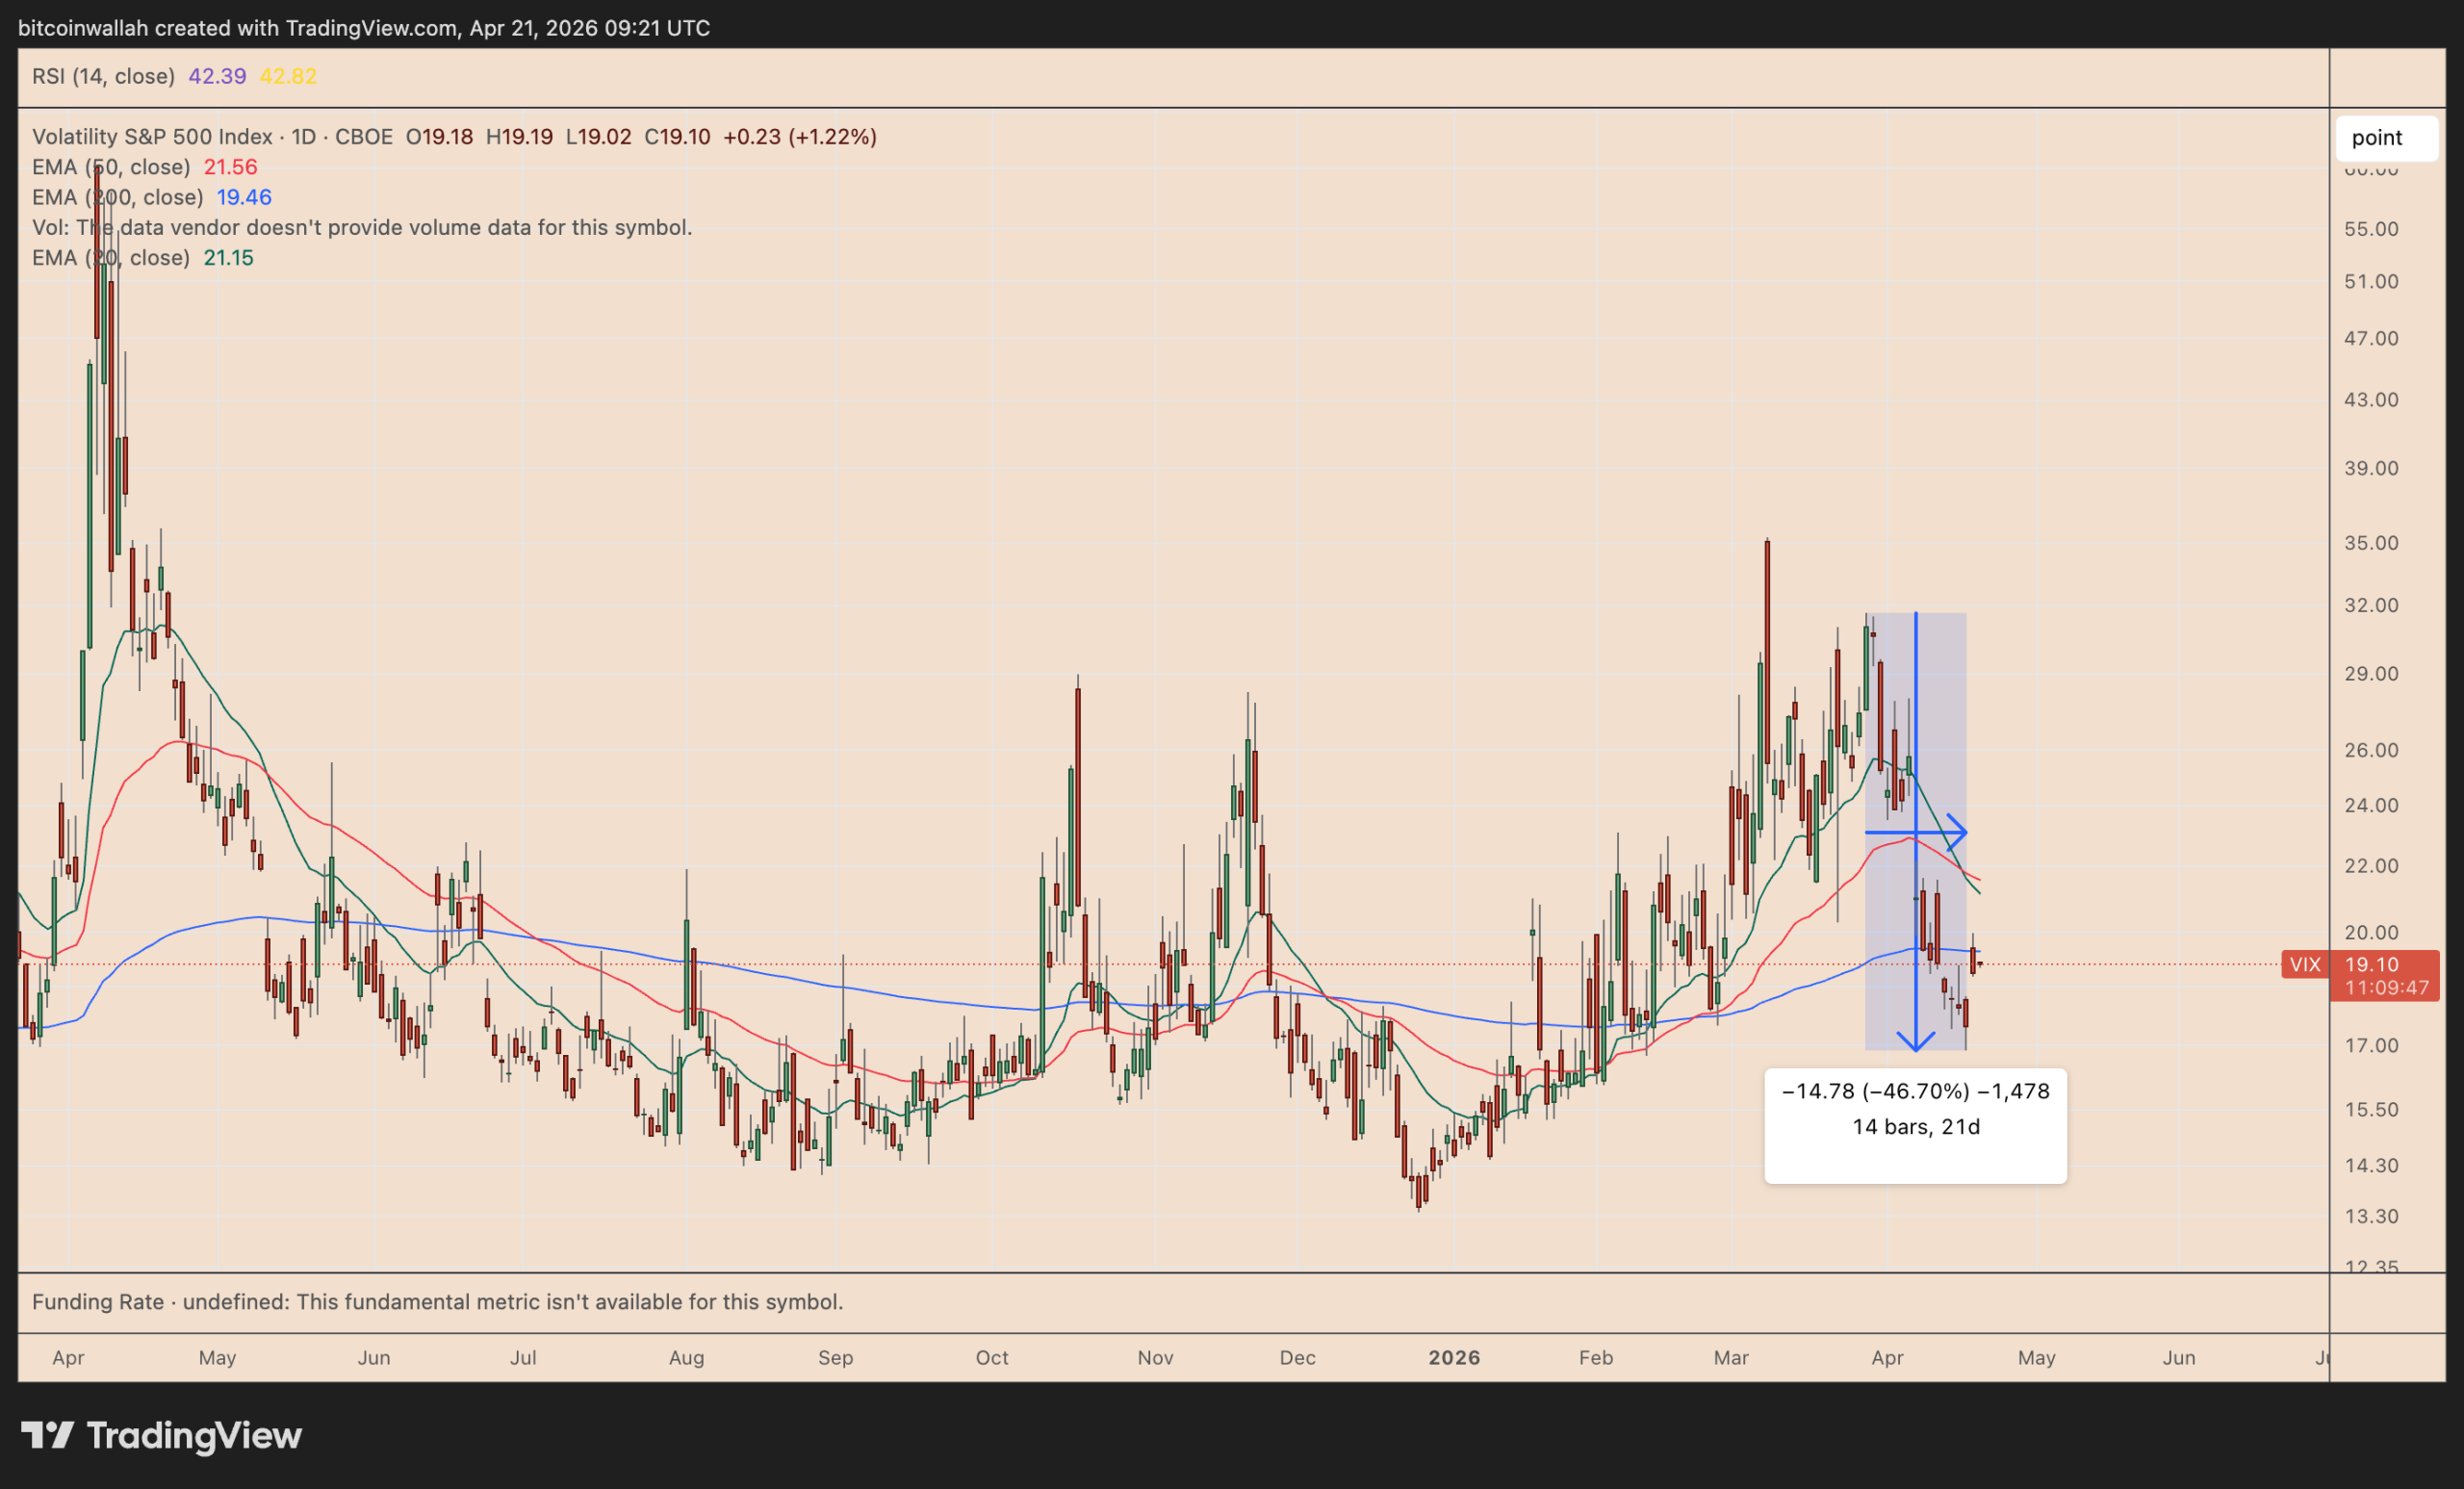
The CBOE Volatility Index (VIX), a preferred Wall Street metric to measure investor sentiment and market risk, dropped by over 45% in under a month. For Bitcoin (BTC), this could be a significant bullish signal.

Key takeaways:
-
Bitcoin may rise toward $82,700 if VIX keeps underperforming.
-
BTC’s upside outlook gets a boost from Strategy’s BTC buying spree.
Weakening VIX hints at BTC rising to $82,700
Often called Wall Street’s “fear gauge,” the VIX tracks how much volatility traders expect in the S&P 500 index over the next 30 days.
When the index rises, it usually signals rising stress and risk aversion across markets. When it falls, it suggests investors are becoming more comfortable owning riskier assets such as stocks and crypto.
History suggests that a VIX drop of 40% or more is bullish for Bitcoin.
For instance, BTC rallied approximately 40% during April 2025–May 2025, with its gains aligning with the VIX’s 70% dip.

Similarly, a 46% VIX drop during the October–November 2025 period coincided with a 12% BTC gain.
Even the recent 42%–47% VIX decline has coincided with an 8%–9% BTC price rebound, improving the bullish backdrop for Bitcoin in the coming days.
BTC’s next upside target appears to be around the 200-day exponential moving average (200-day EMA, the blue line) at around $82,700 by early May.
What happens to Bitcoin if VIX starts rising?
A rising VIX is typically bearish for risk assets like Bitcoin. However, that correlation broke briefly in March, according to a chart highlighted by wealth management firm Swissblock.
BTC and VIX rose in tandem during the US–Iran escalation in March. In comparison, the broader risk market, including US equities, underperformed.

One potential catalyst behind Bitcoin’s resilience may have been Strategy’s aggressive BTC buying, which has absorbed the equivalent to nearly 30 weeks of new coin supply since March.
Related: Saylor teases ‘bigger’ BTC buy days after floating semi-monthly dividends
“Bitcoin has already shown inherent strength in a very complex environment”, Swissblock said, adding:
“Do not be surprised if it starts to outperform on its own again.”
Nonetheless, any slowdown in Strategy’s buying could weaken Bitcoin’s support during periods of rising VIX, increasing the risk of downside.
Multiple analyses suggest BTC may drop below $50,000 in 2026.
This article is produced in accordance with Cointelegraph’s Editorial Policy and is intended for informational purposes only. It does not constitute investment advice or recommendations. All investments and trades carry risk; readers are encouraged to conduct independent research before making any decisions. Cointelegraph makes no guarantees regarding the accuracy or completeness of the information presented, including forward-looking statements, and will not be liable for any loss or damage arising from reliance on this content.
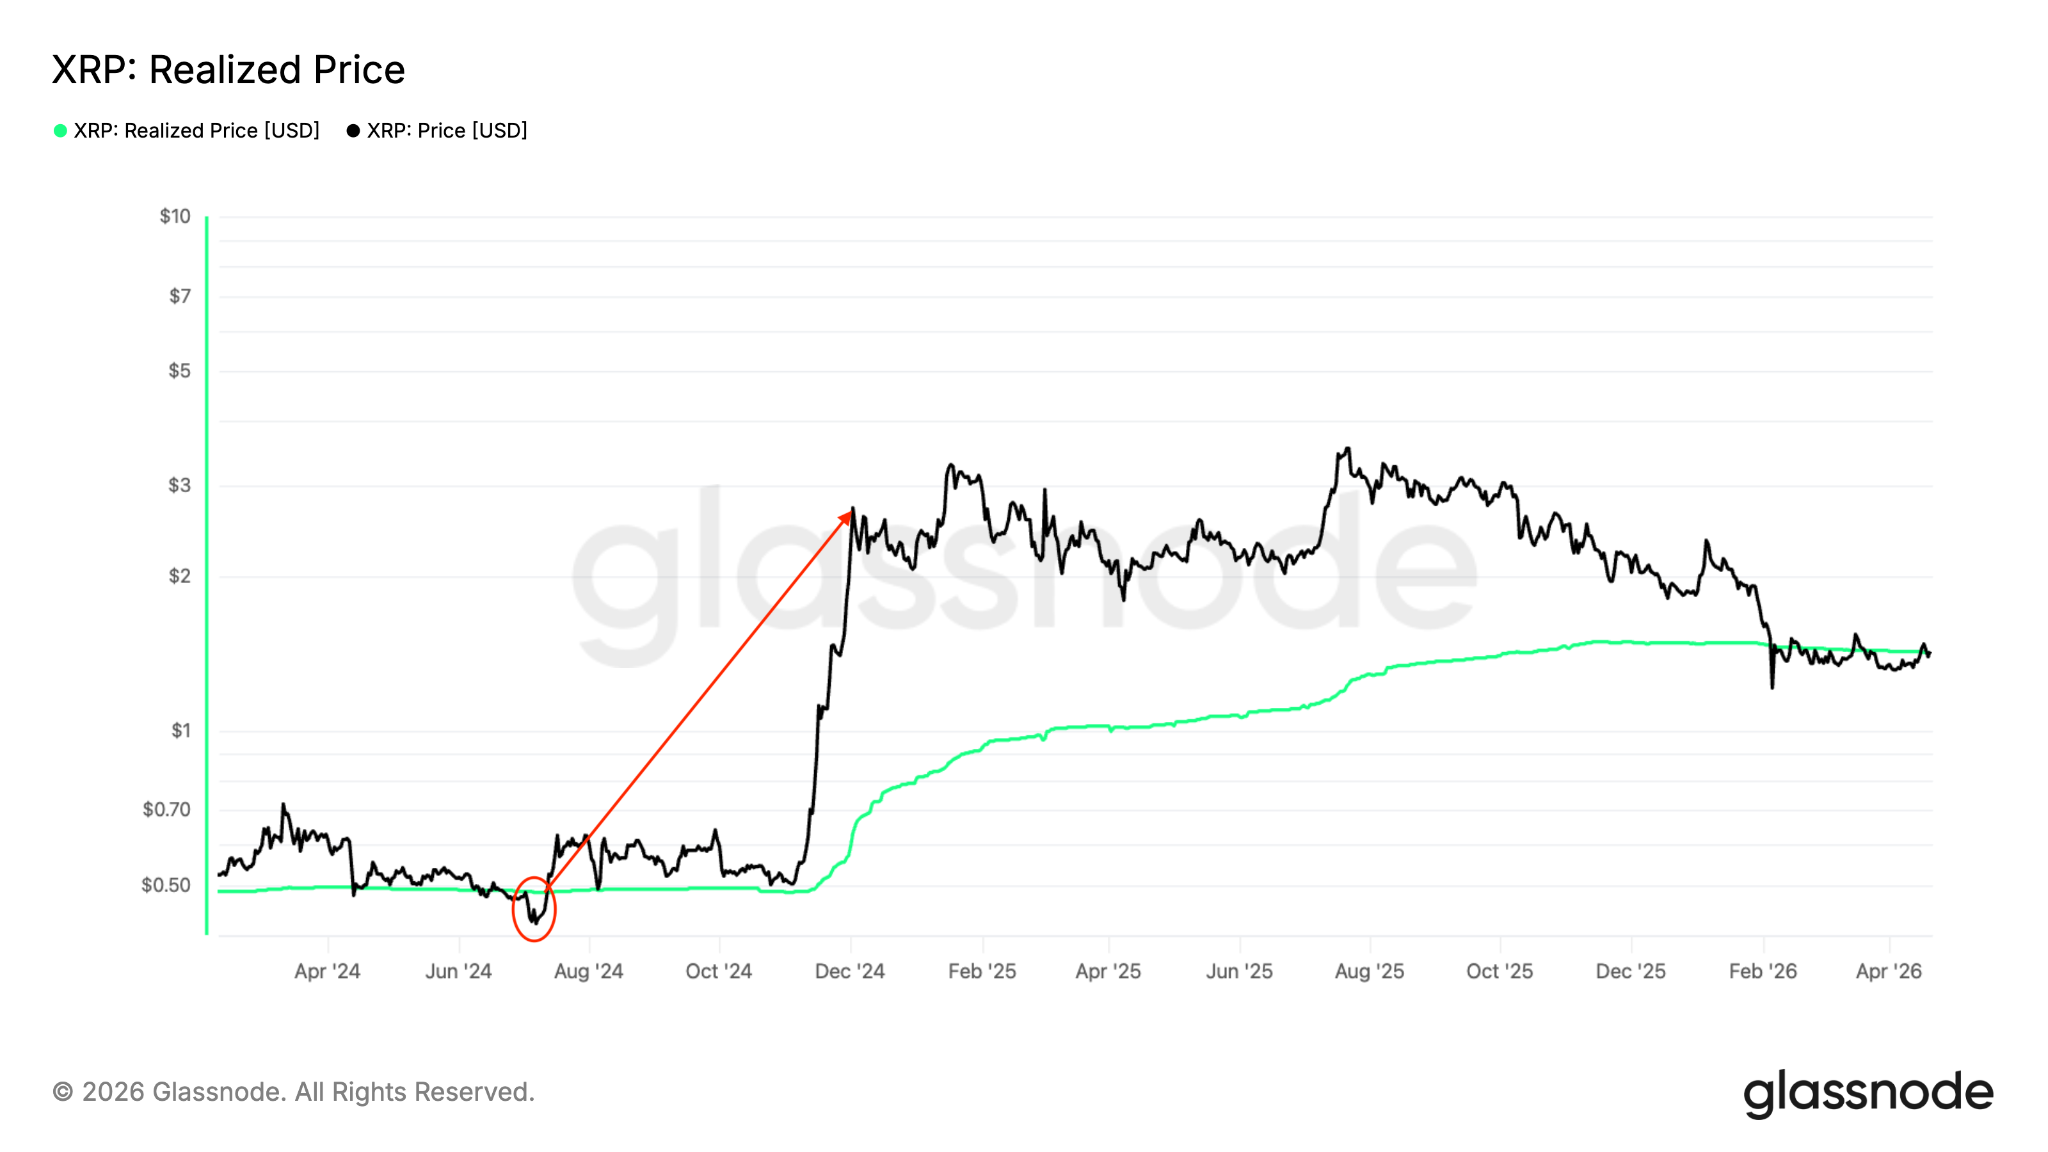
Most XRP investors are back in profit, increasing the chance for a rally to $2.24, but bulls must first hold the price above $1.40.
XRP’s (XRP) 28% rebound from its macro low at $1.12 pushed it above its realized price. In other words, the average XRP holder is no longer in the red.
Is this enough fuel for the bulls to push the altcoin’s price to $2.24?
Key takeaways:
XRP trades above its cost basis
Data from TradingView shows the XRP/USD pair trading at $1.44, up 1.6% over the last 24 hours and 5% over the last seven days.
This means XRP is holding above its realized price, the average cost of all coins based on when they last moved, currently at $1.41, according to data from Glassnode.
The average XRP holder returning to profit after unrealized losses provides meaningful financial relief for many holders, signaling a bullish outlook.
Related: XRP price bottom signals emerge after the altcoin holds key support level
Historically, breaking above this level shifted market sentiment from “fear,” reducing sell pressure from underwater holders and encouraging holding.
The chart below shows that when the price reclaimed its realized price after hovering below it for a few months in mid-2024, it rallied 460% to $2.90 from $0.52.

Holding above $1.40 is crucial for the bulls to ensure a potential upward breakout.
On the upside, the key levels of resistance to watch out for are the 111-day moving average (MA) at $1.57, the 200-day MA at $1.88 and the 365-day MA at $2.22, based on XRP’s technical pricing model.

XRP’s symmetrical triangle targets $2.40
XRP has been consolidating within a symmetrical triangle for more than two months, as shown in the chart below.
The XRP/USD pair must break and close above the upper trend line of the triangle at $1.46 to continue the upward trajectory.
The measured target of the pattern, calculated by adding the triangle’s height to the breakout point, is $2.24, 55% above the current price.

Technical analyst and trader ChartNerd said the moving averages between $1.35 and $1.40 “need to be held” to keep the bullish outlook in play.

As Cointelegraph reported, buyers will have to achieve a daily candlestick close above the upper trendline of a descending parallel channel at $1.60 to confirm a potential trend change.
This article is produced in accordance with Cointelegraph’s Editorial Policy and is intended for informational purposes only. It does not constitute investment advice or recommendations. All investments and trades carry risk; readers are encouraged to conduct independent research before making any decisions. Cointelegraph makes no guarantees regarding the accuracy or completeness of the information presented, including forward-looking statements, and will not be liable for any loss or damage arising from reliance on this content.

Volkswagen shows off a prototype of its ID.Aura T6 in Beijing, China, in April 2026.
Picture Alliance | Picture Alliance | Getty Images
German auto giant Volkswagen announced it’s incorporating AI voice commands into its cars for the Chinese market.
Starting in the second half of this year, all vehicles based on Volkswagen’s China car system will feature AI agents that allow humans to control car features with voice commands, the company said on Tuesday.
“The car should be like a companion,” Volkswagen China CTO Thomas Ulbrich told CNBC’s Eunice Yoon.
He said the company’s in-car AI agent would draw on tech from Tencent, Alibaba and Baidu, among others, to create a tool with “personality” that can anticipate a driver’s needs.
The AI uses a locally trained large language model and runs entirely on the car, rather than the cloud.
Volkswagen revealed four cars in Beijing on Tuesday, including the ID. UNYX 09, which the company claimed it co-developed with EV maker Xpeng in two years.
The move is part of the company’s strategy to recoup lost market share as China has rapidly turned to electric cars from ones powered by internal combustion engines.
Over the last few years, Volkswagen has invested heavily in China, with stakes in Xpeng and automotive chipmaker Horizon Robotics.
With those partnerships, the German automaker is not using Nvidia chips in its cars in China. Instead, Volkswagen is using Xpeng’s Turing chip in an electric SUV set to begin deliveries by the end of June, while an advanced automotive chip project with Horizon Robotics remains under development.
Volkswagen also announced Tuesday that, starting next year, it will use agentic AI to power a unified driver-assist and cockpit control system.
In November, the German automaker announced its research center in Hefei could independently develop and approve technology for its Chinese cars, reducing the time to market.
Over the last two years, German automotive industry companies in China have significantly increased their research and development activities in the country, with the aim of serving both the local and global market, according to a report released Tuesday by the German Chamber of Commerce in China.
Nearly 80% of automotive companies surveyed by the chamber said that localizing R&D in China has lowered those costs versus Germany over the last two years, while about 43% of respondents said their innovation speed has increased by more than 40%, the report said.
TLDR
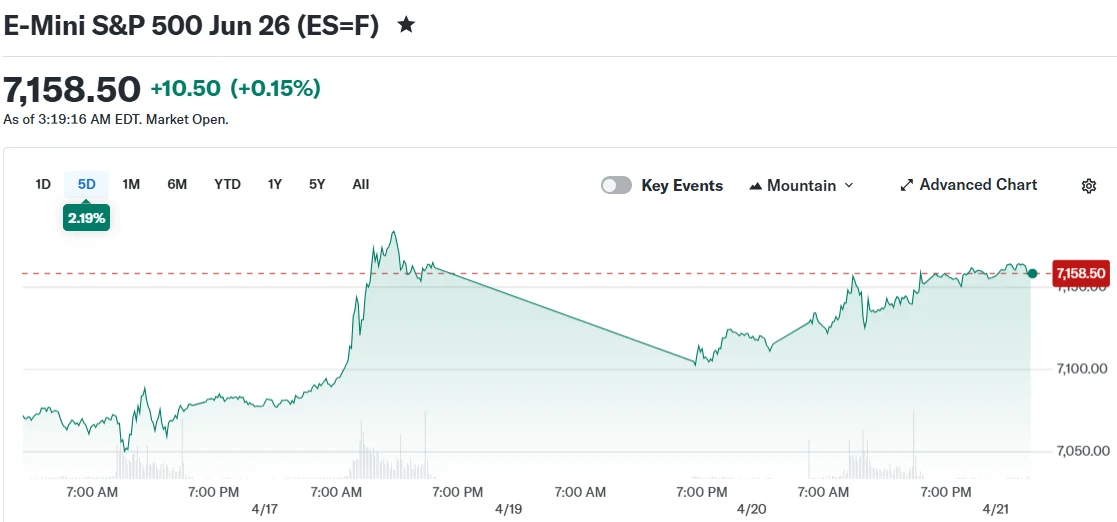
- Futures for the Dow advanced 301 points (0.6%), while S&P 500 and Nasdaq futures posted gains during early trading
- Current U.S.-Iran ceasefire set to conclude Wednesday; Tehran indicates possible diplomatic team deployment to Pakistan
- Apple announces Tim Cook’s departure as CEO, with hardware division leader John Ternus designated as successor
- Bitcoin advanced toward the $76,000 level, bolstered by substantial Strategy acquisition
- Federal Reserve chair nominee Kevin Warsh scheduled for Senate confirmation hearing Tuesday; explicit rate guidance unlikely
Equity futures posted solid gains Tuesday morning as market participants monitored progress in diplomatic negotiations between the United States and Iran while digesting significant leadership changes at Apple.
Futures tied to the Dow Jones Industrial Average advanced 301 points, representing a 0.6% increase. Futures linked to the S&P 500 climbed 0.3%, while Nasdaq 100 futures registered a 0.4% gain. These advances followed Monday’s session, which saw declines across all three major benchmarks, ending a robust recent uptrend.

The temporary ceasefire agreement between Washington and Tehran is scheduled to lapse late Wednesday evening. President Trump confirmed that American negotiators stand prepared to travel to Pakistan to continue diplomatic discussions. Iranian officials suggested they would dispatch a negotiating delegation, although formal confirmation remained pending as of Tuesday morning.
“The working assumption for most market participants is that we see an extension of the current ceasefire,” said Michael Brown, strategist at Pepperstone.
Oil prices retreated on growing optimism surrounding diplomatic progress. Brent crude declined 0.5% to reach $95.02 per barrel. West Texas Intermediate decreased 0.6% to settle at $86.87 per barrel. Reduced geopolitical tensions could alleviate concerns about supply chain disruptions affecting shipping routes through the Strait of Hormuz.
Gold retreated 0.6% to $4,801 per ounce. The U.S. dollar index registered a modest 0.1% increase against major trading currencies. The benchmark 10-year Treasury yield remained unchanged at 4.26%.
Apple Leadership Transition Impacts Shares
Apple announced Monday evening that Tim Cook would relinquish his position as chief executive. John Ternus, currently overseeing the company’s hardware engineering division, has been named as his replacement. Apple shares declined 0.5% during premarket activity following the revelation.
Market observers are simultaneously focused on Kevin Warsh, President Trump’s nominee for Federal Reserve chair. Warsh is scheduled to testify before the Senate Banking Committee Tuesday. His prepared testimony contained no definitive signals regarding monetary policy direction. Current market expectations favor no interest rate reductions throughout 2026.
March retail sales figures are scheduled for release later Tuesday, providing crucial insights into consumer expenditure patterns during the period of heightened Middle East tensions.
Bitcoin Advances Toward $76,000 Threshold
Bitcoin climbed toward the $76,000 mark Tuesday, receiving support from a substantial acquisition by Strategy, the business intelligence company recognized for its assertive Bitcoin accumulation approach. The transaction provided momentum across cryptocurrency markets more broadly.
United Airlines is scheduled to release quarterly earnings Tuesday. Financial analysts will scrutinize how elevated fuel expenses, stemming from Middle East instability, impacted the airline’s financial performance.
The Nasdaq ended its longest consecutive winning streak since 1992 during Monday’s trading session. Both the S&P 500 and Nasdaq Composite had recently established new record peaks before experiencing the recent downturn.
Warsh’s Senate testimony represents a significant market catalyst Tuesday, with investors seeking any indications regarding Federal Reserve policy direction under potential new leadership.


Securitize has appointed Sunil Sabharwal to its board of directors as the tokenization firm moves ahead with expansion plans.
Summary
- Securitize appointed Sunil Sabharwal, a former IMF representative, to its board of directors this week.
- The company manages over $4 billion in on-chain assets for major financial institutions globally.
- Securitize continues pursuing a public listing through its planned merger with Cantor Equity Partners II.
The company said the appointment adds experience in global finance, payments, and public policy at a time when tokenized asset platforms are drawing more institutional attention.
Sabharwal is a business executive and investor with a background in payments and financial services. He also served as a Senate-confirmed U.S. representative to the International Monetary Fund from 2016 to 2018.
Securitize chief executive Carlos Domingo said Sabharwal brings experience from both the private and public sectors. Domingo said “Sunil’s career is defined by building and scaling financial infrastructure at a global level.”
He added that Sabharwal’s background in payments and international finance would support the company’s next phase of growth. Domingo said tokenization is moving from concept to market infrastructure, and that Sabharwal’s perspective would be useful as the firm expands.
Sabharwal currently serves on the boards of Thunes and TookiTaki. He also previously chaired payment companies Earthport and Ogone, which were later acquired by Visa and Ingenico.
His background includes work across payments, cross-border finance, and strategic growth. That track record gives Securitize a board member with experience in both financial infrastructure and regulated markets.
Sabharwal also received the U.S. Treasury’s Distinguished Service Award during his public service. He was nominated by former President Barack Obama in 2016 and served mainly during President Donald Trump’s first term until 2018.
Since 2021, he has worked as an advisor and operating partner for the Blackstone Growth Equity Fund, according to LinkedIn. He also previously advised SpiceVC, an early backer of Securitize.
Securitize expands tokenized asset business
Securitize manages more than $4 billion in on-chain assets. Its platform supports tokenized products tied to firms including BlackRock, Apollo, BNY, Hamilton Lane, KKR, and VanEck.
Among its best-known products is BlackRock’s BUIDL fund. The company has positioned itself as one of the larger players in the tokenized real-world asset market as institutions explore blockchain-based fund structures.
The board appointment comes as the company continues to build out that business. It also comes as market participants pay closer attention to firms that offer tokenized versions of traditional financial products.
Public listing plan remains in focus
Securitize is also pursuing a public market listing through a merger with Cantor Equity Partners II, a Cantor Fitzgerald-sponsored firm. The companies entered into a definitive acquisition agreement in October.
The deal would value Securitize at $1 billion. The combined company is expected to trade on Nasdaq under the ticker CEPT.
The transaction would also give Securitize access to the $240 million raised by CEPT in its initial public offering. That planned listing remains a key part of the company’s growth strategy as it expands its presence in tokenized finance.


- Arbitrum froze 30,766 ETH before it could be bridged out.
- Attacker moved 75,701 ETH and began routing funds to Bitcoin.
- Over $176 million is being laundered through multiple parallel flows.
Arbitrum has frozen a significant portion of funds linked to the KelpDAO exploit, even as the attacker moves to push the remaining assets beyond reach.
The Arbitrum Security Council confirmed it froze 30,766 ETH, valued at over $70 million at the time of action.
The funds were tied to an address associated with the KelpDAO attacker and were secured before they could be bridged out of the network.
The intervention came after coordination with law enforcement, suggesting authorities may already have leads on the exploiter’s identity.
The Arbitrum Security Council has taken emergency action to freeze the 30,766 ETH being held in the address on Arbitrum One that is connected to the KelpDAO exploit. The Security Council acted with input from law enforcement as to the exploiter’s identity, and, at all times,…
— Arbitrum (@arbitrum) April 21, 2026
A race against time
Blockchain investigators, including PeckShield, had flagged that the attacker was already attempting to move the funds off Arbitrum using a native bridge.
Had that transfer been completed, the ETH would likely have joined a much larger pool of stolen assets already in circulation across other chains.
By intervening when it did, Arbitrum prevented roughly 29% of the stolen funds from entering the laundering pipeline. However, the remaining assets were not as fortunate.
The KelpDAO exploit itself is estimated at around $290 million, making it one of the largest decentralized finance breaches of 2026.
The attacker moved quickly after the initial exploit, splitting funds across multiple wallets and chains in an effort to reduce traceability.
Laundering shifts to Bitcoin
Following the freeze, the attacker accelerated efforts to move the remaining funds.
Data shows that approximately 75,701 ETH, worth about $175 million, was transferred to Ethereum mainnet.
From there, the funds began moving into Bitcoin through decentralized protocols like THORChain, Chainflip, and Umbra Cash, which allow direct cross-chain swaps without relying on centralized exchanges.
#PeckShieldAlert The @KelpDAO exploiter has begun laundering stolen funds (~$176M).
They have started bridging small batches of funds from #Ethereum to $BTC via @THORChain, @UmbraCash, @chainflip, and @BitTorrent. pic.twitter.com/4cm8dOjTWL
— PeckShieldAlert (@PeckShieldAlert) April 21, 2026
PeckShield analysts observed that the attacker left only about 0.7 ETH in some wallets, just enough to cover transaction fees, while draining the rest into new routes.
This pattern reflects a high level of operational discipline and planning.
Another $176 million portion of the stolen funds has also been actively moved in parallel transactions.
Rather than laundering everything in a single flow, the attacker appears to be running multiple streams at once.
This staggered approach reduces the risk of a single point of failure and makes recovery efforts more difficult.
Is the infamous North Korea’s Lazarus Group linked to the KelpDAO exploit?
The scale and coordination of the operation have led investigators to link the exploit to North Korea’s Lazarus Group, specifically a subgroup known as TraderTraitor.
This attribution is based on transaction patterns and laundering techniques that match previous operations tied to the group.
Lazarus has a long history of targeting crypto platforms and using complex cross-chain strategies to obscure stolen funds.
The use of decentralized bridges and rapid asset conversion seen in the KelpDAO case fits that pattern closely.
Crypto World
Coinbase Expands x402 With AI Agent App Store, Pushing Crypto Payments Into AI Infrastructure

Coinbase has launched Agent.market, an AI agent app store built on its x402 payment protocol, embedding permissionless stablecoin rails directly into AI infrastructure across seven service categories. As of April 21, 2026, approximately 69,000 active AI agents on x402 have already processed over 165 million transactions totaling $50 million in volume, figures that frame this as an infrastructure play, not a speculative product launch.
The core question now: whether Agent.market can become the default discovery and payment layer for autonomous AI agents, or whether fragmented developer ecosystems blunt adoption before the rails gain critical mass.
Key Takeaways:
- What x402 is: An open payment protocol named after the unused HTTP 402 status code, enabling instant stablecoin micropayments over HTTP for APIs, apps, and AI agents – no accounts or subscriptions required.
- What Agent.market adds: A permissionless app store spanning seven categories – reasoning, data, media, search, social, infrastructure, and trading – with providers including OpenAI, Bloomberg, CoinGecko, AWS Lambda, and Coinbase RAT.
- What AI agents can now do: Autonomously discover, pay for, and chain together services using Agentic Wallets, without developer-preset API keys or manual billing setup.
- Payment rail: USDC stablecoins on Base, with Coinbase’s Payments MCP enabling LLMs including Anthropic’s Claude and Google’s models to access blockchain wallets via x402.
- Backing: The x402 Foundation, incubated under the Linux Foundation, counts over 20 institutional backers including Cloudflare, Stripe, AWS, Google, Visa, Circle, and the Solana Foundation.
- Watch item: Google’s agentic payments protocol integration with x402 for single-tap USDC retail transactions – a signal that could accelerate volume materially.
Discover: The best crypto to diversify your portfolio with
How Coinbase x402 Agent.market Actually Works – and Why the Architecture Matters
x402 was designed around a structural gap in the existing web: the HTTP 402 status code has existed since the early internet as a placeholder for payment-gated content, but was never implemented at scale.
Coinbase built x402 to fill that gap. When an AI agent hits a payment-required endpoint, x402 handles the USDC micropayment over HTTP instantly, without redirecting to a billing portal or requiring a pre-negotiated API key relationship.
Agent.market operationalizes that mechanic into a browsable catalog. Service providers can list without permission, which directly reduces the setup friction that has historically limited API commerce: x402 creator Erik Reppel stated the protocol “is reshaping customer acquisition activation costs for businesses, as robots can now access services at a very low setup cost without needing API keys.”
That framing matters; it redefines cost-of-acquisition for AI-facing businesses from human onboarding flows to machine-readable price discovery.
The seven-category structure – reasoning, data, media, search, social, infrastructure, and trading – maps directly onto what autonomous agents need to chain multi-step tasks. An agent could pull financial data from CoinGecko, process it through an OpenAI reasoning endpoint, execute a trade via Bankr, and log the transaction through QuickNode infrastructure, with every handoff settled in USDC on Base without human authorization at each step.
If adoption follows the arc of prior API marketplaces, the trading and data verticals will see volume concentration first – they carry the highest per-call value and the most time-sensitive payloads.
The failure mode to watch is latency and settlement finality at scale. x402’s prior 165 million transactions represent an average call value under $0.31 – the architecture is calibrated for micropayments, not bulk settlements. Whether it holds throughput as agent complexity and chain length increase is the open engineering question.
Discover: The best pre-launch token sales
The post Coinbase Expands x402 With AI Agent App Store, Pushing Crypto Payments Into AI Infrastructure appeared first on Cryptonews.

Decentralized Finance (DeFi) is often marketed as a parallel financial system built on transparency, efficiency, and permissionless access. Yet beneath these narratives lies a more fundamental driver—volatility. While traditional finance seeks to minimize instability, DeFi, in contrast, is structurally dependent on it. Volatility is not a byproduct of the system; it is, in many ways, the system’s core product.
Volatility as the Engine of Opportunity
At the heart of DeFi protocols such as Uniswap, Aave, and Compound lies a simple premise: market inefficiencies create profit opportunities. These inefficiencies are amplified by price fluctuations.
Without volatility, several foundational DeFi mechanisms would lose their purpose:
- Arbitrage depends on price discrepancies across markets. Stable prices eliminate these gaps, leaving no room for profit extraction.
- Yield farming relies on shifting capital toward higher returns, often driven by rapidly changing incentives and token valuations.
- Liquidation cycles in lending protocols require price movements to trigger collateral thresholds.
In essence, volatility fuels the activity that sustains user engagement and capital flow within the ecosystem.
Liquidity Provision and the Cost of Stability
Liquidity providers (LPs) are often presented as passive participants earning fees. However, their returns are closely tied to market turbulence. In automated market makers (AMMs), price swings generate trading volume, which in turn produces fees.
Yet this comes with a trade-off: impermanent loss. In low-volatility environments, LPs may see reduced trading activity and lower fee generation, while still being exposed to potential downside risks. Ironically, the more stable the market becomes, the less attractive liquidity provision can be.
This dynamic reveals a critical tension: DeFi protocols require stability to build trust, but depend on volatility to remain profitable.
The Feedback Loop of Instability
DeFi does not merely react to volatility—it amplifies it. Mechanisms embedded within protocols often create feedback loops:
- Price drops trigger liquidations, which further push prices downward.
- Yield incentives attract capital rapidly, only for it to exit just as quickly when returns diminish.
- Leveraged positions magnify both gains and losses, increasing systemic sensitivity to price changes.
These cycles are not anomalies; they are intrinsic to how DeFi systems are designed. Platforms like MakerDAO and Curve Finance attempt to introduce stability through collateralization and specialized liquidity pools, yet even they cannot fully escape the gravitational pull of broader market volatility.
Stability as a Narrative, Not a Foundation
Stablecoins and low-volatility pools are often positioned as solutions to DeFi’s chaotic nature. However, even these instruments rely indirectly on volatility elsewhere in the system. For example, maintaining a stable peg frequently depends on arbitrage incentives—again requiring price discrepancies to function effectively.
Thus, stability in DeFi is less a foundational property and more a constructed layer, supported by mechanisms that ultimately trace back to volatility.
Conclusion
The promise of DeFi is frequently framed around democratizing finance and reducing reliance on centralized institutions. While these goals are significant, they can obscure a more pragmatic reality: DeFi thrives on movement, not equilibrium.
Volatility is the fuel that powers arbitrage, sustains yield, and drives liquidations. Without it, the mechanisms that define DeFi would stall. Rather than viewing volatility as a problem to be solved, it may be more accurate to recognize it as the primary product being generated and consumed within the ecosystem.
Understanding this dynamic is essential for participants. Success in DeFi is not about avoiding chaos—it is about navigating it effectively.
REQUEST AN ARTICLE
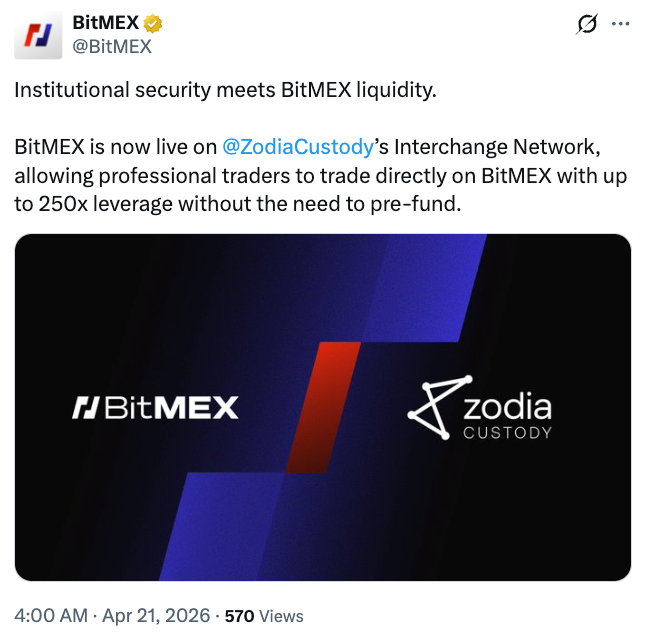
BitMEX, a derivatives-focused cryptocurrency exchange, said it has secured a custody partner to enable asset segregation and trading with off-exchange assets.
The company announced Tuesday a partnership with Zodia Custody to allow traders to access derivatives while keeping collateral in segregated custody. The integration is immediately accessible via Interchange, Zodia Custody’s off-venue settlement solution.
BitMEX CEO Stephan Lutz told Cointelegraph the move reflects lessons from past market failures, including the FTX collapse and the $1.4 billion Bybit hack, which exposed risks tied to unsegregated or compromised exchange-held funds.
“Cases like the FTX collapse and the Bybit hack are examples of how custody failures or security threats can put client funds at risk,” Lutz said.
Trading without prefunding the exchange
Under the integration, institutional and professional BitMEX clients can trade derivatives without transferring assets directly onto the exchange. Instead, collateral remains in Zodia’s segregated vault and is mirrored for trading execution.
This structure allows traders to maintain control of assets while accessing BitMEX’s derivatives, including perpetual swaps and futures. It also supports cross-collateral usage of Bitcoin (BTC), Ether (ETH), Tether USDt (USDT) and USDC (USDC).

This setup is designed to improve capital efficiency for traders by removing the need to move assets between custody and exchange accounts. It also reduces operational risk tied to pre-funding workflows, which are common in traditional crypto trading models.
Custody is a core part of traditional finance markets
Zodia Custody, which launched in 2021 and is backed by Standard Chartered, is an institutional digital asset custody provider operating globally. The platform secured a Markets in Crypto-Assets Regulation (MiCA) authorization in Luxembourg in late 2025, enabling regulated services across the European Union.
BitMEX CEO noted that custody has long been a core element of traditional finance, becoming even more critical following collapses like FTX and security incidents like the Bybit hack.
Related: Zonda exchange says 4.5K BTC wallet inaccessible amid withdrawal crisis
“Custody is a core part of traditional finance markets, and recent cases like FTX and Bybit are clear examples of why it’s even more important in crypto,” Lutz said.
“As the industry matures, institutions are trading digital assets like any other asset — and should have access to the same services as they do in traditional markets,” he added.
Additional reporting by Felix Ng.
Magazine: Adam Back says current demand is ‘almost’ enough to send Bitcoin to $1M

Key Highlights
- Q1 earnings per share reached $6.14, surpassing Wall Street’s $6.05 projection by $0.09
- Quarterly revenue totaled $9.88 billion, marking a 4% year-over-year increase and exceeding the $9.76 billion forecast
- The Aeronautics Systems division reported a 17% sales increase, fueled by B-21 bomber and Sentinel program growth
- Operating profit jumped 73% to $989 million while segment margins expanded to 10.8%
- Shares declined approximately 1.6% during premarket hours despite beating estimates, with unchanged annual projections
Northrop Grumman delivered impressive first-quarter 2026 results that exceeded analyst expectations across key metrics, yet the defense contractor’s shares retreated during Tuesday’s early market session.
The company reported earnings per share of $6.14, comfortably above the Street’s $6.05 consensus target. Quarterly sales reached $9.88 billion, reflecting a 4% increase compared to the $9.47 billion recorded in the same period last year, and beating the anticipated $9.76 billion mark.
The Aeronautics Systems division emerged as the standout performer, with revenue soaring 17%. This substantial growth stemmed from a recently secured agreement with the U.S. Air Force that accelerates B-21 bomber manufacturing capacity alongside expedited deployment of the Sentinel intercontinental ballistic missile program’s initial operational capability.
Northrop Grumman Corporation, NOC
Operating profit experienced a remarkable 73% surge to $989 million during the quarter. The company’s operating margin expanded significantly to 10.0% from the prior year’s 6.1%. This dramatic improvement was primarily attributed to the elimination of a $477 million charge related to the B-21 program that had negatively impacted first-quarter 2025 financial performance.
Segment operating profit climbed 89% to $1.07 billion, while segment operating margins improved substantially from 6.0% to 10.8%.
The defense contractor secured $9.8 billion in net new contract awards throughout the quarter. The company’s total backlog now stands at an impressive $95.6 billion — representing more than double its annual revenue.
Organic revenue growth registered at 5% on a year-over-year basis.
Full-Year Projections Remain Unchanged
Northrop maintained its previously issued 2026 full-year guidance without modification. Management continues to anticipate total sales between $43.5 billion and $44.0 billion, with MTM-adjusted earnings per share projected in the $27.40 to $27.90 range.
Current analyst consensus sits at approximately $28 for EPS — positioned above the company’s upper guidance threshold. Notably, when the defense contractor initially provided guidance in January, Wall Street expectations were hovering around $29.
The company reaffirmed its free cash flow target of $3.1 billion to $3.5 billion for the year. Segment operating income guidance remains between $4.85 billion and $5.0 billion.
Chief Executive Kathy Warden characterized the quarterly performance as evidence of the organization’s capability to execute amid “today’s unprecedented global demand environment.”
Market Response
Notwithstanding the earnings beat, NOC shares declined roughly 1.6% during premarket activity to $646.67. Meanwhile, both S&P 500 and Dow Jones Industrial Average futures were trading higher during the same timeframe.
The stock had already appreciated 15% year-to-date prior to Tuesday’s announcement, and approximately 24% over the trailing twelve-month period. Shares currently command a forward price-to-earnings multiple of about 23 times, elevated from roughly 19 times one year earlier.
This premium valuation level may help explain why a solid quarterly earnings performance failed to generate positive momentum for the stock, particularly given the company’s decision to maintain rather than raise its full-year outlook.

Politics Home Article | Ed Miliband Says He Will “Double Down, Not Back Down” On Clean Energy

Christian Pulisic makes big statement about US team ahead of World Cup

OnePlus Ace 6 Ultra Pairs a Strong Phone With a Snap-On Controller That Turns It Into a Portable Console
Manchester United reach agreement with Casemiro over contract clause amid transfer speculation

Steven Gerrard disagrees with Gary Neville over ‘shock’ Chelsea and Arsenal claim | Football

US brings back mandatory military draft registration

Raoul Pal :”My NEW Prediction For The 2026 Crypto Bull Run (Prepare Now)” | Bitcoin Price 2026

Financial Due Diligence | Transaction Services | M&A | Deal Advisory I Interview | Equity Bridge

What Is Crypto Currency and Bitcoin?All about crypto currency by Khan Sir #cryptocurrency #khansir
-

 News Videos6 days ago
Secure crypto trading starts with an FIU-registered
-

 Fashion4 days ago
Weekend Open Thread: Theodora Dress
-

 Sports4 days ago
NWFL Suspends Two Players Over Post-Match Clash in Ado-Ekiti
-

 Politics4 days ago
Palestine barred from entering Canada for FIFA Congress
-

 Business2 days ago
Powerball Result April 18, 2026: No Jackpot Winner in Powerball Draw: $75 Million Rolls Over
-

 Crypto World4 days ago
Russia Pushes Bill to Criminalize Unregistered Crypto Services
-

 Politics16 hours ago
Gary Stevenson delivers timely reminder to register to vote as deadline TODAY
-

 Tech2 days ago
Auto Enthusiast Scores Running Tesla Model 3 for Two Grand and Turns It Into Bare-Bones Go-Kart
-
 Business5 days ago
Creo Medical agree sale of its manufacturing operation
-

 Politics2 days ago
Zack Polanski demands ‘council homes not luxury flats for foreign investors’
-

 Tech6 days ago
‘Avatar: Aang, The Last Airbender’ Leaked Online. Some Fans Say Paramount Deserves the Fallout
-

 Crypto World4 days ago
Russia Introduces Bill To Criminalize Unregistered Crypto Services
-
 Tech6 days ago
Microsoft adds Windows protections for malicious Remote Desktop files
-
 Entertainment6 days ago
Dave Portnoy Slams Dianna Russini: ‘Makes Zero Sense’
-

 Crypto World6 days ago
X Launches New Cashtag Feature for Stocks and Crypto: X
-

 Sports5 days ago
British climbers complete new route in Swiss Alps
-

 Entertainment7 days ago
Prince Carter Brings Fans Front Row and Backstage at Boys 4 Life Tour
-
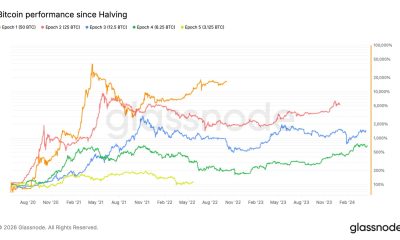
 Crypto World7 days ago
Bitcoin surpasses halfway mark in current halving cycle
-
Entertainment2 days ago
NBA Analyst Charles Barkley Chimes in on Ice Spice McDonald’s Fiasco
-
 Crypto World7 days ago
Paxos Labs Raises $12M to Launch Crypto Yield and Lending Platform
You must be logged in to post a comment Login