

Crypto World
Bitcoin holds near $77,400 as derivatives signal caution

Crypto markets flashed green on Wednesday, but falling futures open interest and mixed altcoin performances suggest traders are reducing risk rather than chasing the rebound.


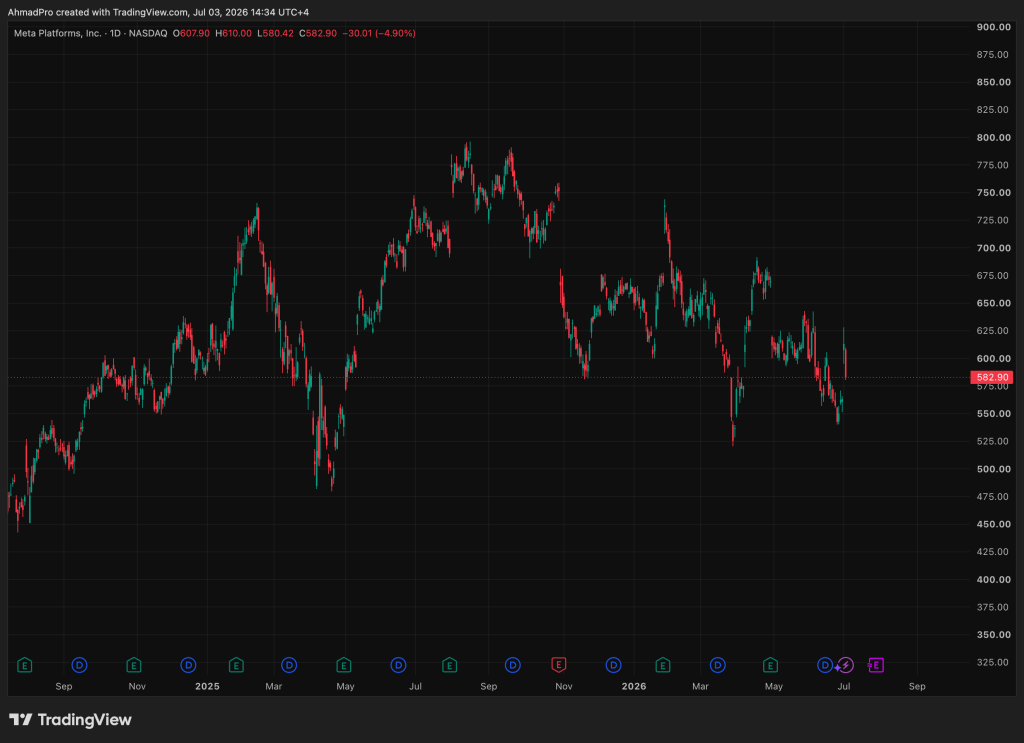
Binance recorded about $1.23 billion in net outflows during the week beginning June 29, according to DefiLlama data reported by Cointelegraph. The figure was up 207% from about $400 million in the previous week.
Summary
- Binance ETH withdrawals hit a three-year high as users moved coins away from the exchange.
- Weekly Binance outflows tripled to about $1.2b while monthly exits reached nearly $3.2b.
- Analysts linked the spike to accumulation, MiCA uncertainty and short-term positioning around Ethereum’s rebound.
The exchange also recorded about $3.2 billion in monthly net outflows. The move showed that users were moving more funds away from the world’s largest crypto exchange by trading volume.
The outflows came as market focus turned to Ethereum withdrawals from Binance. Data from CryptoQuant showed more than 166,000 ETH withdrawal transactions in one day.
https://x.com/cryptoquant_com/status/2072980165341401496?s=20
CryptoQuant community analyst Darkfost said the level had not been seen in more than three years. The spike marked the highest Binance ETH withdrawal transaction count since March 2023.
ETH withdrawals point to accumulation
Darkfost said the move “could reflect genuine demand building around the $1,500 level.” He said some investors may have taken exposure and moved funds off the exchange instead of keeping them ready for short-term trading.
Exchange withdrawals can suggest long-term holding when users move assets into private wallets. Still, the data does not confirm one clear reason. Some withdrawals may also come from short-term positioning, risk control or platform changes.
Crypto.news reported that ETH reclaimed the $1,700 area as ETF inflows returned. The report also said Binance withdrawal spikes pointed to possible accumulation, while rising open interest kept volatility risk active.
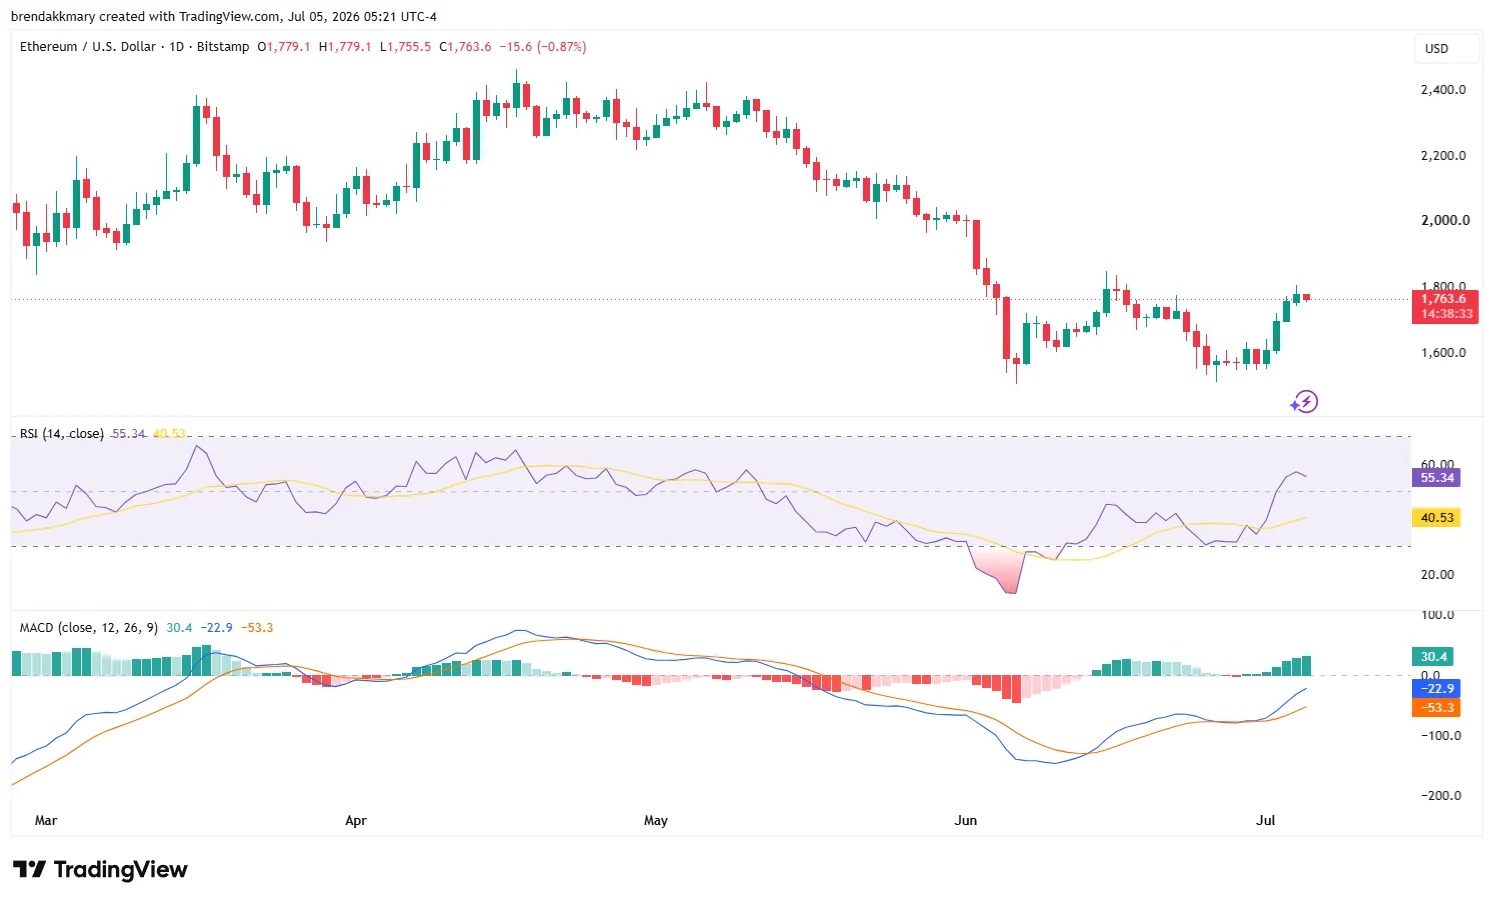
Ether also recovered during the same period. Cointelegraph reported that ETH rose about 12.5% over seven days and traded near $1,766 at publication time, while Bitcoin gained about 4.3%.
MiCA rules add pressure on Binance
The withdrawals also came during a key regulatory change in Europe. The European Union’s MiCA framework entered full force on July 1, requiring crypto firms to hold proper authorization to serve users across the bloc.
Crypto.news reported that Binance reassured EU users as the changes began. Binance said affected users’ assets remained safe and held on a one-to-one basis.
Binance CEO Richard Teng said users would still have access to communicated options, including withdrawals. His comments came after the exchange missed the full MiCA licensing deadline and adjusted some services in the region.
Crypto.news also reported that Binance would suspend most services for EU residents after failing to secure a MiCA license by the deadline. The report said withdrawals remained available and described the move as a suspension, not a permanent exit.
CEX flows remain split
Other centralized exchanges also recorded weekly outflows. Cointelegraph reported that Bitfinex saw about $407.5 million in outflows, while Gate recorded about $214.3 million. OKX and Bybit also posted smaller weekly exits.
Inflows were more limited and spread across fewer platforms. Crypto.com recorded about $63 million in net inflows, while HashKey Exchange added about $53.3 million. KuCoin, Gemini and Bitvavo also saw smaller inflows.
The flow data showed a split market. Some users moved funds away from large trading venues, while others shifted assets to different platforms. The pattern matched a week shaped by ETH’s rebound, MiCA changes and cautious market positioning.
As of then, Binance’s ETH withdrawal spike remains open to more than one reading. It may show accumulation near lower ETH levels, but it also reflects a market where users are watching regulation, exchange access and short-term price risk closely.

Key Highlights
- XRP jumped more than 13% during the initial three trading days of July, advancing from approximately $1.03 to nearly $1.18.
- Legislative advancement of the CLARITY Act through the U.S. Senate enhanced positive sentiment surrounding XRP’s regulatory environment.
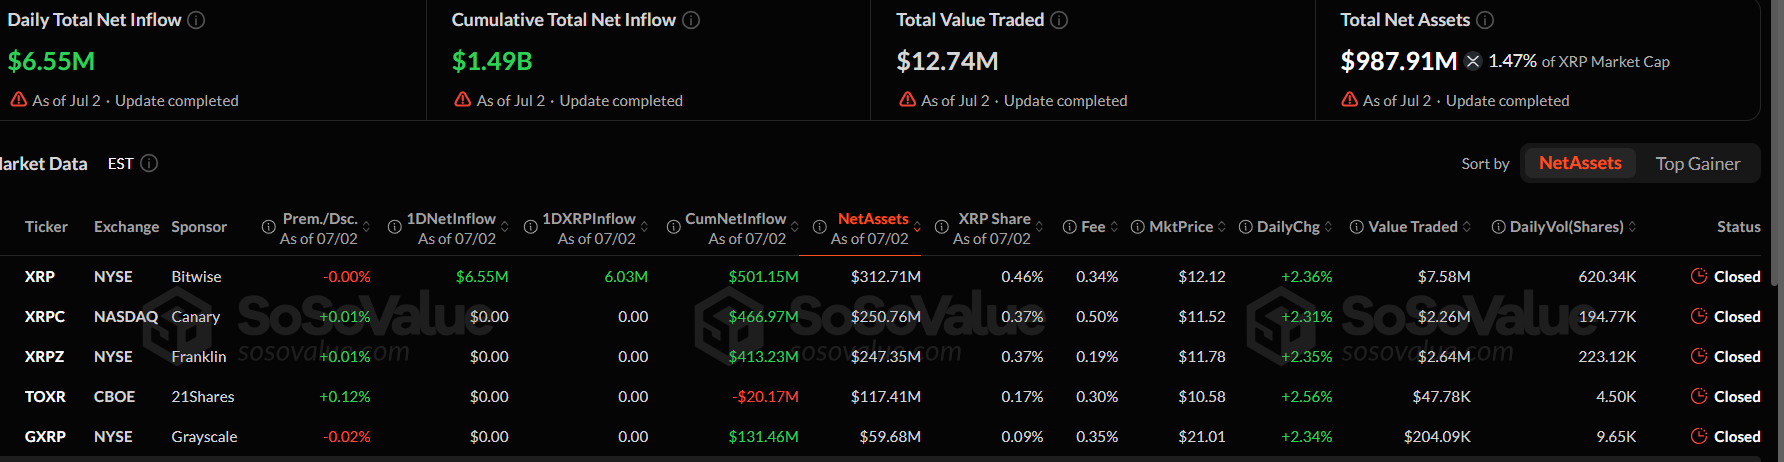
- Investment products tracking XRP attracted $6.55M in single-day inflows, with total cumulative inflows reaching $1.49B.
- Historical data reveals July as a consistently profitable month for XRP, averaging 10.4% gains since 2013.
- Technical analysis identifies critical resistance at $1.20, while support at $1.15 provides downside protection.
XRP launched into July with impressive momentum, posting gains exceeding 13% within a mere three-day span. The digital asset advanced from lows near $1.03 to approach $1.18, capturing fresh interest from market participants.
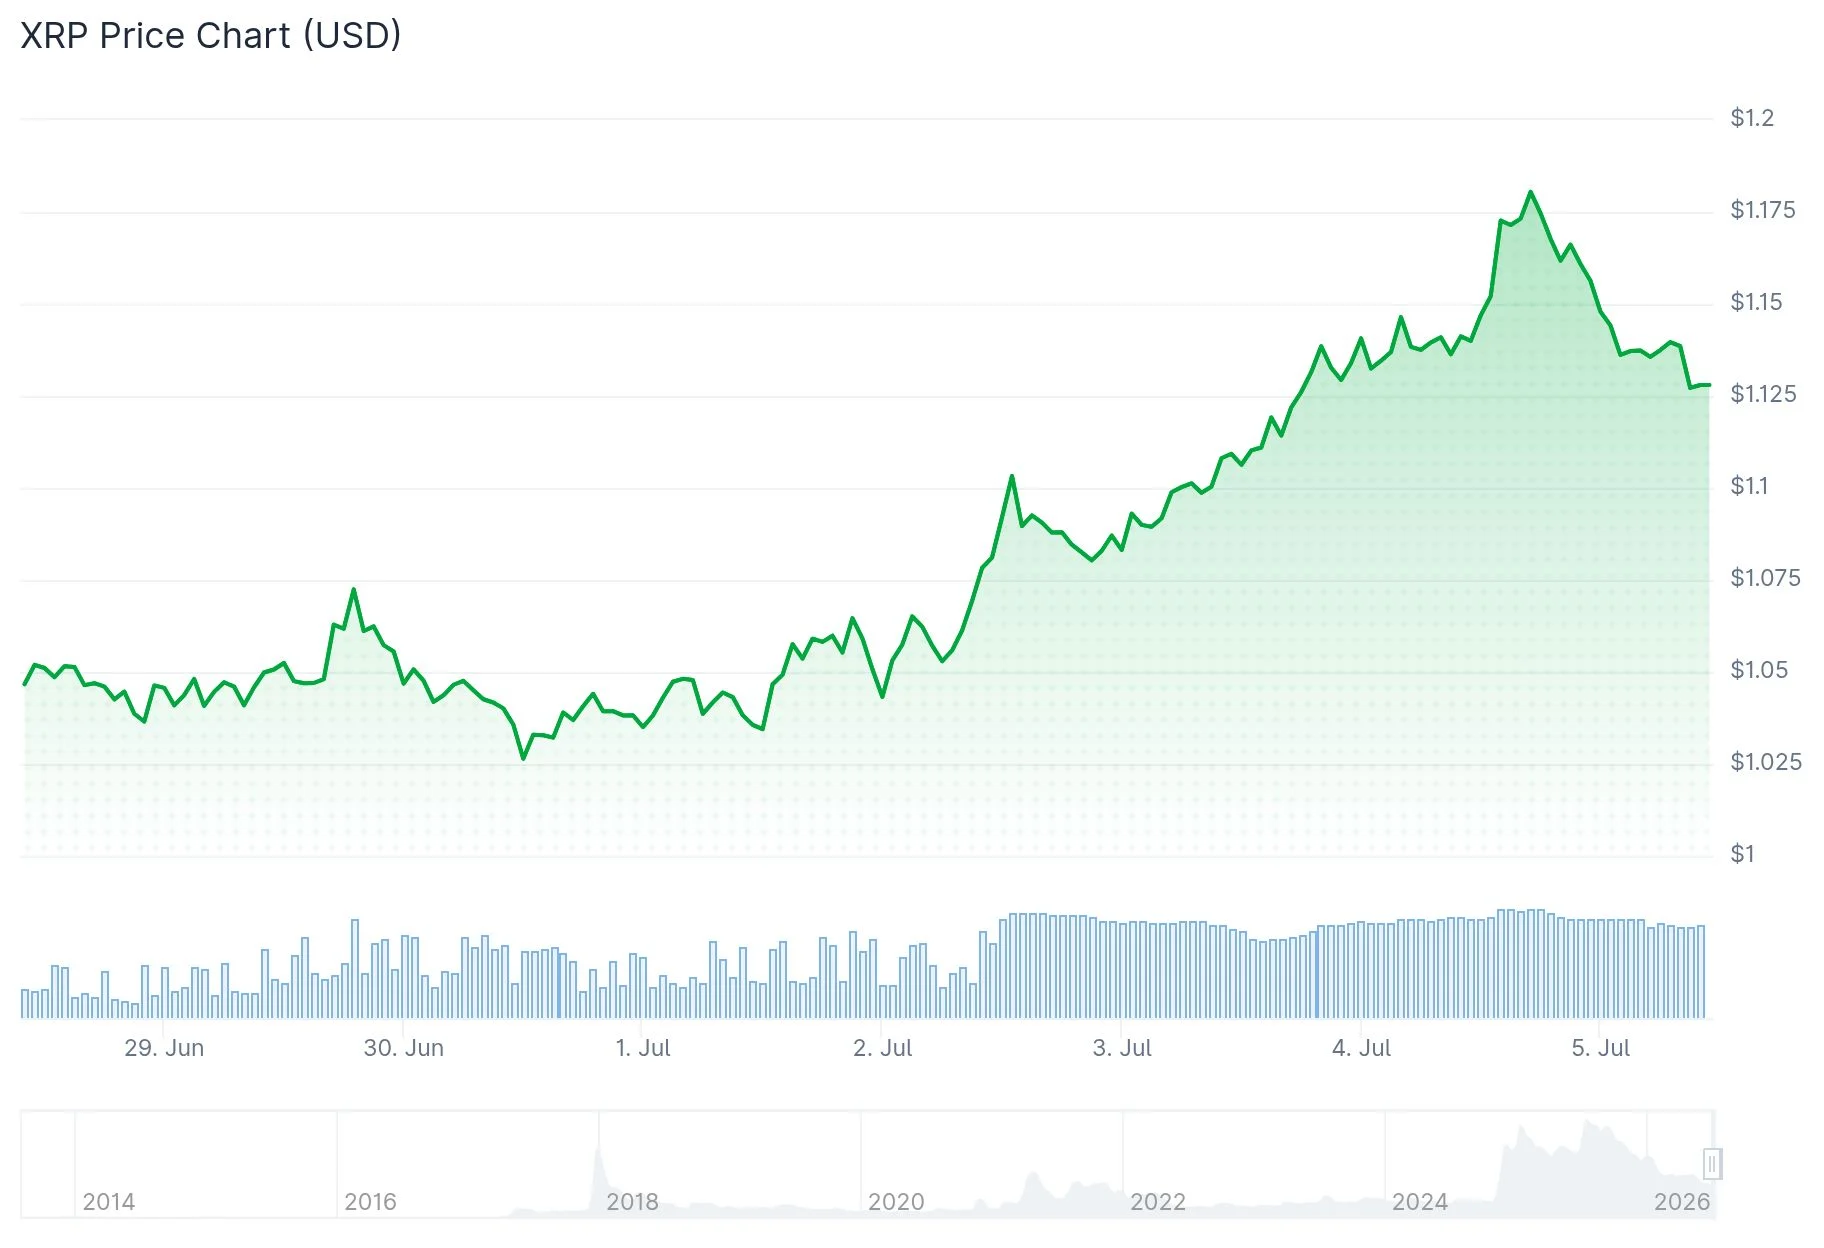
This upward movement coincided with a wider cryptocurrency market rebound. The aggregate crypto market capitalization increased 0.86% to reach $2.18 trillion. Bitcoin surged beyond $62,000, while Ethereum advanced above $1,700.
Disappointing U.S. employment figures contributed to the bullish market sentiment. The American economy generated merely 57,000 positions in June, significantly undershooting the anticipated 110,000. This development strengthened expectations for more accommodative monetary conditions moving forward.
Market analyst ChartNerd (@ChartNerdTA) highlighted a significant long-term technical formation via X, identifying an 8.5-year cup and handle pattern emerging on XRP’s price chart. He cautioned that overlooking XRP at the $1 level “could prove costly,” suggesting that sustained Fibonacci support within the handle formation could establish a pathway toward upper resistance zones. His analysis referenced Fibonacci extension targets at $8, $13, and $27.
Legislative Developments Strengthen XRP Sentiment
Advancement of the CLARITY Act through the U.S. Senate emerged as a primary catalyst for XRP’s appreciation. This proposed legislation carries implications for the regulatory classification of digital assets under American law.
Market participants reacted favorably to XRP’s inclusion within the SEC/CFTC Digital Commodities classification framework. This development prompted capital reallocation into XRP positions. Additionally, Ripple co-founder Chris Larsen’s financial stake in American Perpetuals Exchange Corporation — an entity associated with Senator Kirsten Gillibrand’s son — attracted market attention throughout this timeframe.
Investment Fund Activity Supports Bullish Momentum
XRP-focused investment vehicles registered $6.55M in daily inflows as of July 2. Total cumulative inflows climbed to $1.49B, while net assets under management stood at $987.91M.
Spot Bitcoin ETFs similarly reversed their outflow trend on July 2, posting $221.72M in daily net inflows. This marked the conclusion of a 10-day withdrawal period, elevating cumulative net inflows to $51.08B. Ethereum spot ETFs contributed $29.08M in net inflows during the identical session.
Historical performance data compiled by CryptoRank demonstrates July’s track record as a consistently profitable period for XRP across seven consecutive years. Average July performance since 2013 registers at 10.4%. Notably, during July 2020, XRP surged more than 48%.
Examining the four-hour timeframe, XRP traded around $1.1714. The Relative Strength Index registered 79.91, positioning the asset within overbought parameters. The Chaikin Money Flow indicator displayed 0.21, signaling continued accumulation pressure.
Immediate resistance is established at $1.20, where a decisive breakthrough could enable progression toward $1.25. Should prices retract beneath $1.15, the subsequent support zone emerges at $1.10.

Ledger co-founder Eric Larchevêque says a Bitcoin (BTC) price of $1 million would not be good news. He argues the level would reflect war, debt crises, and a collapsing fiat system rather than mainstream success.
The comment cuts against a wave of seven-figure forecasts. Larchevêque accepts the destination but rejects the celebration, casting Bitcoin as insurance against disorder rather than a speculative jackpot.
Why a $1 Million Bitcoin Would Signal Trouble
Larchevêque made the argument in a recent interview on the When Shift Happens podcast. He said Bitcoin has little value in a stable world where few people need it.
Its role grows when systems break. He described the asset as a final settlement tool that protects wealth through wars, revolutions, and capital controls.
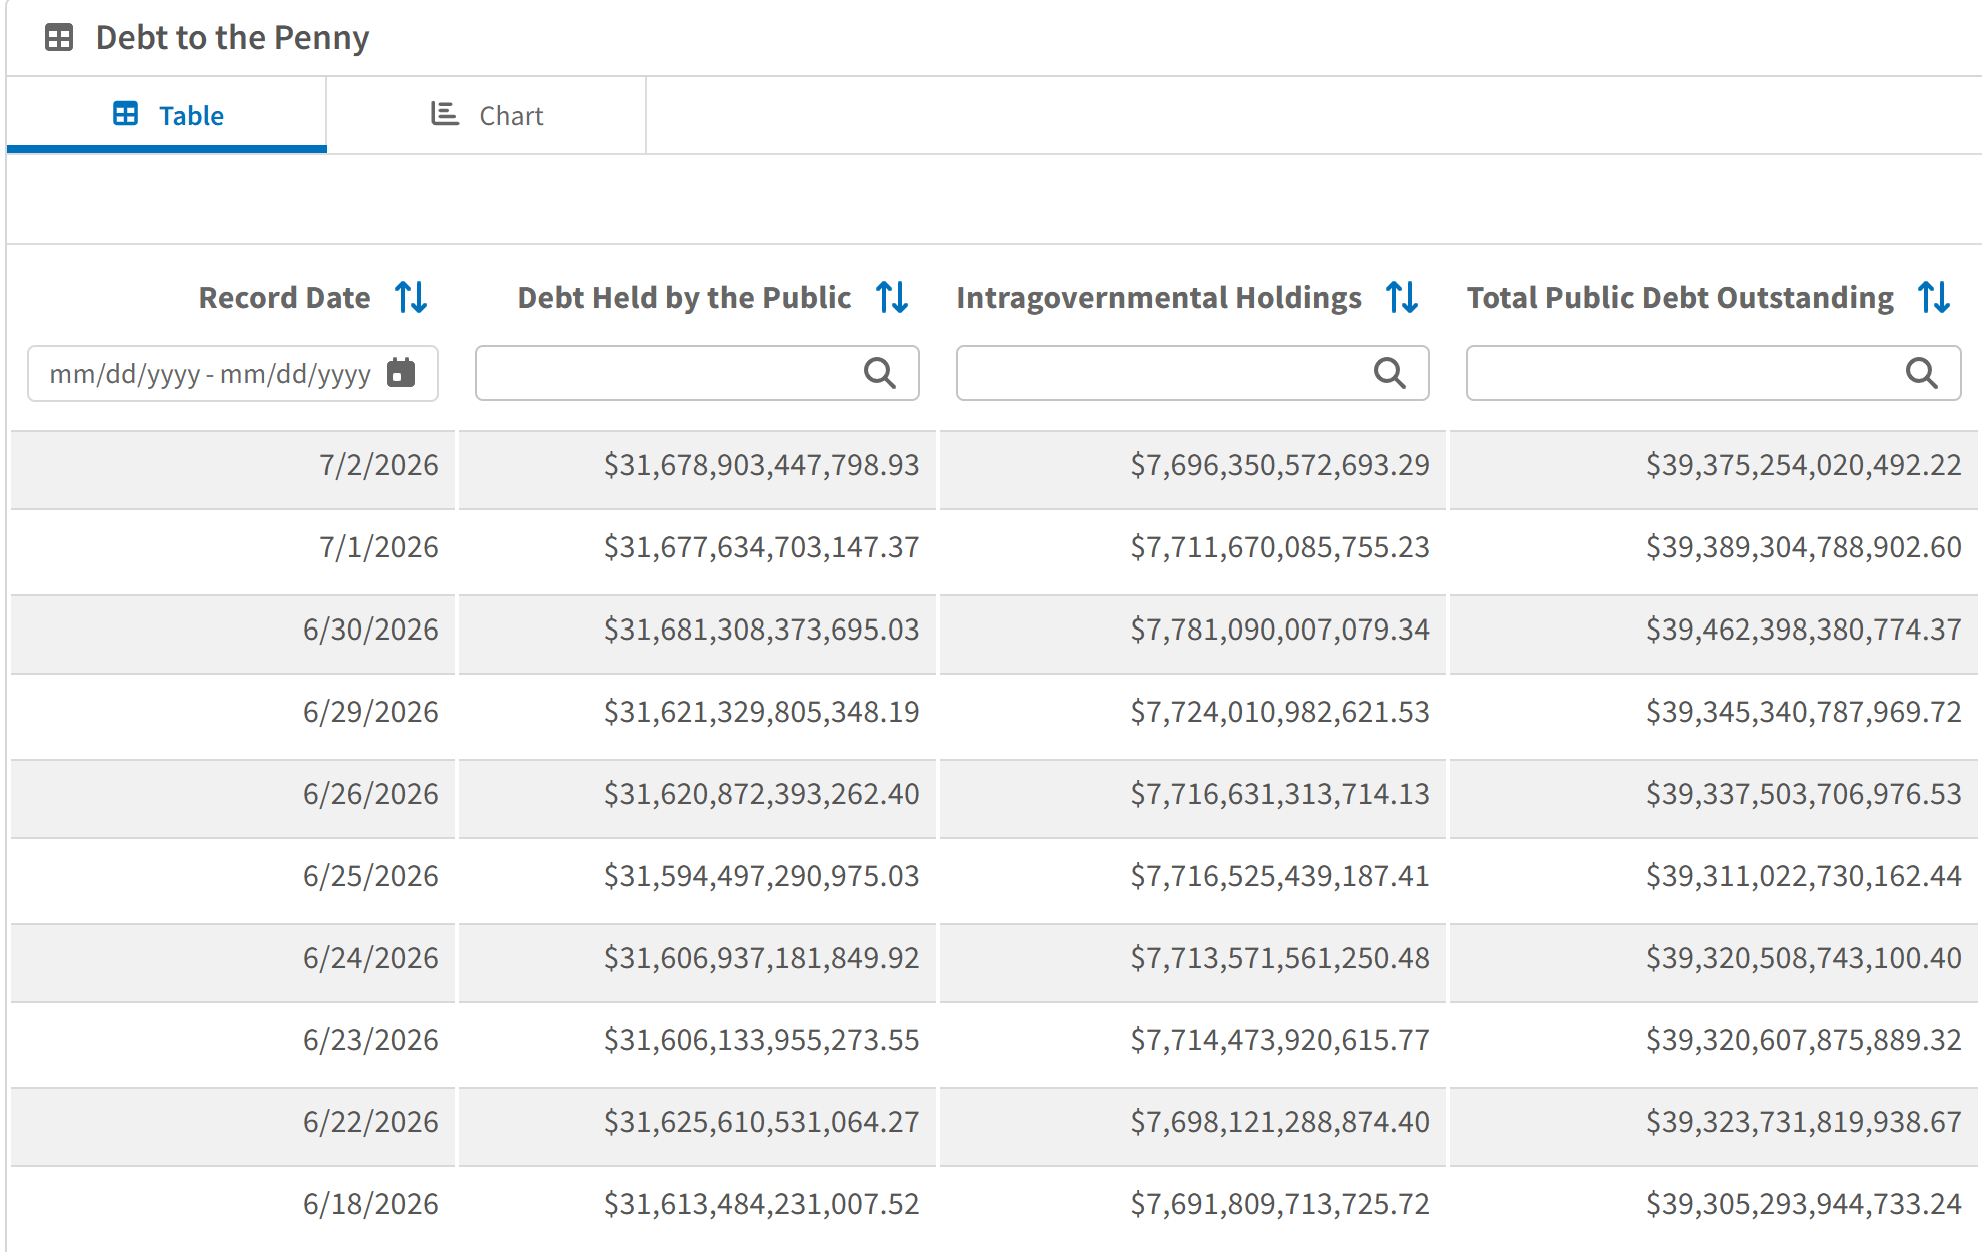
That thesis leans on a real backdrop. Governments keep piling on debt, and the US alone now owes more than $39 trillion, a fresh record. Larchevêque sees that kind of borrowing ending in currency failure.

The meaning also shifts by geography, he added. For someone in Iran, Bitcoin can be a lifeline. For a comfortable saver in France, it can feel abstract.
Bitcoin now trades just below $63,000, leaving any move to $1 million approximately 16 times away. Larchevêque expects that climb, yet dreads the world that would produce it.

“I think it’s a world with a lot of suffering,” he said.
Follow us on X to get the latest news as it happens
He offered that answer when asked what a $1 million or $10 million Bitcoin would look like.
How the Bulls Frame the Same Target
Other forecasters reach $1 million through optimism. VanEck research head Matthew Sigel calls it a base case within about five years, tied to adoption and Bitcoin’s fixed supply of 21 million coins.
The timing detail matters. Sigel floated that target in May, when Bitcoin traded near $80,000. The token has since slipped to about $63,000, widening the gap to seven figures.
Jan3 chief Samson Mow expects a sudden supply shock he calls an omega candle, a single-day jump above $100,000. Michael Saylor and ARK Invest lean on the same scarcity story, pointing to institutional demand and long-term 2030 targets.

Larchevêque shares that price conviction and even cites Saylor. He splits from the group on meaning, treating a seven-figure print as a symptom of failure rather than a reward.
“I share the same vision and Michael Saylor that Bitcoin is the best assets possible, you know, globally, historically. And that’s it’s going to be a very good bet in in the future.”
The Ledger founder keeps almost all of his liquid net worth in Bitcoin, framing it as protection instead of profit. He also insists the call is not investment advice.
The post Bitcoin at $1 Million? Ledger Co-Founder Warns It Won’t Be Good News appeared first on BeInCrypto.
2026 hasn’t been bitcoin’s year so far, with the asset posting four (out of six) months in the red. June stands out as the most painful, setting a four-year anti-record.
However, history is on BTC’s side for July, and its start has been quite promising. The question is whether the asset will be able to follow through in the following weeks.
June Bad, July Good?
Before we explore what happened in June, we must go back to the breaking point in May. In the middle of that month, BTC’s price surpassed $82,000, prompting many analysts to speculate that the asset had erased much of its yearly losses and had kickstarted the next bull run.
However, the reality was different as the rejection at that level poured more fuel into the ‘sell in May and go away’ narrative. The culmination took place in June as the cryptocurrency plummeted below $70,000 and even beneath $60,000 on a few occasions for the first time since before the US presidential elections in late 2024.
After losing roughly $25,000 in weeks, BTC finally showed some early signs of revival and regained some traction by the end of the month. However, it still finished it with a 20.5% drop, making it the worst since June four years ago.

The chart above demonstrates that July tends to be a more favorable month for BTC, as nine out of the last 13 editions have brought gains. Moreover, each July that has followed a red June has been in the green.
The Factors
The 2026 edition has started on the right foot, with BTC tapping $63,000 this weekend. However, several factors have to improve in the following weeks for the month to finally provide a well-deserved break. First, the record-setting net outflows from the spot Bitcoin ETFs have to stop, which have been halting BTC’s progress for months now.
Second, recent on-chain data showed that real demand from US (and even Korean) investors has been missing, proven by the Coinbase Premium metric. On a more macro level, a potential de-escalation (or a permanent peace deal) in the Middle East would definitely help, as would clearing up the uncertainty around the midterms in the US.
Topping this more positive side, bitcoin recently flashed a few bullish signals after it rebounded past the coveted $60,000 level, and analysts are now eyeing the next major breakout.
Rekt Capital also weighed in on BTC’s performance in July, suggesting that the cryptocurrency will look to turn the 50-Month EMA (at around $65,000) into resistance.
It’s Green July and history suggests Bitcoin will be looking to turn the 50-Month EMA (purple) into new resistance$BTC #Bitcoin https://t.co/5JhfpTAvtn pic.twitter.com/Zn3KEAeKqI
— Rekt Capital (@rektcapital) July 4, 2026
The post Bitcoin Just Had Its Worst Month in 4 Years: What’s Next in July? appeared first on CryptoPotato.


Ledger co-founder Eric Larchevêque said a future where Bitcoin trades at $1 million, or even $10 million, may not be a healthy one. Wu Blockchain reported that he made the comments in a June 25 interview with When Shift Happens.
Summary
- Larchevêque framed $1m Bitcoin as a stress signal, not just another bullish market price target.
- He said Bitcoin matters more when banks, currencies and governments fail to protect personal wealth.
- Crypto.news reports show debt fears, ETF flows and macro pressure still shape Bitcoin demand
Larchevêque linked a high Bitcoin price to stress in the global money system. He said such a world may include wars, fiat currency failures, debt problems and social unrest. His message was not a simple bullish Bitcoin price call.
https://x.com/WuBlockchain/status/2073482161425109085
He said “a world where Bitcoin reaches $1 million or even $10 million may not be a good one.” The comment placed the Bitcoin $1 million debate in a wider macro setting, where price gains may reflect fear as much as demand.
Bitcoin as a final settlement asset
Larchevêque said Bitcoin has little use in a perfect world because people would not need it. In his view, Bitcoin becomes more important when trust in banks, currencies and governments weakens.
He described Bitcoin as a final settlement asset and a tool for wealth protection. That view matches a common Bitcoin argument: users value direct ownership most when access to money becomes uncertain.
He also said Bitcoin does not mean the same thing to everyone. For people in Iran and France, he said, the asset carries different meanings because local risks are different.
Ledger’s background gives the comments added weight in the crypto custody debate. Larchevêque co-founded Ledger in 2014, while Pascal Gauthier later became CEO.
Crypto.news links debate to debt pressure
The comments came as crypto.news reported on similar Bitcoin and macro themes. In a recent report, Bitwise linked Bitcoin demand to rising debt pressure and bond market stress.
That report said Bitwise sees sovereign debt concerns as part of the case for Bitcoin. It also noted that global borrowers face a heavy refinancing calendar in 2026, which could keep attention on fiat liquidity and central bank policy.
Crypto.news also reported that CZ still sees Bitcoin reaching $1 million over the next decade. His view came even as U.S. spot Bitcoin ETFs saw outflows and Bitcoin tested key price levels.
This creates two different readings of the same target. Some market figures treat $1 million Bitcoin as a long-term adoption case. Larchevêque presented it as a warning about the state of fiat money.
ETF flows keep market cautious
Bitcoin has also faced near-term pressure from exchange-traded fund flows. Crypto.news reported that U.S. spot Bitcoin ETFs saw heavy outflows in June, even while large wallets accumulated around 270,000 BTC.
That split shows a market moving in different directions. ETF investors reduced exposure, while large on-chain holders added Bitcoin during weakness. The gap has kept attention on whether institutional demand can return.
Crypto.news also reported that Bitcoin rebounded near $61,700 after ETF inflows ended a 10-day negative streak. Analysts in that report said BTC needed to reclaim $62,800 and $65,000 to confirm a stronger recovery.
At press time, Larchevêque’s comments add a cautious angle to the Bitcoin $1 million discussion. The price target remains popular, but his view suggests that a fast move to that level may say more about fiat risk than crypto strength.
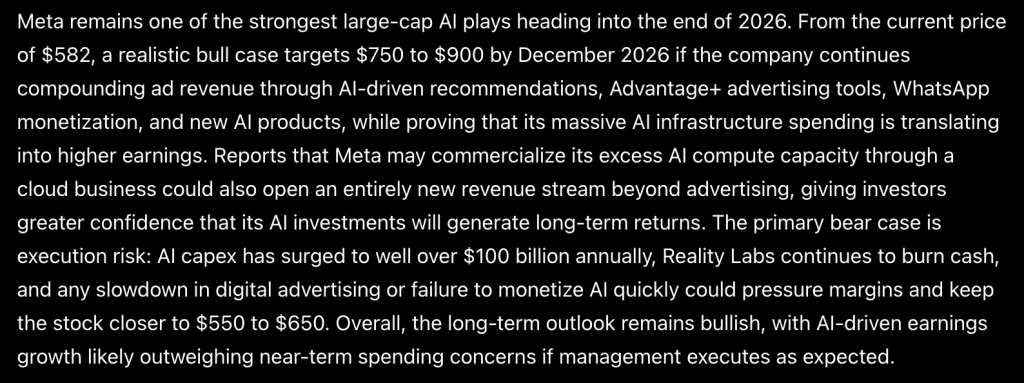
Sam Altman, ChatGPT AI predicts that Meta stock is at one of the more interesting entry points in years for a stock that has already proven it can trade well above current levels.
The model sees $750 to $900 by December 2026, a range the stock has already visited once this cycle.
The bull case treats Meta as an advertising business that is quietly becoming an AI infrastructure company at the same time. Meta trades near $582 today, and the thesis starts with the core engine that has driven the stock for years, AI-driven ad recommendations compounding revenue quarter after quarter.
Advantage+ advertising tools keep taking market share from competitors, WhatsApp monetization is still in early innings with enormous room to grow, and new AI products are adding layers on top of the existing user base.

The model also flags something potentially transformative that most investors have not fully priced in yet. Reports suggest Meta may commercialize its excess AI compute capacity through a cloud business, which would open an entirely new revenue stream beyond advertising and give investors far greater confidence that the massive AI infrastructure spending is generating real long-term returns rather than just burning cash.
If those threads pull together, the model sees a clear path back toward those 2025 highs and beyond.
The bear case comes down to execution risk on a scale that is hard to ignore.
AI capital expenditure has surged to well over $100 billion annually. Reality Labs keeps burning cash without a clear profitability timeline, and any slowdown in digital advertising demand or failure to monetize AI products quickly enough could pressure margins and keep the stock rangebound between $550 and $650 for an extended period instead of breaking out.
Discover: The Best Crypto to Diversify Your Portfolio
Meta Stock Price Prediction: Meta Knows Exactly What $750 Looks Like Because It Has Already Been There
The daily chart shows Meta at $582.90 after a sharp pullback from highs near $800 set back in the summer of 2025. That peak marked one of the strongest runs in this stock’s entire history before sellers stepped in hard through the second half of last year.
Price found support near $525 in late 2025 before bouncing back toward $750 in early 2026, then rolled over again and has spent most of this year grinding between $550 and $680 in a wide, choppy range.
The most recent leg lower in late June pushed the price back down toward $555 before today’s candle bounced to $582.90, which puts Meta right in the middle of that broader consolidation range.
Resistance sits first near $630, the level that capped the most recent relief rally attempt, then a much heavier ceiling near $680 where multiple rejections have piled up throughout 2026.
Above that, the $750 level sits as the lower end of the bull case target and also as a prior high from earlier this year, making it a meaningful technical checkpoint before any run toward $800 or $900 becomes realistic.
Support holds near $550, the zone that has absorbed selling pressure multiple times over the past several months. The overall pattern here looks like a stock in a long consolidation phase after an extraordinary run, working off excess valuation rather than breaking down structurally.
Momentum on the daily candles looks indecisive and choppy, without a clear directional trend over the past several months. If Meta can push above $630 and hold it, the path back toward the bull case targets starts to look like a continuation of the longer-term uptrend rather than a stretch into territory this stock has never seen before.
Don’t Miss Out on Our $1,000 USDT Airdrop on ByBit
LiquidChain Is Catching the Attention of META holders: ChatGPT AI Predicts It’s the Next 100x
The rotation is already happening. Most people will only see it in hindsight.
Large-cap crypto is not failing. It is capped. Bitcoin, Ethereum, and XRP have been pressing against the same resistance bands for weeks. The macro tailwinds keep getting delayed.
The institutional inflows keep getting pushed to next quarter. Holding assets where the upside depends on catalysts you cannot control is not a strategy. It is waiting.
A capital that has navigated enough cycles does not wait at resistance. It moves before the destination becomes obvious.
Early-stage infrastructure plays operate on different math entirely. A small enough market cap means a modest rotation produces dramatic price movement. The asymmetry exists because the market has not priced in what is being built yet. That gap between current valuation and what the project is actually worth is where the returns come from.
Multi-chain fragmentation costs DeFi real money every single day. Bitcoin, Ethereum, and Solana run completely isolated liquidity systems with no native way to connect them. Every user moving value between ecosystems absorbs that cost directly in fees, slippage, and failed transactions.
LiquidChain collapses all 3 networks into a single execution layer. One deployment. Full ecosystem access. No cross-chain tax on every interaction.
The market has not found this yet. That is the entire point.
The presale is at $0.01454 with just over $820,000 raised. Ground floor is not a marketing phrase here. It is a description of where this actually sits in its lifecycle.
Execution is unproven. Adoption is unknown. Those risks are real and worth naming directly. Established assets offer a smoother ride toward a ceiling that is already visible. This offers an earlier seat
Explore the LiquidChain Presale
The post Sam Altman ChatGPT AI Predicts Massive Meta Platforms Stock Price Surge by 2026 appeared first on Cryptonews.
Binance has seen a pronounced shift toward withdrawal activity, with weekly net outflows jumping to $1.23 billion—more than doubling from the week prior—while Ethereum withdrawals rose to their highest level in over three years. The pattern is drawing renewed attention from on-chain analysts because it suggests large volumes of ETH may be moving off exchanges, even as ether’s price begins to stabilize.
Data from DefiLlama, as reviewed by Cointelegraph, shows Binance recorded $1.23 billion in net outflows for the week beginning June 29. That figure represents a 207% increase versus about $400 million in net outflows during the preceding week, while monthly net outflows totaled roughly $3.2 billion. At the same time, CryptoQuant community analyst Darkfost reported that Binance’s Ethereum withdrawal transactions reached a multi-year peak—over 166,000 withdrawals in a single day.
Key takeaways
- Binance’s weekly net outflows rose to $1.23 billion in the week starting June 29, up 207% from roughly $400 million the week before.
- Ethereum withdrawal transactions on Binance hit the highest level in more than three years, exceeding 166,000 withdrawals in one day.
- Analysts link the withdrawals to both potential accumulation behavior and market/regulatory uncertainty tied to the EU’s MiCA transition.
- Other major centralized exchanges also posted outflows, while inflows appear more scattered across several platforms.
Ethereum withdrawals intensify as exchange balances change
The most striking element of the move is the concentration on Ethereum. Darkfost, writing for the CryptoQuant community, said Binance ETH withdrawal transactions reached their highest point in more than three years, indicating that the surge is not just routine exchange movement. The analyst also pointed to specific dynamics that could be influencing investor decisions around the time of the withdrawals.
Cointelegraph previously noted regulatory uncertainty connected to the European Union’s application timeline and enforcement environment as the Markets in Crypto-Assets Regulation (MiCA) framework comes into focus. Darkfost suggested this uncertainty—alongside near-term positioning by traders—could help explain why more users are pulling ETH off Binance.
Even if some withdrawals are consistent with accumulation behavior, the key takeaway for traders and long-term investors is what the directionality implies: increased transfers from exchange custody typically reduce readily available liquidity on that venue. While that does not automatically translate into immediate price gains, it can affect how markets absorb sells and buys.
Withdrawal surge coincides with ether’s modest rebound
CryptoQuant data highlighted a timing alignment between exchange activity and price performance. Darkfost noted that Binance’s ETH withdrawals represented the sharpest rise in withdrawal transactions recorded on the exchange since March 2023, occurring as ether posted a modest rebound of around 10% over two days.
In a separate framing, Darkfost characterized the withdrawal surge as potentially reflecting genuine demand building around the $1,500 area. The rationale is that some participants may prefer to hold ETH in self-custody rather than keep exposure on an exchange, behavior that more often aligns with longer-term accumulation than short-term trading.
Price data at the time of publication suggested ether’s recovery broader in scope. According to CoinGecko, ETH rose about 12.5% over the past seven days, trading around $1,766. Over the same period, Bitcoin edged up approximately 4.3% to about $62,925, also based on CoinGecko’s figures.
Centralized exchange flows: outflows lead, inflows remain uneven
Binance was not acting in isolation. DefiLlama’s exchange flow data indicates that centralized exchange net flows skewed toward outflows across multiple platforms over the same week. Bitfinex recorded $407.5 million in outflows, followed by Gate with $214.3 million. OKX saw $87.1 million in outflows and Bybit posted $78.4 million, underscoring that the broader pattern is not limited to a single venue.
On the opposite side of the ledger, inflows were present but more fragmented. Crypto.com led with about $63 million in net inflows, while HashKey Exchange added roughly $53.3 million. Additional inflows appeared across KuCoin (about $22.1 million), Gemini (about $17.4 million), and Bitvavo (about $15.8 million).
For market participants, this mix can matter because it hints at where new risk might be concentrating. When outflows dominate across multiple large exchanges, it often suggests a shift in custody preferences—either toward self-custody or toward venues not classified as “top movers” by weekly net flows.
Why this matters as regulatory pressure and market positioning evolve
The withdrawal surge comes at a time when European crypto market participants have been adjusting to regulatory uncertainty around MiCA. Darkfost specifically cited uncertainty related to MiCA and short-term positioning as possible contributors to the elevated withdrawal activity. While the exact share of withdrawals driven by regulation versus trading strategy is not provable from the available data alone, the combination is consistent with what investors frequently do during transitional periods: reduce exposure to venues where compliance timelines or operational constraints may become clearer.
At the same time, it would be premature to interpret every outflow event as a bullish signal. Some withdrawals can reflect operational transfers, liquidity management, or rebalancing between services. Still, the scale—particularly the jump in daily ETH withdrawal transaction counts to a level not seen in more than three years—means investors will likely watch whether the trend continues and whether it corresponds to further shifts in exchange balances.
Next, readers should focus on whether Binance’s ETH outflows remain elevated over subsequent weeks and whether similar patterns appear on other major venues, while also tracking ongoing developments in EU MiCA implementation that can alter how and where users prefer to hold assets.


U.S. spot Bitcoin ETFs recorded about $527 million in net outflows over the four trading days ending July 2. The loss marked the eighth straight negative week for the funds and set their longest weekly outflow run since launch.
Summary
- Bitcoin ETFs posted their eighth weekly outflow, even after July 2 brought renewed daily inflows.
- IBIT extended its redemption run, while Fidelity and ARK funds led the rebound day overall.
- Ether ETFs also stayed negative for the week, but Hyperliquid products still attracted new capital.
The weekly decline came even after the products returned to daily inflows on July 2. The data showed that one strong session was not enough to erase heavy redemptions from earlier in the week.
The latest run also followed a weak June for the sector. According to crypto.news, U.S. spot Bitcoin ETFs saw more than $4 billion leave the products during June, making it their worst month since approval.
July 2 inflows break daily losing run
The daily picture improved on July 2, when Bitcoin ETFs recorded $221.7 million in net inflows. That ended a 10-day withdrawal streak that had pulled nearly $2.7 billion from the funds.
Fidelity’s FBTC led the rebound with about $166 million in inflows. ARK 21Shares’ ARKB added about $91.8 million, while VanEck’s HODL drew about $4.4 million.
BlackRock’s IBIT still moved in the opposite direction. The fund posted about $40.4 million in net outflows, extending its redemption run to 11 straight trading days.
That split kept doubts around the recovery. Crypto.news noted that “One $221 million day against a month of $4 billion proves nothing,” as traders looked for more green sessions across several funds.
IBIT remains the main source of selling
IBIT remained the key drag on weekly flows. Farside data showed that the BlackRock fund lost money on each trading day from June 29 through July 2, while some rival funds showed mixed demand.
The fund’s outflows stood out because IBIT has been the largest spot Bitcoin ETF by assets and trading activity. When the largest product keeps bleeding, it can weigh on the full sector even when smaller funds attract fresh capital.
The pattern also showed that ETF demand had not fully recovered. A stronger trend would require more than one inflow day and broader buying across the largest funds.
Bitcoin recovered during the same period. Crypto.news reported that weak U.S. jobs data and softer Federal Reserve comments helped Bitcoin move back above $61,000 after falling below $58,000 earlier in the week.
Ether and Hyperliquid funds show mixed flows
U.S. spot Ethereum ETFs also ended the four-day period in negative territory. The products saw net outflows for the week, even though they posted positive daily flows on July 1 and July 2.
BlackRock’s ETHA recorded about $29.7 million in inflows on July 2. That helped the Ethereum ETF group post a positive daily result, but it did not fully offset earlier losses.
Hyperliquid ETFs stayed positive for the week, but demand slowed. Farside data showed about $4.3 million in net inflows across June 29 to July 2.
The figure was far below the previous week’s strong total. This showed that demand for smaller crypto ETF products remained active, but investors moved with more caution.
Market focus shifts to ETF breadth
The next focus for traders is whether ETF inflows can spread across more products. A single strong day can ease pressure, but it does not confirm a wider recovery.
The market will also watch IBIT closely. If BlackRock’s fund continues to record outflows, the ETF sector may stay under pressure despite inflows into rival products.At the same time, whale activity has sent a different signal. Crypto.news reported that large Bitcoin wallets accumulated about 270,000 BTC while ETFs saw record outflows in June.
As of then, the data shows a split market. ETF investors have reduced exposure for eight weeks, while some large on-chain holders have added Bitcoin during the selloff.
Vitalik Buterin has outlined Lean Ethereum, a sweeping redesign he calls the network’s third major evolution after the Merge. The upgrades will roll out across three to four years, touching nearly every core part of the protocol.
Buterin shared the plan through a public roadmap he calls the strawmap, an Ethereum Foundation draft. He said almost every major piece will be replaced, calling the effort ambitious yet low-risk.
What Lean Ethereum Changes
Recursive STARKs sit at the center. The cryptographic proof system would verify the chain rather than force every node to re-execute transactions. Buterin wants these proofs enshrined as a core protocol component.
Quantum safety has also jumped up the list. The roadmap swaps quantum-vulnerable cryptography for hash-based schemes built to outlast quantum computers. The shift echoes NIST, the US standards body that finalized its first post-quantum encryption standards in 2024.
The most disruptive change targets how Ethereum stores data. Buterin would keep today’s core protocol architecture largely intact. He would add a restrictive new state type that scales toward 100 TB by 2030.
Rewriting an ERC-20 token or non-fungible token (NFT) into that format could cut fees more than 10x. Complex apps like decentralized exchanges would stay put.
Privacy becomes a first-class goal, not an afterthought, extending Buterin’s broader privacy push. Nearer term, the upcoming Glamsterdam upgrade should raise the gas limit.
Buterin has reason for confidence. The 2022 Merge moved Ethereum to proof of stake and cut its energy use by more than 99%. It shipped with little disruption to users or apps.
“But make no mistake, this IS the third major iteration of Ethereum in the same way that the Merge was the second,” Vitalik Buterin articulated.
Follow us on X to get the latest news as it happens
Not Everyone Buys the Timeline
The schedule drew fast pushback, and not from outsiders. Dankrad Feist praised the vision but called three to four years far too slow. The Ethereum Foundation researcher’s data-scaling work gave danksharding its name.
“Fully proven STF and scaling to Gigagas with finality in seconds gets me excited! But 3-4 years is very slow… I think we should be ambitious and get it done in ~1 year. I think this is realistically possible now with LLMs,” Dankrad Feist suggested.
His faith in AI is not fringe. The strawmap itself assumes human-first development and concedes that AI-accelerated research could compress the timeline.
Others were more cautious. Some urged the Foundation to underpromise, drawing the reply that underpromising only leads to under-delivery.
The stakes are practical. The overhaul arrives weeks after a leaner Ethereum Foundation cut about 20% of its staff, or 54 roles. It has also moved to a tighter, endowment-style budget.
The strawmap remains a draft, not a schedule. Buterin said the coming Hegotá fork is likely the last before the Lean era begins.

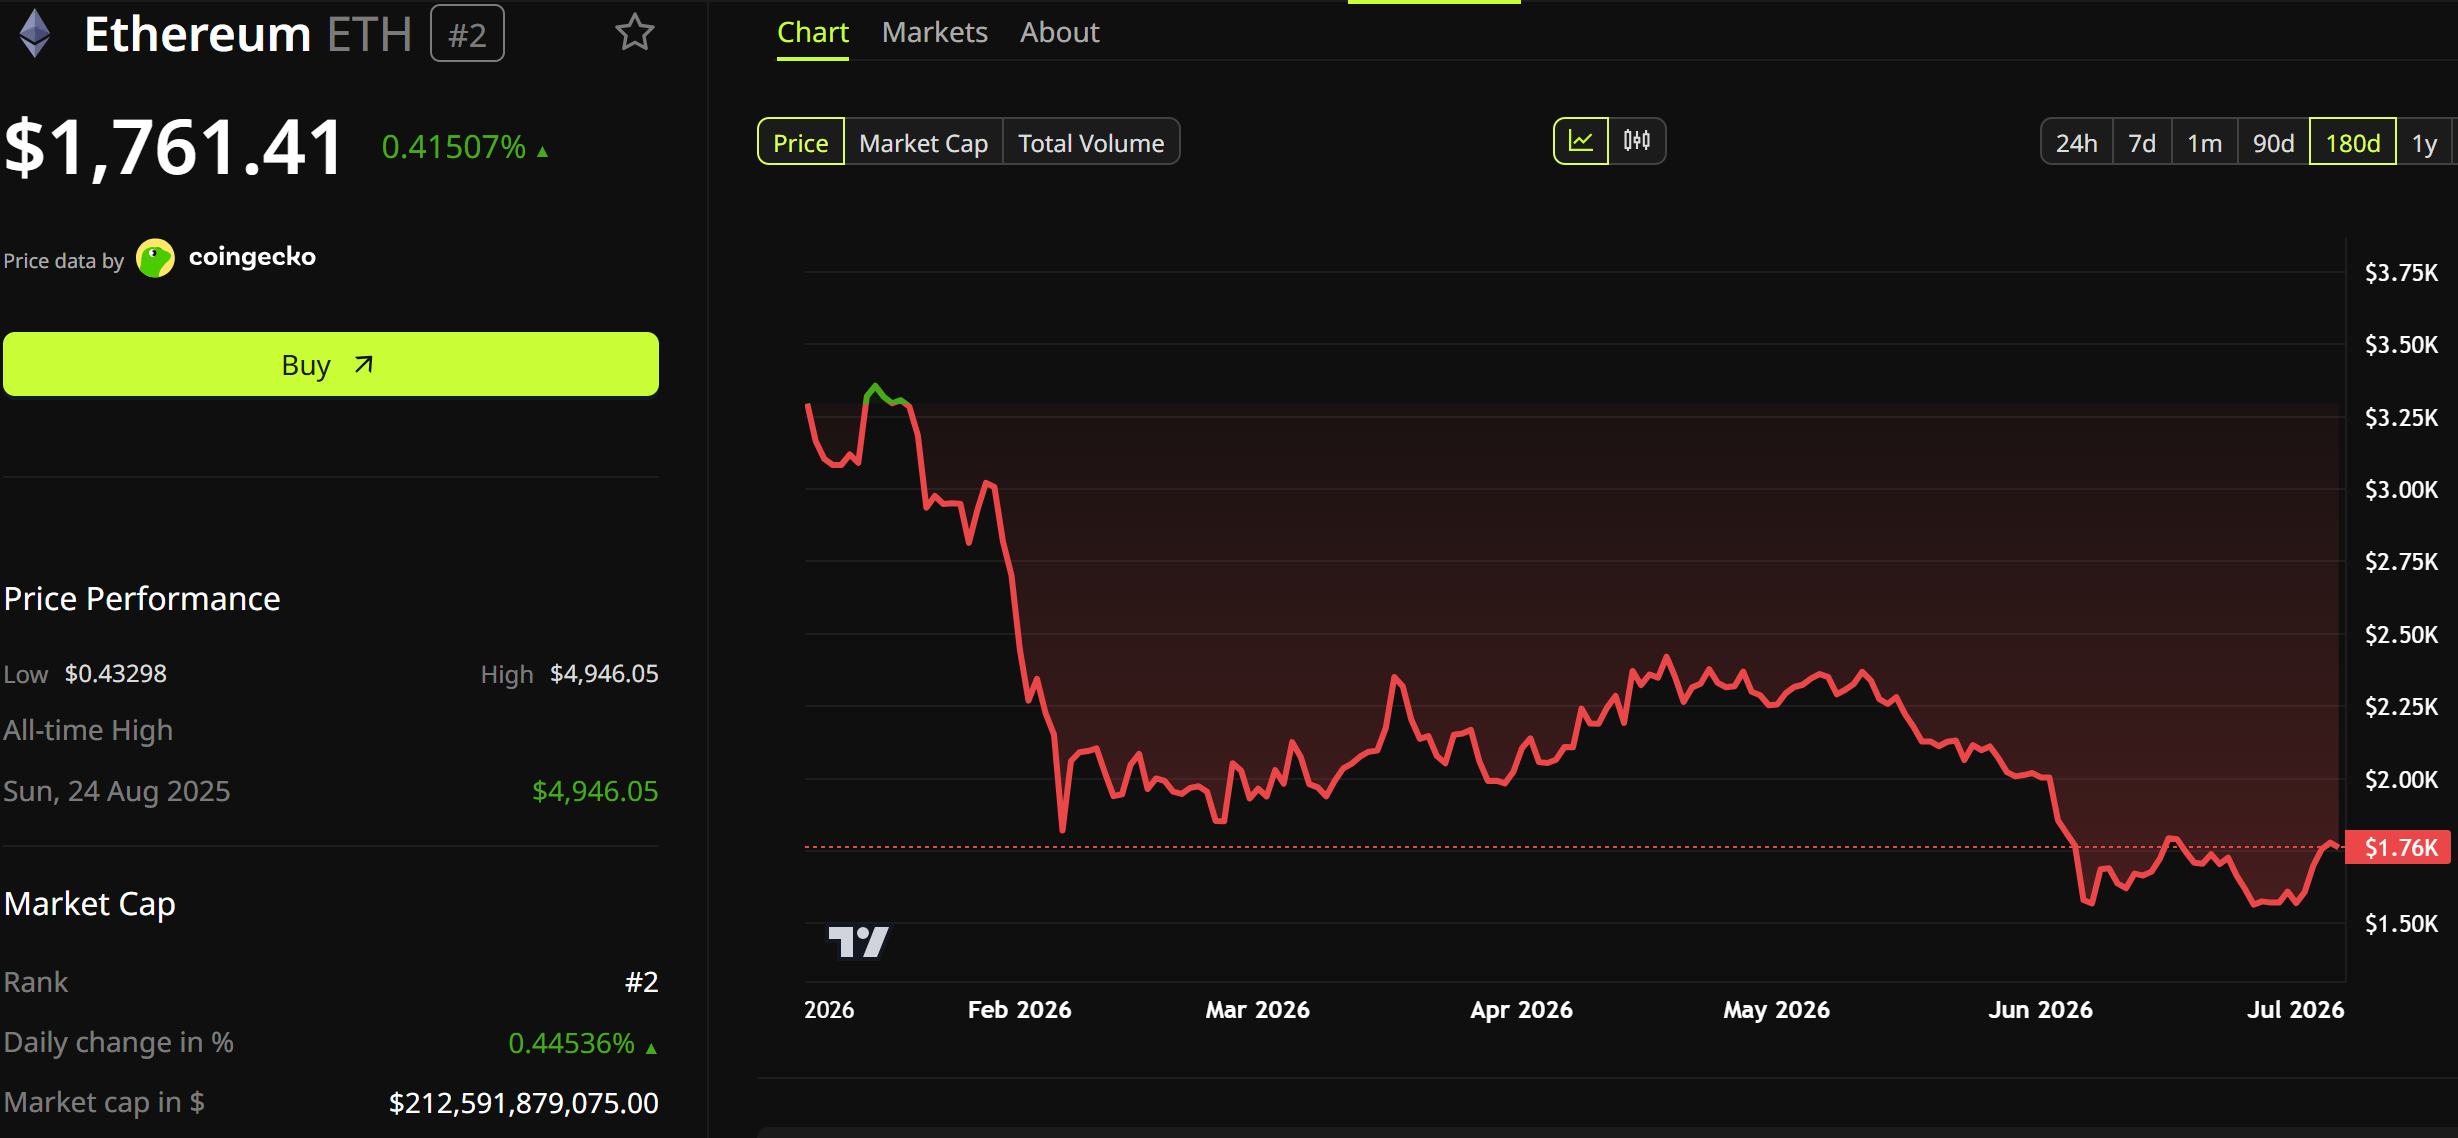
Ether (ETH) has fallen about 41% in 2026 to near $1,760. For now, its market price reflects a market waiting on delivery, not promises.
The post Vitalik’s Lean Ethereum Roadmap Draws Pushback on Its Timeline appeared first on BeInCrypto.
TLDR:
- Ethereum price prediction now centers on the $1,779 resistance level after ETH gained 4.73% and moved back near a critical short-term range.
- ETH reclaimed attention after moving above $1,750, while traders now watch whether the level can hold as support in the coming sessions.
- Whale activity, Binance outflows, and spot ETF interest are improving sentiment, although weak network activity still limits bullish conviction.
- A break above $1,779 could open the way toward $1,850 to $1,900, while a drop below $1,633 may renew downside pressure.
Ethereum price prediction has turned sharply toward the $1,779 resistance zone after ETH rose 4.73% to $1,690.61 in the latest session. The move came as traders watched whether Ethereum could hold above the recently reclaimed $1,750 area. Market analyst Ted says ETH could move toward $1,850 to $1,900 as long as that level holds.
Still, the rebound comes after a weak quarterly stretch. Ethereum has faced falling network activity, mixed ETF demand, and pressure below key moving averages. That makes the next resistance test important for short-term direction.
Ethereum Price Prediction Focuses on the $1,779 Barrier
Ethereum price prediction now depends heavily on whether buyers can clear the $1,779 resistance level. That area aligns with the Ichimoku Kijun and sits close to the MA-20 at $1,775 and MA-50 at $1,756. A clean move above that cluster could shift the short-term structure.
The market is also watching the $1,753 zone. This level previously acted as support and now sits near the first major test for bulls. If ETH holds above it, traders may view the recent drop as a failed breakdown.
Meanwhile, the broader setup remains uneven. ETH has traded below several former support levels, including $1,925, $2,175, and $2,375. These zones may now act as resistance if the rebound extends.
Momentum signals are also split. MACD points to stronger buying pressure, while RSI near 55 shows Ethereum has not yet entered a clear bullish zone. CCI and Bull/Bear Power still lean bearish, suggesting sellers have not fully stepped aside.
That is why $1,779 matters. A breakout could invite fresh bids and short covering. Failure near that level may keep ETH trapped between $1,633 and $1,814.
Ethereum Price Prediction Weighed by Whales and ETF Flows
Ethereum price prediction is not only about chart levels. On-chain and institutional signals are also shaping the current setup. Large Ethereum holders added exposure near late June lows. That buying has supported cautious optimism among traders.

At the same time, Binance withdrawals reportedly reached a three-year high. Exchange outflows can reduce available supply, especially when paired with whale accumulation. This often supports bullish narratives when price starts recovering.
However, Ethereum still faces pressure from weak network activity. Active addresses have fallen sharply from early-year highs, raising questions about user demand. Since ETH powers activity across the network, lower usage can weaken the fundamental case.
ETF flows also remain mixed but the renewed spot ETF interest and June outflows showed institutional demand was not yet stable. That divergence keeps the market from forming a clean bullish view.
For now, ETH appears likely to trade inside a consolidation band between $1,633 and $1,814. A breakout above $1,779 would strengthen the case for a move toward $1,850 and $1,900. A loss of $1,633 would shift attention back to $1,500 and deeper support near $1,200.
Institutional sentiment has improved through whale activity, exchange withdrawals, and Ethereum adoption efforts. Yet buyers still need confirmation through price action. The next decisive signal sits near $1,779, where Ethereum must prove the rebound has enough strength to extend.

HOW DOES DMO AFFORD ALL THOSE SUPERCARS? #automobile #motivation #cars #lifestyle #money #fyp

The Millionaire Boom Is Real – But So Is The Market Trap

Binance outflows triple as ETH withdrawals hit 3-year high

No Jackpot Winner as $257 Million Prize Rolls Over to $269 Million Monday Draw

Renter of Home in Anne Heche Crash Denies Settlement With Son

Weekend Open Thread: Staud – Corporette.com
HOW DOES DMO AFFORD ALL THOSE SUPERCARS? #automobile #motivation #cars #lifestyle #money #fyp

Trump’s cryptocurrency gains#shorts #shortvideo #trending #actress #celebrity

Trump Responds To Questions On $1.4 Billion Financial Disclosure | APT
-

 Fashion2 days ago
Weekend Open Thread: High Hopes
-

 Politics2 days ago
The House | “Reframing the debate from a binary discussion of winners and losers”: Yuan Yang reviews ‘We Are Not Machines’
-

 Crypto World5 days ago
Strategy authorizes up to $1.25B in Bitcoin sales under new capital plan
-

 News Videos7 days ago
MAJOR BITCOIN & MARKET UPDATE!!!! (MUST WATCH ASAP!!!)
-

 Tech5 days ago
Anonymous researcher drops 0-day ‘exploitarium’ repo
-

 Business5 days ago
Australia treasurer says alleged access of prime minister’s bank data ’incredibly concerning’
-

 News Videos5 days ago
How to Build INSANE Live Financial Dashboards With Claude
-
 NewsBeat8 hours ago
Taylor Swift and Travis Kelce wedding staffer hilariously struggles to keep her cool while checking in megastars
-
 Business6 days ago
The AI boom won’t burst all at once. It will pop in ‘rolling bubbles’: Macquarie
-

 Sports4 days ago
Broncos roster: OL Ben Powers (No. 74) entering final year of contract
-

 NewsBeat5 days ago
Presenter Caroline Flack’s brother Paul Flack dies aged 55
-

 Crypto World3 days ago
Binance stock trading tops $1B in first month after launch
-

 Crypto World3 days ago
Alibaba-affiliate Ant Group enters the humanoid robot market with 12 deals
-
 NewsBeat3 days ago
New exhibition reflects five decades of movement between island of Ireland and GB
-
 Crypto World4 days ago
Airdrop Registration Becomes Key Focus For Remittix As RTX Launch Updates Approach
-

 Business2 days ago
What a 10 Percent Drop Means for Buyers, Sellers and Renters
-

 Business4 days ago
Meta Platforms Stock Jumps 7% Today as Bloomberg Reports Company Plans to Enter the Cloud Business
-

 Crypto World3 days ago
Binance Re-Enters Philippines As EU MiCA Rules Restrict Access
-
 Crypto World2 days ago
Standard Chartered Secures MiCA License as ESMA Adds 37 New Crypto Firms
-

 Tech6 days ago
The attack that hijacked Claude Code came through Sentry. Datadog, PagerDuty, and Jira have the same exposure.
You must be logged in to post a comment Login