

Crypto World
Bitcoin’s ‘Strong Hands’ Return as 15 Million BTC Lockup Meets Critical Fed Week
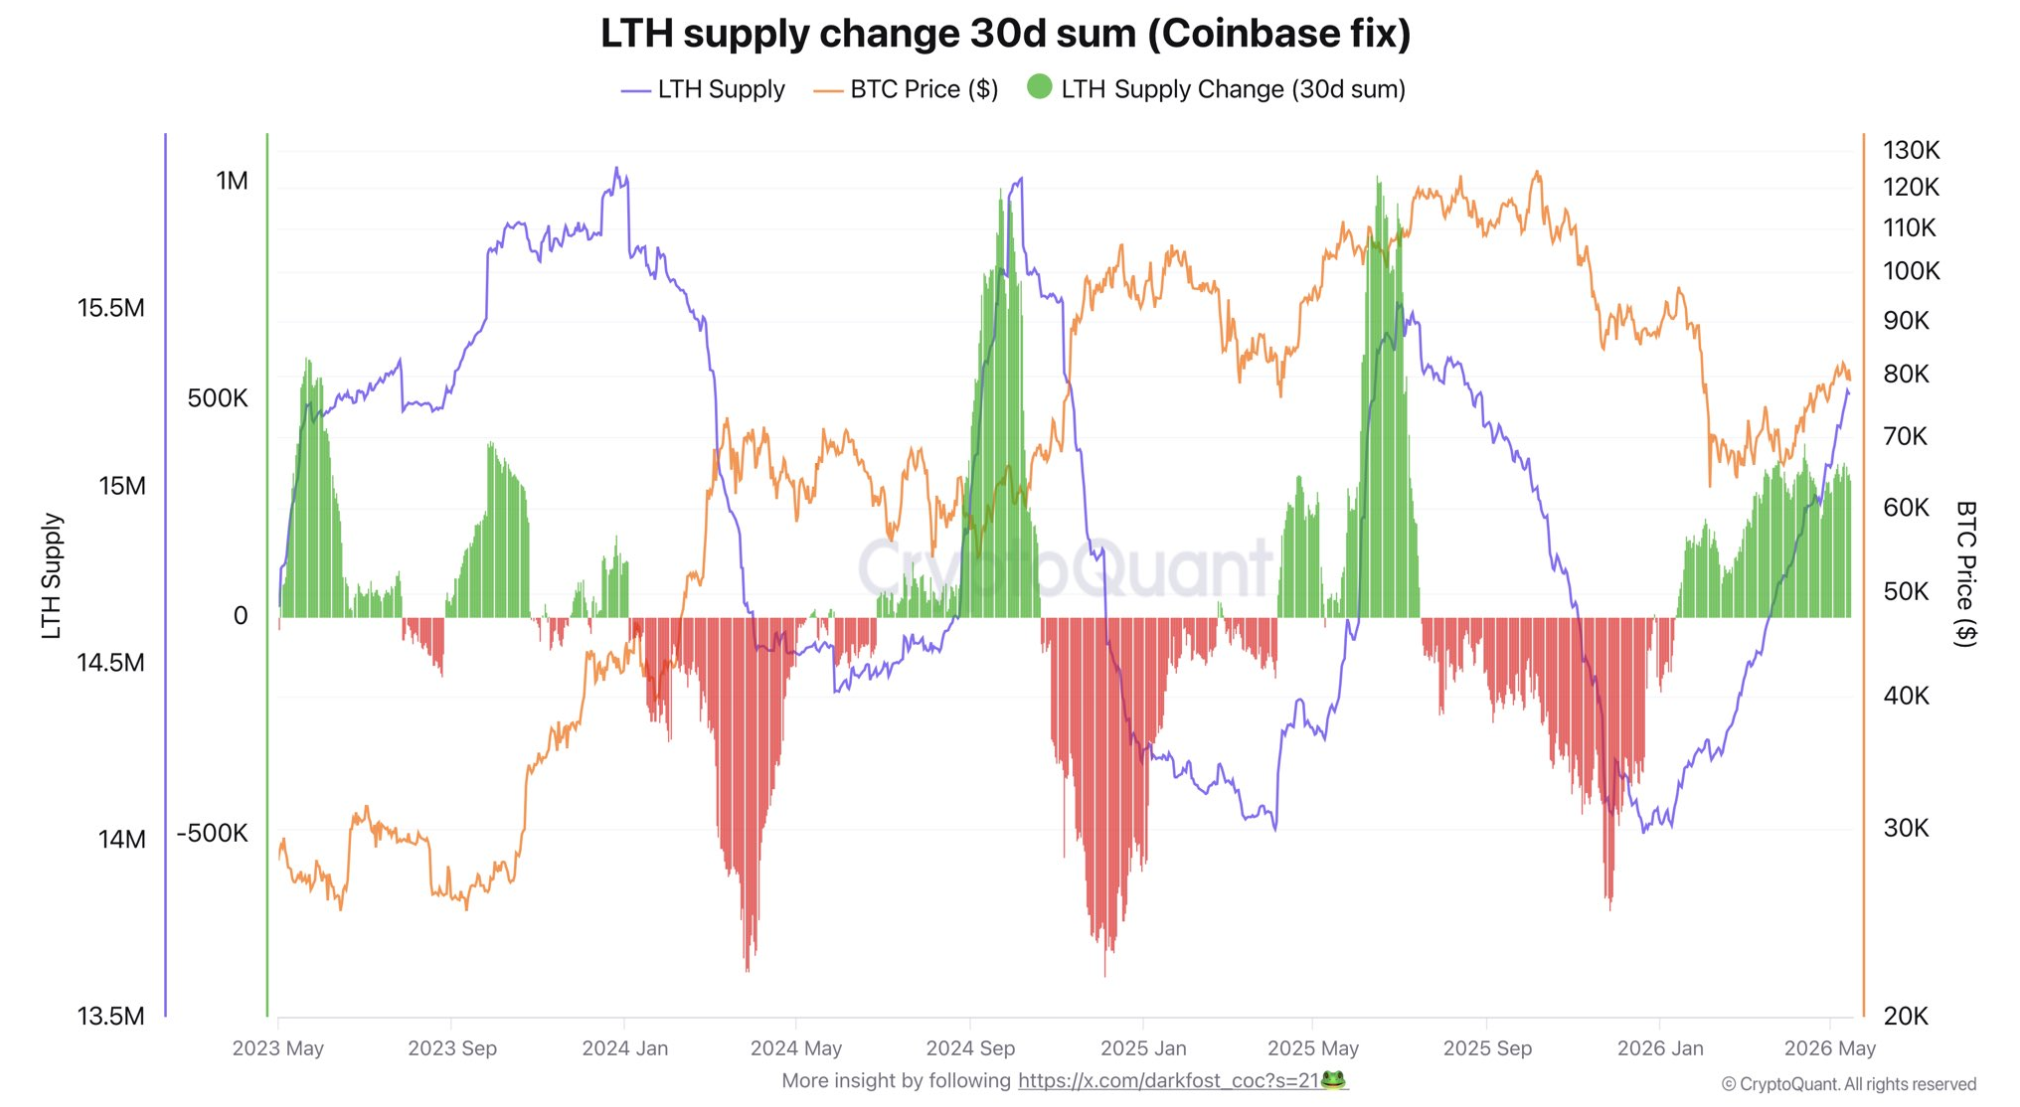
Bitcoin (BTC) long-term holder supply has climbed to roughly 15.26 million BTC, the highest level since August 2025. CryptoQuant analyst Darkfost says these wallets absorbed 316,000 BTC over the past 30 days.
Markets now turn to FOMC minutes due May 20 from Jerome Powell’s final Federal Reserve meeting as Chair. The release will likely shape risk appetite through summer.
Long-Term Holders Reverse November’s Selling
CryptoQuant analyst Darkfost reported that long-term holder supply has rebounded to about 15.26 million BTC. Over the past 30 days, these wallets added roughly 316,000 BTC.
That contrasts sharply with late November, when long-term holder wallets shed roughly 650,000 BTC over 30 days. The reversal points to renewed accumulation among investors who first bought near the cycle peak six months ago.
“The supply held by Long Term Holders (LTHs) continues to increase as investors keep holding their BTC. We are now back to 15.26 million BTC held by these investors, who are generally considered much more stable than STHs,” wrote Darkfost.
The analyst also flagged a separate dynamic for late May. The 800,000 BTC transferred from Coinbase last year will cross the six-month threshold on May 23.
Those coins will formally enter the long-term holder bucket, an aging effect that could amplify on-chain supply readings later this month.

Exchange Flows Stabilize as Bottom Signals Surface
Bitcoin trades near $78,047 as of this writing, down by 0.17% in the last 24 hours. Coin Bureau highlighted that the gap between exchange inflows and outflows has narrowed for six straight sessions.
The research firm argues stable flows, falling reserves, and whale scarcity often cluster around major Bitcoin bottoms since 2019.
“Stable flows, falling exchange reserves, and whale accumulation are classic ‘dry powder’ signals seen around every major Bitcoin bottom since 2019,” wrote analysts at the Coin Bureau.

FOMC Minutes Arrive During a Leadership Handover
These technical formations come as markets awaut the The Federal Reserve to publish minutes from the April 28 to 29 meeting on Wednesday at 2 p.m. ET.
“…we expect the FOMC to signal a tightening bias at the June meeting of the monetary policy-setting committee, followed by a 25bps FFR hike at the July meeting. We can’t rule out more rate hikes over the rest of this year,” analysts at Yardeni Research noted.
The committee held its target range at 3.50% to 3.75%, marking the third straight pause. Four officials dissented, the largest split since 1992. Governor Stephen Miran pushed for a quarter-point cut. Presidents Lorie Logan, Neel Kashkari, and Beth Hammack opposed the statement’s easing bias.
Powell’s term as Chair ended May 15, and Kevin Warsh was confirmed as his successor in a 54-45 Senate vote. Powell will remain on the Board of Governors through January 2028.
The minutes mark the final policy record produced under Powell’s chairmanship. Traders will parse the text for shifts in inflation tolerance or forward guidance.
Those signals could shape positioning into June’s first meeting under Warsh and influence near-term Bitcoin price action.
The post Bitcoin’s ‘Strong Hands’ Return as 15 Million BTC Lockup Meets Critical Fed Week appeared first on BeInCrypto.


Bitcoin (BTC) closed June near its weakest level in almost two years after falling to around $58,000 on June 30, while spot Bitcoin ETFs extended a weeks-long run of heavy outflows.
The month, according to a Santiment market report, was less about one single crash and more about capital quietly leaving crypto for AI stocks while whales sat on their hands.
Bitcoin Struggles as ETF Outflows and Institutional Caution Weigh on Sentiment
Per Santiment’s July 2 report, June saw a growing divide between retail traders and large investors, with wallets holding less than 0.01 BTC increasing their holdings in the final two weeks of the month, while those with between 10 and 10,000 BTC reduced their exposure. This, in the firm’s opinion, suggested that large investors remain unconvinced that the market has found a bottom.
Another source of pressure came from ETFs. Since May 6, the last time there were consecutive days of inflows, spot Bitcoin ETFs have recorded about $8.9 billion in net outflows.
In June alone $4.51 billion went out of the funds, marking their worst month since launch, and Santiment argued that such heavy selling, pushing cumulative withdrawals ever closer to the psychologically significant $10 billion mark, can also reflect capitulation, with weaker hands leaving the market after a long decline.
The analytics platform also pointed to Strategy and its preferred stock as adding another layer of uncertainty after they fell well below par in June, hitting the $70s at one point and raising concerns about the company’s financial model, especially given the weakening state of BTC at the same time.
However, executive chairman Michael Saylor responded by introducing a Digital Credit Capital Framework designed to improve liquidity and support the company’s preferred stock obligations. He also defended Strategy’s recent sale of 32 BTC, saying that the world’s biggest corporate holder of Bitcoin had bought about 175,000 BTC this year and that he had not sold any of his personal stash.
The Santiment report had one theme recurring throughout: that money that might previously have flowed into crypto has instead moved into AI and semiconductor stocks. The firm’s analysts described AI equities as one of the biggest competitors for investor attention during June, leaving BTC without the institutional demand it had enjoyed earlier in the cycle.
That same point was made by HashKey researcher Tim Sun, who told CryptoPotato that capital was reallocating across risk assets rather than that investors were losing their appetite for risk altogether. According to him, there’s a chance that Bitcoin can pull that capital back if the AI trade gets overcrowded and corrects.
Market Still Found Bright Spots Despite a Difficult Month
The weakness described above was not universal, as Santiment highlighted that Hyperliquid was one of the strongest performers last month after its HYPE token climbed to new highs, supported by growing derivatives activity and new product launches.
Another that attracted attention was Lighter’s LIT, which announced tokenomics changes including buybacks, token burns, and staking incentives.
Elsewhere, Pump.fun generated substantial revenues even as it was reportedly in the market for a chief legal officer with a salary of up to $5 million, leading to speculation that it is getting ready for increased regulatory scrutiny.
Solana’s meme coin ecosystem also came back into the spotlight, with a number of influencer-backed launches, including The Black Bull (ANSEM), fronted by popular crypto figure Ansem, whose value at the time of writing had skyrocketed by nearly 88,000% in seven days per CoinGecko data.
Bitcoin itself has also shown some sign of stabilization, trading back above $61,000, but according to Santiment, June may be remembered less for the sell-off than for exposing which narratives are still attracting capital.
The post June 2026 Market Recap: Bitcoin Hits 2-Year Low as ETFs Bleed $8.9B appeared first on CryptoPotato.
Moonbeam, an interoperability network originally built for Polkadot, says it is shifting its development focus to Ethereum’s Layer 2 Base. The company’s new plan centers on launching the “Moonbeam Protocol” as an AI agent communication and settlement network—an architecture it believes can benefit from growing interest in agent-driven, on-chain payments.
In a strategic update released Friday, Moonbeam framed the move as a pivot toward what it calls “autonomous AI agents” that can coordinate with one another, negotiate for work, and settle payments directly on-chain “without a middleman.” Moonbeam did not disclose a launch date for the Moonbeam Protocol.
Key takeaways
- Moonbeam says it is pivoting from its current Polkadot-centered roadmap to building an AI agent communication and settlement layer on Base.
- The company provided no timeline for the Moonbeam Protocol launch.
- Moonbeam tokenholders will need to bridge GLMR from Moonbeam’s Polkadot parachain to Base before July 31, 2026.
- Moonbeam says it will keep supporting its existing cross-chain interoperability services on the Polkadot parachain during the transition.
- The announcement lands as the broader “agentic” trend gathers institutional attention, but adoption in on-chain agent payment infrastructure remains limited.
Why Moonbeam is moving to Base for agent settlement
Moonbeam’s stated objective is to build an on-chain network designed for agent-to-agent coordination and settlement. The company argues that autonomous agents—programs that can locate each other, bargain over tasks, and execute payments—represent a “long-term opportunity” for blockchain infrastructure.
By relocating development resources to Base, Moonbeam is effectively betting that the practical bottleneck for agent-based ecosystems is moving from pure experimentation toward execution: enabling systems to transact reliably and automatically on-chain. The company didn’t specify the technical design of the Moonbeam Protocol, but its positioning suggests it intends to become a coordination layer for agent activity rather than just another cross-chain bridge.
Institutional and industry leaders have echoed similar expectations for agent-driven payments. Cointelegraph previously highlighted predictions from executives such as Coinbase CEO Brian Armstrong and Circle CEO Jeremy Allaire that AI agents could become major users of blockchain-based payments in the coming years.
At the same time, real-world adoption has not yet matched the narrative. Cointelegraph cited Artemis data indicating that only $2 million in trading volume had been facilitated through Coinbase’s x402 protocol over the prior 30 days, underscoring how early the space still is despite high-profile backing.
Polkadot concerns after Moonbeam’s pivot
The shift is also reverberating within the Polkadot community. Multiple voices on social media characterized Moonbeam’s pivot as a setback for Polkadot’s ecosystem, with at least one user calling it the network’s “flagship project.”
Moonbeam originally launched as a Polkadot parachain in January 2022, providing developers with the ability to build Ethereum Virtual Machine (EVM)-compatible applications inside the Polkadot environment. That origin is central to why the move is being seen as more than a simple product upgrade: it signals a reorientation of Moonbeam’s flagship direction away from its parachain-centric identity.
That said, Moonbeam’s statement also implies continuity during the transition period. The company says it will continue operating cross-chain interoperability services on the Polkadot parachain rather than immediately ceasing Polkadot-linked support.
How the GLMR migration works—and who must act
For existing users and decentralized finance participants, the most immediate question raised by the announcement is operational: what happens to GLMR tokens tied to Polkadot-based deployment.
Moonbeam said that GLMR holders will need to bridge their tokens from Moonbeam’s Polkadot parachain to Base before July 31, 2026. The update includes GLMR held in or connected to lending markets, staking contracts, and other DeFi protocols. That means many token balances that are not held in a simple wallet could require additional migration steps to preserve positions across chains.
Moonbeam also clarified that users who hold GLMR on a centralized exchange will not need to take action, suggesting exchanges will handle the process on behalf of customers.
Importantly, Moonbeam stated that it is not abandoning its existing builders or infrastructure providers. It intends to keep cross-chain interoperability running on the Polkadot parachain during the transition period, which may reduce the operational risk for teams and services that rely on ongoing interoperability rather than a clean cutover.
Still, for participants in lending, staking, and protocol integrations, the July 31, 2026 deadline effectively becomes the point by which on-chain and integration plans should be re-validated for Base. Investors and developers will likely want to track whether Moonbeam’s migration tools, cross-chain routing, and any protocol-level configuration changes are sufficient for complex DeFi positions—not just spot token transfers.
Agent hype meets slow infrastructure adoption
Moonbeam’s move reflects a broader push across crypto infrastructure to support agentic applications, but it also highlights the gap between expectations and current usage.
Coinbase’s x402 protocol has been one of the prominent catalysts in the “agentic payments” narrative, yet Cointelegraph’s cited Artemis figures indicate that activity remains comparatively small in dollar terms over a 30-day window. This suggests that even with major industry support, agent-driven on-chain payment flows are still early—and may depend on better consumer-facing products, clearer developer tooling, or stronger demand from actual agent deployments.
Outside crypto, progress is also uneven. Cointelegraph noted that Meta CEO Mark Zuckerberg said agent technology hadn’t accelerated the company’s workflows as quickly as expected, signaling that adoption cycles in the broader tech industry may be more gradual than early forecasts.
Within that context, Moonbeam’s strategy can be read as an attempt to move from agent experimentation toward an infrastructure layer that could standardize communication and settlement. Whether that standardization can translate into meaningful on-chain usage will be clearer only after the Moonbeam Protocol is deployed and used by developers and real agent systems.
For now, the key watchpoints are Moonbeam’s unspecified launch timeline, the execution details of the GLMR bridging process ahead of July 31, 2026, and whether early agent settlement activity grows enough to justify a full pivot to Base.
Moonbeam Network says it is shifting its focus from Polkadot to Ethereum layer 2 Base in order to build what it calls an “AI agent communication and settlement network.” The interoperability project framed the move as a strategic bet on autonomous, on-chain coordination between AI agents that can negotiate work and transact directly—without relying on a middleman.
In a Friday announcement, Moonbeam said the initiative is part of the “Moonbeam Protocol” and described the pivot as a reallocation of resources toward what it sees as the next major crypto frontier: agent-to-agent discovery, negotiation, and fully on-chain payments. The company did not provide a launch timeline for the Moonbeam Protocol.
Key takeaways
- Moonbeam is pivoting from Polkadot to Base to support an AI agent communication and settlement network.
- Moonbeam did not specify a launch date for the Moonbeam Protocol.
- GLMR token holders are instructed to bridge from Moonbeam’s Polkadot parachain to Base before July 31, 2026.
- Moonbeam says it will continue interoperability support on Polkadot during the transition and will not abandon existing builders or infrastructure providers.
Why Moonbeam is betting on Base for “agent settlement”
Moonbeam’s statement positions the Base pivot as more than a chain migration. The company argues that the most compelling long-term use case for blockchain is the emergence of autonomous AI agents that coordinate with each other on-chain and settle payments end-to-end.
That framing aligns with broader industry momentum around “agentic” workflows—an area where executives have repeatedly suggested that AI agents will become major users of blockchain-based payments. Cointelegraph previously reported on expectations from leaders including Coinbase CEO Brian Armstrong and Circle CEO Jeremy Allaire that AI agents could drive demand for on-chain payments in the coming years.
Still, adoption has been uneven. Cointelegraph noted earlier that while Coinbase’s x402 payments protocol has been a high-profile catalyst for the agent-payments narrative, Artemis data indicated only about $2 million in trading volume facilitated through x402 over the past 30 days. In parallel, Big Tech experimentation has not always translated into faster production deployment; Meta CEO Mark Zuckerberg said on Thursday that agent tools had not accelerated the company’s workflows as quickly as expected, according to Cointelegraph coverage.
Against that backdrop, Moonbeam’s move to Base suggests a strategic attempt to connect agent functionality with a more established Ethereum scaling ecosystem—while positioning its interoperability expertise as the connective tissue for cross-chain agent activity.
Community backlash and Polkadot ecosystem concerns
Not everyone welcomed the shift. Several community members characterized Moonbeam’s pivot as a setback for Polkadot, with some referring to Moonbeam as a flagship project for the ecosystem.
Moonbeam originally launched in January 2022 as a Polkadot parachain. At the time, it offered developers the ability to build Ethereum Virtual Machine-compatible applications within the Polkadot environment—an approach designed to lower the friction for Ethereum-native tooling and developer workflows while still benefiting from Polkadot’s broader interoperability vision.
Moonbeam’s new direction therefore changes the practical center of gravity for its future roadmap. Even if existing functionality remains supported for a transition period, the messaging implicitly signals that Moonbeam intends to prioritize agent-native settlement and coordination on Base going forward.
Bridging instructions for GLMR before mid-2026
The most immediate operational change concerns token movement. Moonbeam said holders of its token, GLMR, will need to bridge assets from Moonbeam’s Polkadot parachain to Base before July 31, 2026. This includes GLMR exposure in lending markets, staking contracts, and other DeFi protocols connected to the parachain.
Moonbeam also clarified that users who hold GLMR through a centralized exchange will not need to take action, implying that the exchange layer will handle the migration on their behalf.
Importantly, Moonbeam said it will keep providing cross-chain interoperability services on Polkadot through the transition period. The company added that it is not abandoning existing builders or infrastructure providers—an assurance intended to reduce the risk that the shift could leave teams stranded on Polkadot immediately.
For participants, the decision raises a practical set of questions that will matter as the deadline approaches: how bridge support will be maintained across different contract types, how long existing integrations will remain fully functional on the parachain, and what future liquidity and settlement patterns will look like once the activity concentrates on Base.
What investors and builders should watch next
Moonbeam did not provide a Moonbeam Protocol launch schedule, which leaves timelines and implementation details open. The next key items for market participants are likely to be: updates on the bridging process and user-facing tooling ahead of the July 31, 2026 deadline; clarification on how DeFi and staking setups will evolve during the transition; and—critically—whether Moonbeam’s agent-focused settlement network attracts real on-chain usage, particularly in light of past reports suggesting that agent payment adoption has been slow even where the concept has momentum.

Polkadot-based interoperability protocol Moonbeam said it is pivoting to Ethereum layer 2 Base to launch an AI agent communication and settlement network, aimed at capturing a share of the emerging market.
“This is a pivot to the most exciting frontier in crypto: autonomous AI agents that find each other, negotiate work, and pay each other entirely on-chain, without a middleman,” Moonbeam said in a statement announcing the Moonbeam Protocol on Friday.
“We believe AI-native on-chain coordination represents a significant long-term opportunity. This transition allows us to focus resources around that direction,” Moonbeam added.
Moonbeam didn’t provide a launch timeline for the Moonbeam Protocol.
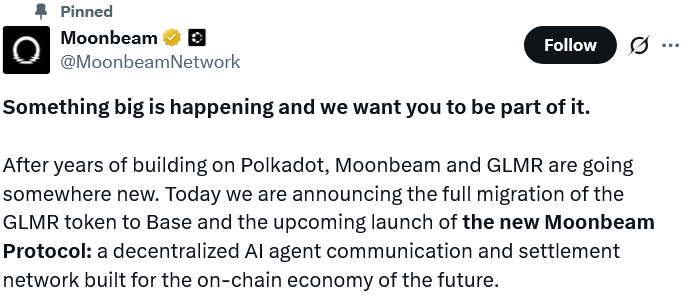
Source: Moonbeam
Agentic development has seen considerable adoption in the crypto industry, with Coinbase CEO Brian Armstrong and Circle CEO Jeremy Allaire among the executives predicting that AI agents will become the dominant users of blockchain-based payments in the coming years.
Coinbase’s x402 payments protocol has been one of the biggest drivers behind that push, while layer 1 blockchains Aptos and Near have also rolled out infrastructure to support agent-driven onchain activity.
Adoption in blockchain-based payments space has struggled to take off, however, with data from Artemis showing that only $2 million in trading volume has been facilitated through the x402 protocol over the past 30 days.
AI agent development is progressing slowly in Big Tech too, with Meta CEO Mark Zuckerberg stating on Thursday that the technology hasn’t accelerated the firm’s workflows as quickly as expected.
Moonbeam pivot a blow to Polkadot
Several members of the crypto community said Moonbeam’s pivot marked a major setback for the Polkadot ecosystem, with one X user calling Moonbeam Polkadot’s “flagship project.”
“That’s a real pain in the ass for Polkadot,” another X user said.
Moonbeam launched as a Polkadot parachain in January 2022, providing developers the ability to build Ethereum Virtual Machine-compatible applications directly in the Polkadot ecosystem.
Moonbeam users instructed to migrate tokens
Moonbeam (GLMR) holders will need to bridge their tokens from Moonbeam’s Polkadot parachain to Base before July 31, 2026, including GLMR tied in lending markets, staking contracts and other decentralized finance protocols, Moonbeam said.
Related: Why a ‘safe’ AI can turn dangerous in the wrong company
Those holding the token on a centralized exchange won’t need to take any action, Moonbeam said.
Moonbeam said it will continue providing its cross-chain interoperability services on the Polkadot parachain through the transition period and is not abandoning its existing builders or infrastructure providers.
Magazine: Bitcoin decouples from tech stocks, Ether eyes ‘selling wave’: Market Moves

As confidence gradually returns to the cryptocurrency market, one question continues to dominate investor conversations: what is the best crypto to buy now? For some, the answer lies in established blockchain giants like Ethereum or XRP, two projects that have spent years building their ecosystems and communities. For others, the biggest opportunities are often found much earlier, before a project reaches exchanges and the wider market begins paying attention.
That shift in mindset has placed crypto presales back in the spotlight.
While blue-chip cryptocurrencies continue to attract long-term investors, many market participants are once again researching emerging projects that offer something established assets simply can’t: the opportunity to invest at the earliest possible stage. Among the projects attracting increasing attention is IceBull, an Ethereum-based meme coin that has officially launched Stage 1 of its crypto presale.
Rather than competing directly with Ethereum or XRP, IceBull offers investors a different opportunity altogether, participating while the project is still in its earliest growth phase.
 Ethereum Continues to Set the Standard for Blockchain Innovation
Few cryptocurrencies have influenced the industry as much as Ethereum. Since introducing smart contracts, Ethereum has become the foundation for decentralised finance, NFTs, blockchain gaming and thousands of Web3 applications. Millions of users interact with Ethereum every day, making it one of the most widely adopted blockchain ecosystems in the world.
Its transition to Proof-of-Stake also transformed the network, allowing holders to stake ETH while significantly reducing energy consumption. For investors seeking long-term exposure to blockchain technology, Ethereum remains one of the strongest and most established assets available.
However, its maturity also means many investors now complement their portfolios with smaller projects that may offer greater upside if they successfully execute their roadmaps.
XRP Remains One of Crypto’s Most Recognisable Payment Networks
XRP has built its reputation around one core objective: making international payments faster and more efficient.
Over the years, it has remained among the cryptocurrency market’s largest digital assets despite periods of regulatory uncertainty. Its transaction speed, relatively low fees and established global community continue attracting investors looking for exposure to payment-focused blockchain technology.
As institutional interest in digital assets continues evolving, XRP remains firmly on many investors’ watchlists.
Like Ethereum, however, XRP is already a mature project. While it continues developing, much of today’s attention is centred around adoption, regulation and ecosystem growth rather than early-stage discovery.
IceBull Offers Something Different
Unlike Ethereum and XRP, IceBull isn’t trying to replace existing blockchain infrastructure. Instead, it’s building an Ethereum-based community token centred around transparency, participation and long-term growth.
With IceBull Crypto Presale now officially live, investors can participate in Stage 1, where the lowest presale pricing is currently available before prices increase throughout the remaining stages.
The project features a structured 16-stage presale, allowing token pricing to gradually increase as demand grows while giving participants complete visibility throughout the fundraising campaign.
Alongside its Ethereum foundation, IceBull also offers:
- Audited smart contracts
- Team allocation vesting
- Up to 80% APY staking
- Community-driven development
- 10% referral rewards for both referrer and buyer on qualifying purchases
- Transparent tokenomics
For investors looking beyond established cryptocurrencies, Stage 1 provides the earliest opportunity to join the project before future presale price increases and exchange listings.
Why Crypto Presales Continue Attracting Attention
Presales have always occupied a unique position within the cryptocurrency market. Rather than buying after public trading begins, participants can evaluate a project while it’s still in its earliest phase. That doesn’t eliminate risk, but it does create opportunities that no longer exist once a token reaches exchanges.
Experienced crypto investors typically focus on several key areas before considering any presale:
- Transparent token supply
- Clearly explained tokenomics
- Realistic roadmap
- Community engagement
- Smart contract security
- Long-term development plans
Projects that communicate these fundamentals clearly often inspire greater confidence than those relying purely on marketing.
With IceBull Crypto Presale now live, investors can purchase tokens directly through the official website during Stage 1. As the presale progresses through each stage, token prices increase according to the published pricing schedule, rewarding those who participate early.
IceBull, Ethereum and XRP Compared
| Feature | IceBull | Ethereum | XRP |
| Current Status | Stage 1 Presale Live | Live | Live |
| Blockchain | Ethereum | Ethereum | XRP Ledger |
| Exchange Listed | No | Yes | Yes |
| Entry Stage | Stage 1 Presale | Established | Established |
| Smart Contract Platform | ERC-20 | Native | Native |
| Community Focus | High | High | High |
| Staking | Up to 80% APY | Available | Limited |
Each project appeals to a different type of investor. Ethereum continues driving innovation across decentralised applications. XRP focuses on improving digital payments and financial infrastructure. IceBull, meanwhile, is aimed at investors looking to discover projects while they remain in the earliest stages of development.

Why Timing Matters
One of the biggest differences between established cryptocurrencies and crypto presales is timing. Ethereum and XRP are both available on major exchanges today. IceBull Crypto Presale, however, is currently in Stage 1, giving early participants access before future presale price increases and the project’s planned exchange listings.
For investors who enjoy identifying opportunities early, Stage 1 represents the earliest public entry point currently available. As with any cryptocurrency investment, carrying out independent research and understanding a project’s roadmap and tokenomics remains essential.
Final Thoughts
There is no single answer to the question of the best crypto to buy now because every investor has different goals and risk tolerance. Ethereum continues to lead the smart contract ecosystem with one of the strongest developer communities in blockchain. XRP remains a significant player within digital payments and cross-border settlement.
Meanwhile, IceBull offers something different. With IceBull Crypto Presale now live in Stage 1, investors have the opportunity to participate while the project remains in its earliest phase. Featuring a structured 16-stage presale, audited smart contracts, staking rewards, referral incentives and an Ethereum foundation, IceBull is becoming one of the emerging crypto projects many investors are watching as the next market cycle approaches.
For More Information:
Website: https://www.icebull.com/
Telegram: https://t.me/IceBullCoin
Frequently Asked Questions
What is the best crypto to buy now?
The best crypto to buy now depends on your investment strategy. Some investors prefer established assets like Ethereum or XRP, while others are exploring early-stage opportunities such as IceBull Crypto Presale, which is currently live in Stage 1.
Is IceBull live?
Yes. IceBull is now live, and Stage 1 of the crypto presale is officially open. Investors can participate through the official website.
Why are investors watching IceBull?
IceBull combines a structured 16-stage presale, audited smart contracts, up to 80% APY staking, referral rewards, Ethereum-based infrastructure and a community-first approach, making it one of the emerging crypto projects attracting early attention.
How can I join the IceBull Crypto Presale?
You can participate by visiting the official IceBull Crypto Presale, connecting a supported wallet and purchasing during Stage 1 before future presale price increases.
Disclaimer
This article is for informational purposes only and should not be considered financial advice. Cryptocurrency investments involve risk, and readers should always conduct their own research before making any investment decisions.
Disclaimer: This is a Press Release provided by a third party who is responsible for the content. Please conduct your own research before taking any action based on the content.


The FIFA World Cup’s round of 16 matches are set to kick off on July 4, and football, or soccer as it’s known in the United States, has become the biggest driver of activity on prediction platforms, diverting attention from the political and macroeconomic markets they were originally built around.
This is according to data from research firm CryptoRank, which shows that the tournament has pushed prediction market volumes from just $65 million on June 1 to a monthly peak of $5.6 billion on June 22.
World Cup Drives Record Activity Across Prediction Platforms
Per CryptoRank’s data, throughout June, total trading volume across major prediction venues rose rapidly, from the aforementioned $65 million on June 1 to $340 million on June 8, just days before the World Cup started. A week later, on June 15, the volume had jumped to $2.2 billion, with 15 matches played, including the USA’s memorable 4-1 win over Paraguay in Los Angeles.
By the time 42 games had been played on June 22, trading on the platforms had gone up even higher, with CryptoRank reporting that volume had hit a high of $5.6 billion before showing a slight reduction seven days later, when about $5.4 billion in trades was recorded on June 29.
In a post on X on July 2, the firm said that Kalshi had accounted for much of that June activity, with its dashboard at the time of writing showing open interest, or the total value of active positions that have yet to be settled, standing at $1.84 billion. Of that amount, roughly $1.45 billion was on Kalshi while Polymarket held about $390 million.
During the previous week, open interest remained relatively stable on Kalshi at around $1 billion, while on Polymarket, it peaked at $475 million on June 30, the day Norway, Sweden, and the Netherlands were knocked out of the competition in dramatic style.
BitMart pointed to similar trends on its own platform. With multiple research institutions projecting that the total global trading volume on prediction markets could reach $10 billion, the crypto exchange said that most of that traffic has so far been directed to centralized platforms like it, given their lower barriers to entry compared to on-chain prediction products that require private keys and gas fees as well as contract approvals that need several steps to complete.
As such, the CEX reported that its monthly prediction market volumes skyrocketed 1,500% from May after the World Cup started. It also said active users increased 4.6 times, while completed orders went up nearly 9 times.
Furthermore, according to the exchange, nearly 44% of newly registered users placed their first trade through its prediction markets, with football markets being the main attraction for the newcomers before some of them expanded into crypto price predictions.
An Industry With Some Baggage
Polymarket’s more subdued performance in the World Cup month compared to Kalshi has come against a backdrop of criticism on several fronts. For instance, a Wall Street Journal (WSJ) investigation published in June alleged that the platform has been using staged winning bets in promotional videos.
There was also a recent dispute that made headlines, in which a user accused Polymarket of changing the rules of a market tied to Strategy’s Bitcoin sale, raising questions about how such firms resolve contested outcomes.
The post World Cup Fever Fuels $5.6B Explosion in Prediction Markets appeared first on CryptoPotato.
MicroStrategy chief executive Phong Le has called Bitcoin (BTC) the “United States of money.” On-chain tracker Arkham says the $1 million bet he made on the firm’s preferred stock is back to break-even.
The purchase, in a securities filing, doubles as a personal wager on the company Le runs. Strategy, formerly MicroStrategy, is fighting to hold its Stretch preferred stock (STRC) near par after a Bitcoin slump.
$1 Million Bet Back at Break-Even
A June 22 filing shows Le bought 11,000 STRC shares through his family trust. He paid a weighted-average $90.80 apiece, or about $998,756. He framed it as a long-term hold, not a trade.
That price was below STRC’s stated $100 value. Strategy designed the stock to trade near that $100 par value, adjusting its dividend monthly to defend the peg.
The company has since lifted STRC’s annual dividend to 12%, up from 9% at its July 2025 debut. That has pulled the shares back toward par. Arkham now pegs Le’s position at break-even.
The recovery matters because STRC anchors a preferred-stock stack now worth more than $13 billion. MicroStrategy recently outlined a new Bitcoin sales policy that could fund those dividends by selling some of its holdings.
“I bought $1 million of $STRC today. Will hold it until it reaches par, likely longer,” Le described the buy in a June post.
Follow us on X to get the latest news as it happens
Why Le Calls Bitcoin the United States of Money
Le laid out his case for Bitcoin, describing it as money set by transparent rules and a fixed supply that no government can inflate away. The asset, he argued, shields wealth from inflation, censorship, and political pressure.
“Bitcoin is the United States of money. It aspires to do for money what the American Constitution aspired to do for government: create a system governed by transparent rules rather than the discretion of individuals…But beyond that, Bitcoin is hope,” he stated.
He tied the view to his own past. He linked his family’s refugee journey from Vietnam to the belief that people should control their own money. Le has predicted Bitcoin could become a global reserve asset within a decade.
The conviction carries weight because Le runs Strategy, the largest corporate Bitcoin holder at 818,334 BTC.

Founder Michael Saylor pioneered that treasury model in 2020. Le points to banks like Goldman Sachs and Citi adding Bitcoin services as proof that the shift is real.
Not everyone shares the optimism. Bitwise has said Strategy is no longer Bitcoin’s dominant buyer. The firm also booked a $12.5 billion quarterly loss as bitcoin fell. Rival corporate Bitcoin treasuries have kept accumulating through the slump.
Whether the break-even holds depends on how STRC and Bitcoin’s bear market play out from here. For now, Le’s balance sheet and his personal account are pointing in the same direction.
The post MicroStrategy CEO Calls Bitcoin ‘United States of Money’ appeared first on BeInCrypto.
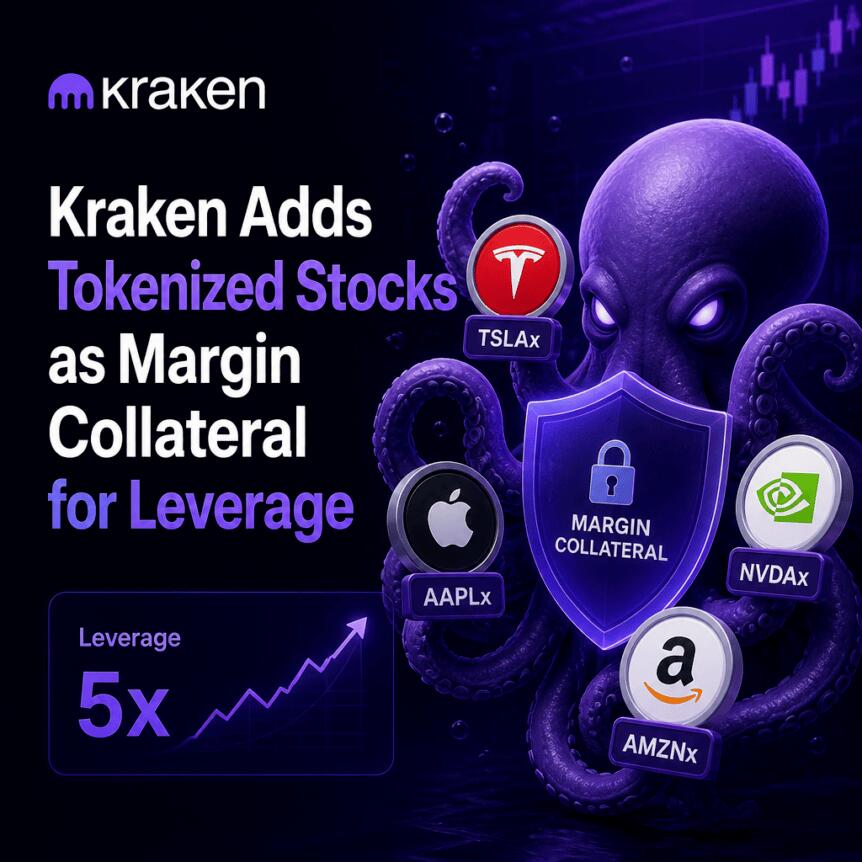
Crypto exchange Kraken has started accepting select tokenized stocks and exchange-traded funds (ETFs) as collateral for futures and margin trading. The change is designed to let eligible users open leveraged positions without first selling the tokenized assets they already hold.
Kraken’s initial rollout supports 10 tokenized instruments, including tokenized shares of major US technology companies such as Apple, Nvidia, and Tesla, alongside tokenized ETF and strategy-related products such as Strategy, the SPDR S&P 500 ETF, and Invesco QQQ Trust.
Key takeaways
- Kraken will accept tokenized stocks and ETFs as margin and futures collateral for eligible clients.
- The initial list includes Apple, Nvidia, Tesla, Strategy, the SPDR S&P 500 ETF, and Invesco QQQ Trust, among others.
- Assets receive collateral haircuts that reduce their effective lending value, with broad ETFs discounted by 10% and certain higher-volatility names discounted by 30%.
- Collateral limits vary by asset type, including up to $1 million for broad-market ETFs and up to $250,000 for most individual stocks.
- Support is limited to eligible clients outside the United States, with different collateral rules depending on the jurisdiction.
How Kraken will treat tokenized collateral
Kraken says each eligible tokenized asset is subject to a collateral “haircut,” a risk-based adjustment that lowers the amount it can contribute to a user’s borrowing power. In the exchange’s rollout, broad-market ETFs receive the lowest haircut at 10%, while more volatile stocks—including Strategy and Robinhood—are discounted by 30%.
Alongside haircuts, Kraken also sets collateral caps per asset. Broad-market ETFs are limited to up to $1 million in collateral value, while most individual stocks are capped at $250,000. Kraken also applies lower caps to tokenized gold and Circle shares, which it places at $100,000.
Importantly for active traders, Kraken notes that both collateral limits and haircuts will be reviewed periodically and remain subject to change.
Which tokenized assets are included at launch
The feature initially covers 10 tokenized stocks and ETFs. The list named by Kraken includes tokenized Apple, Nvidia, and Tesla, as well as tokenized Strategy. It also includes tokenized broad-market exposure such as the SPDR S&P 500 ETF and Invesco QQQ Trust.
Beyond these examples, Kraken’s announcement indicates that some higher-volatility holdings are assigned larger discounts. In particular, the exchange cited a 30% haircut for Strategy and Robinhood, illustrating how collateral treatment may differ materially even within single-stock collateral categories.
Regional access and venue-specific support
Kraken restricts the service to eligible clients outside the United States. The exchange further differentiates where each use case is available.
Kraken states that tokenized stocks can be used as collateral for futures trading in the European Economic Area. For margin trading, Kraken says tokenized collateral support applies in other eligible jurisdictions outside the EEA.
For users, this means they may need to check both their residency and the specific product they intend to trade—futures collateral rules may not mirror margin collateral rules across regions.
Why this fits the push for tokenized assets in mainstream finance
Kraken’s move aligns with a broader industry trend: converting traditionally held financial instruments into tokenized formats that can plug into crypto-native trading, settlement, and financing workflows. In recent months, multiple market participants have focused on expanding the utility of tokenized real-world assets (RWAs) beyond simple custody or spot trading—particularly by making them eligible collateral in regulated-style market infrastructure.
Earlier this year, Franklin Templeton and Binance launched a program that allows institutions to use tokenized money market fund shares as trading collateral while the underlying assets remain in regulated off-exchange custody. BlackRock’s tokenized US Treasury fund, BUIDL, is also described as accepted collateral on Binance, as well as on Crypto.com and Deribit.
Other examples highlight how tokenization is being tested at the level of market operations. Earlier this week, Tradeweb reportedly executed what it said was the first real-time purchase and sale of a tokenized US Treasury settled against tokenized cash on the Canton Network. Taken together, these developments point to experimentation not just with new assets, but with how those assets move through financial plumbing.
RWA.xyz estimates that tokenized real-world assets have grown to roughly $32.6 billion in distributed value, while tokenized stocks rose to about $2 billion from roughly $381 million a year earlier. While these totals don’t measure trading volume alone, they offer a sense of how much tokenized equity exposure has expanded over the past year—making exchanges’ collateral policies more consequential as tokenized products multiply.
What to watch next
With Kraken saying haircuts and collateral limits will be reviewed over time, traders using tokenized stock and ETF collateral should monitor future updates to the eligible asset list and any changes to discount rates. The next key question is whether Kraken expands eligibility beyond the initial 10 instruments and how collateral treatment evolves as tokenized stock and ETF liquidity develops.
IREN handed its two co-CEOs 18.2 million restricted stock units worth about $700 million, a grant equal to roughly 5% of the company and locked up through fiscal 2033.
The award went to Daniel and William Roberts, the former Macquarie bankers who founded IREN in 2018. Its calendar stretches to the end of the decade, ending on the year a rare piece of founder control expires.
A Grant Built to Run Until 2033
IREN sits among the Bitcoin miner stocks retooling for AI. The board approved 9,099,328 units for each brother on June 30. The units vest over four years, and each tranche is subject to a two-year sale ban.
The last shares come free only in fiscal 2033. Neither executive can collect another equity grant before fiscal 2031.
The timing is not incidental. IREN was listed on Nasdaq in 2021, and the brothers each hold one B Class share that carries 15 votes for every ordinary share they own, per the IPO prospectus.
That gap is wide. In August, each founder held 2.3% of the equity but 21.8% of the vote, IREN’s proxy shows. Together they command nearly 44%.
Those rights expire around November 2033. The Council of Institutional Investors urges dual-class sunsets of seven years or fewer.
The dilution thins their grip further. Share count rose from about 272 million last August to 341 million by March, funding its pivot toward AI compute.
Investors Sold the News
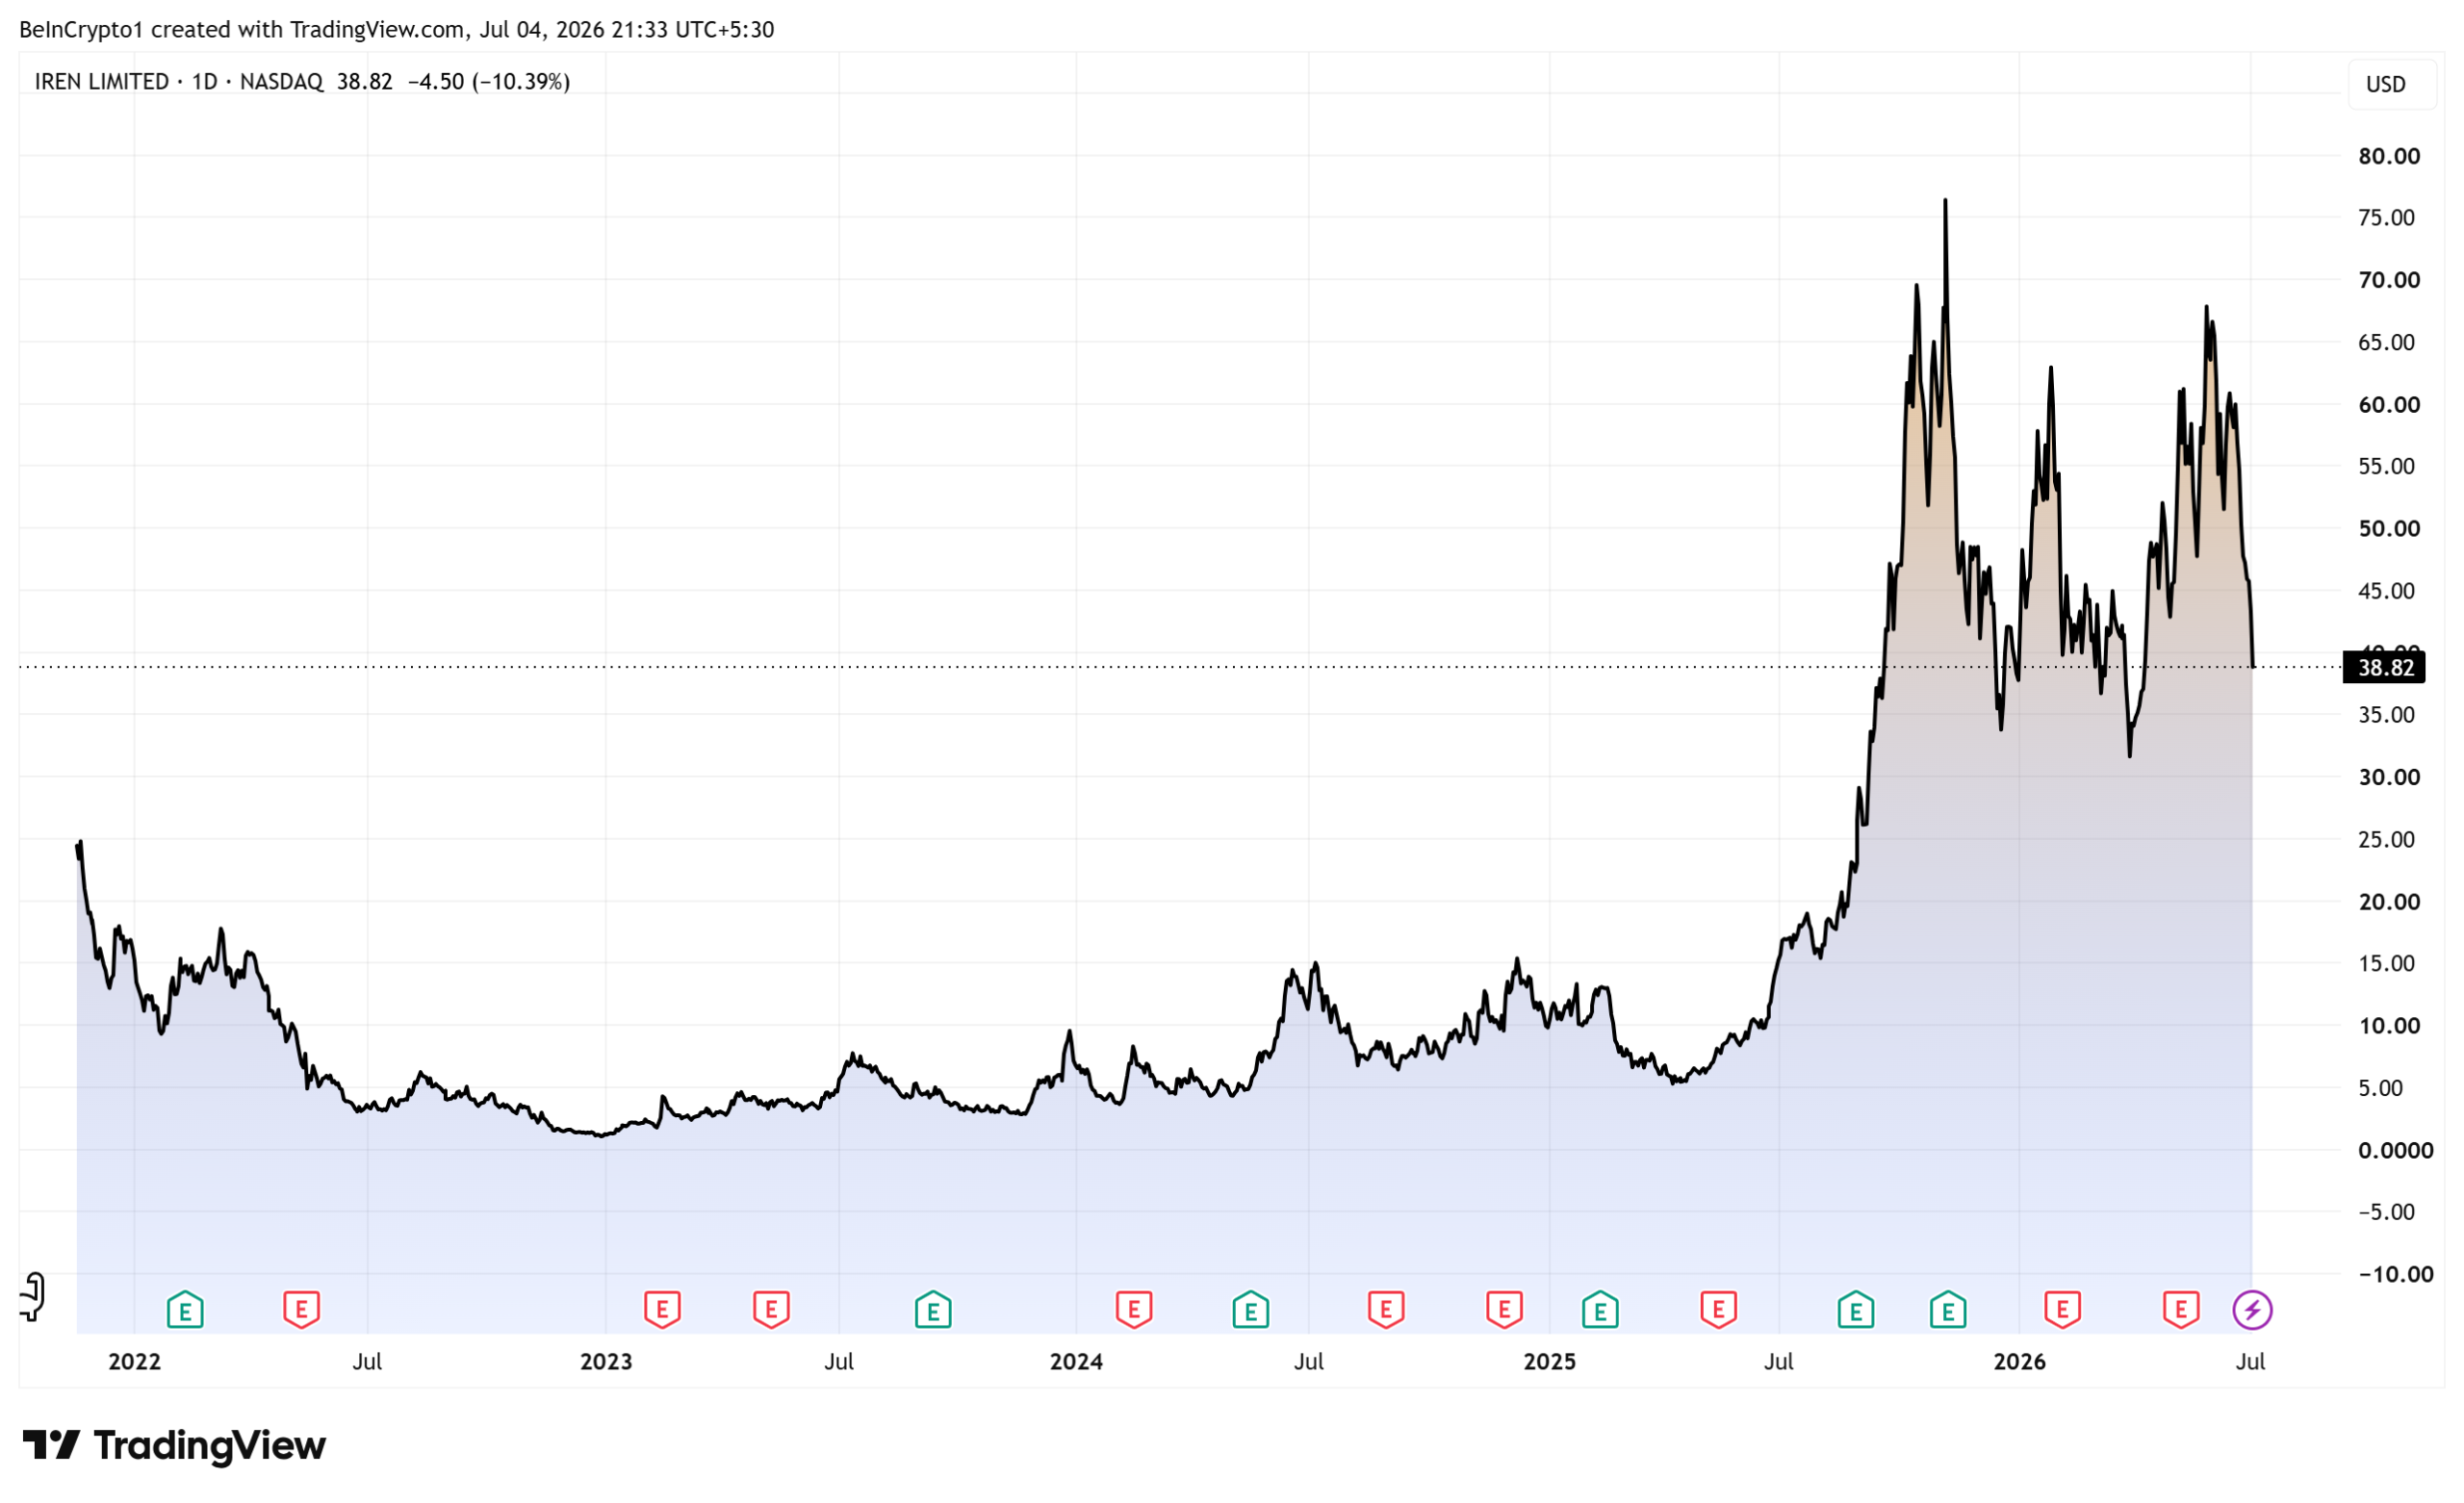
IREN stock fell about 10% to $38.82 on July 2, according to TradingView data. The drop stung even by the standards of volatile crypto mining stocks.

Short seller Jim Chanos flagged the size. He put the award near 17% of IREN’s projected cumulative adjusted net income from fiscal 2027 through 2030. The shares vest on time served, not performance.
Follow us on X to get the latest news as it happens
IREN’s board said it weighed performance and hybrid designs first. It cast the award as the close of a multi-year pay plan.
“The Equity Grants are designed to retain and incentivize the Co-CEOs to lead the Company through its next phase of growth and the execution of its long-term strategic plan,” IREN said in its filing.
By fading founder votes and locking fresh stock to 2033, the deal reads as alignment or entrenchment. The answer will follow the wider mining-to-AI transition and what the brothers deliver.
The post Bitcoin Miner IREN Falls After $700 Million CEO Stock Award appeared first on BeInCrypto.
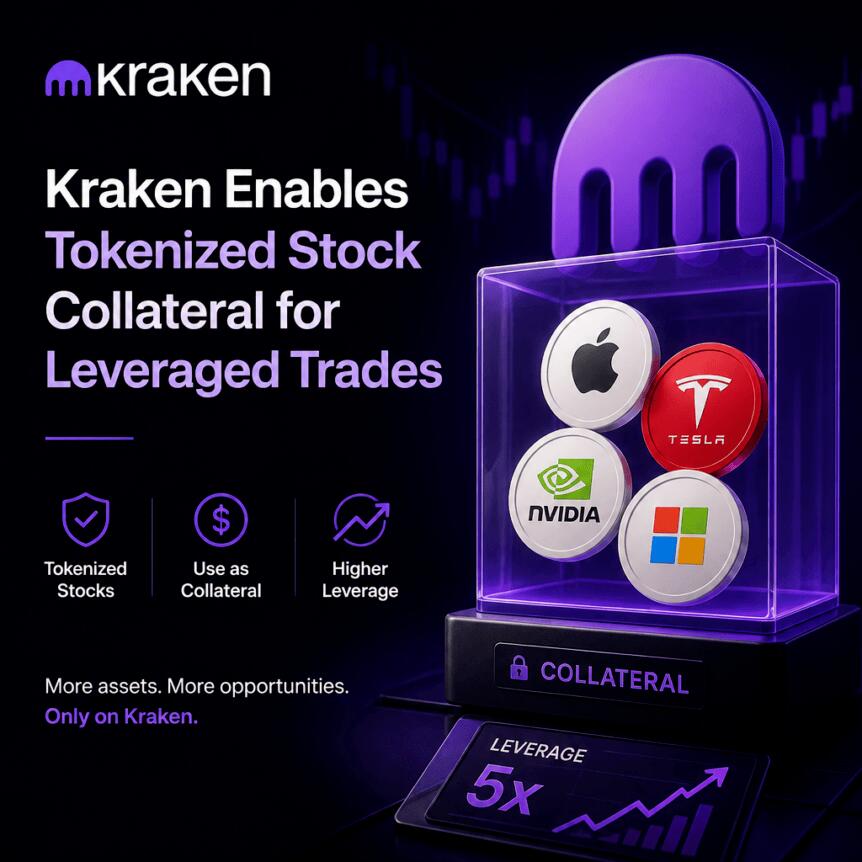
Kraken has started accepting select tokenized stocks and exchange-traded funds (ETFs) as collateral for futures and margin trading, enabling eligible customers to take leveraged positions without first selling those tokenized holdings.
The feature initially covers 10 tokenized instruments, including major single-name equities such as Apple, Nvidia, and Tesla, as well as tokenized ETFs including Strategy, the SPDR S&P 500 ETF, and Invesco QQQ Trust.
Key takeaways
- Kraken now accepts specific tokenized stocks and ETFs as collateral for futures and margin trading, reducing the need to liquidate existing positions.
- Eligible assets receive risk-based collateral “haircuts,” with broad-market ETFs discounted less than more volatile stocks.
- Collateral limits apply per asset class, with broad-market ETFs capped at up to $1 million in collateral value.
- Access is limited to eligible clients outside the United States; futures collateral in the European Economic Area and margin collateral in other eligible jurisdictions.
How Kraken’s collateral framework works
According to Kraken, each supported tokenized stock or ETF is assigned a collateral haircut, which reduces the lending value of posted collateral depending on perceived risk. Broad-market ETFs receive the lowest discount at 10%, while certain more volatile holdings are discounted more heavily—Kraken states that Strategy and Robinhood are discounted by 30%.
In addition to haircuts, Kraken also set collateral limits for each asset. Broad-market ETFs can be posted up to $1 million in collateral value. Most individual stocks have a limit of $250,000. Tokenized gold and Circle shares are capped at $100,000.
The exchange emphasized that both the haircut percentages and the collateral limits are subject to periodic review and may change over time.
Scope: which tokenized assets are included
Kraken’s initial rollout supports 10 tokenized stocks and ETFs. The list includes widely followed names such as Apple, Nvidia, and Tesla, along with Strategy.
For broad market exposure, the exchange includes tokenized ETF products such as the SPDR S&P 500 ETF and Invesco QQQ Trust. The collateral program also extends to tokenized gold and Circle shares, though these carry different collateral caps compared with the equity and ETF set.
Geographic limits and trading use cases
Kraken said the collateral support is available only to eligible clients outside the United States. Tokenized stocks can be used as collateral for futures trading in the European Economic Area.
Margin collateral support is available in other eligible jurisdictions outside the European Economic Area. Kraken did not indicate that the tokenized-collateral feature is generally available worldwide, so customers should confirm eligibility in their region before planning trades around it.
Why this matters for tokenized markets
Kraken’s decision aligns with a broader push to expand the real-world utility of tokenized assets beyond simple trading. The core investor benefit is straightforward: if tokenized securities can be posted as collateral, they can help users access leverage and financing-style trades without triggering a sale that may be subject to liquidity constraints or other execution considerations.
It also fits into a wider pattern of exchange and market infrastructure developments aimed at making tokenized securities usable across more parts of capital markets—particularly as collateral, settlement components, and building blocks for structured lending.
For example, earlier this year, Cointelegraph reported that Franklin Templeton and Binance launched a program allowing institutions to use tokenized money market fund shares as trading collateral while the underlying assets remained in regulated off-exchange custody. Separately, BlackRock’s tokenized US Treasury fund, BUIDL, has been accepted as trading collateral on platforms including Binance, Crypto.com, and Deribit, reflecting growing interoperability for tokenized government and cash-like instruments.
Other market plumbing has also been advancing. Cointelegraph noted that Tradeweb executed what it described as a first real-time purchase and sale of a tokenized US Treasury settled against tokenized cash on the Canton Network. While those developments differ in mechanism from Kraken’s collateral haircuts, they collectively point to a trend: tokenized assets are increasingly being integrated into the operational flows that support trading and financing.
Market growth signals: tokenized stocks remain a fast-rising segment
Data compiled by RWA.xyz suggests tokenized real-world assets have grown to roughly $32.6 billion in distributed value. Within that broader total, tokenized stocks reportedly increased to about $2 billion from approximately $381 million a year earlier.
That growth backdrop helps explain why exchanges are moving to make tokenized holdings more functional. As the number and variety of tokenized securities increase, collateral acceptance can become a competitive differentiator—especially for users who want to maintain exposure while accessing leverage or margin capacity.
For readers tracking the sector, RWA.xyz maintains an accessible overview of tokenized stock distribution, including categories under RWA.xyz stocks.
Going forward, investors and traders should watch for Kraken’s next rounds of updates: whether additional tokenized equities and ETFs are added, how haircuts and collateral caps change with volatility and market conditions, and how the exchange expands availability across jurisdictions outside the United States.

Noble Audio Osprey Review: $199 Audiophile Earbuds Put Sound Quality First
‘My lovely neighbour was turfed out from her home for a stream of Airbnb strangers – I’m furious’
June 2026 Market Recap: Bitcoin Hits 2-Year Low as ETFs Bleed $8.9B


-

 Fashion1 day ago
Weekend Open Thread: High Hopes
-

 Politics2 days ago
The House | “Reframing the debate from a binary discussion of winners and losers”: Yuan Yang reviews ‘We Are Not Machines’
-

 Crypto World5 days ago
Strategy authorizes up to $1.25B in Bitcoin sales under new capital plan
-

 News Videos6 days ago
MAJOR BITCOIN & MARKET UPDATE!!!! (MUST WATCH ASAP!!!)
-

 Tech5 days ago
Anonymous researcher drops 0-day ‘exploitarium’ repo
-

 Business5 days ago
Australia treasurer says alleged access of prime minister’s bank data ’incredibly concerning’
-
 Business5 days ago
The AI boom won’t burst all at once. It will pop in ‘rolling bubbles’: Macquarie
-

 Sports4 days ago
Broncos roster: OL Ben Powers (No. 74) entering final year of contract
-

 NewsBeat4 days ago
Presenter Caroline Flack’s brother Paul Flack dies aged 55
-

 Crypto World3 days ago
Binance stock trading tops $1B in first month after launch
-

 Crypto World3 days ago
Alibaba-affiliate Ant Group enters the humanoid robot market with 12 deals
-
 NewsBeat3 days ago
New exhibition reflects five decades of movement between island of Ireland and GB
-

 News Videos5 days ago
How to Build INSANE Live Financial Dashboards With Claude
-

 Business3 days ago
Meta Platforms Stock Jumps 7% Today as Bloomberg Reports Company Plans to Enter the Cloud Business
-

 Business2 days ago
What a 10 Percent Drop Means for Buyers, Sellers and Renters
-

 Crypto World2 days ago
Binance Re-Enters Philippines As EU MiCA Rules Restrict Access
-

 Tech5 days ago
The attack that hijacked Claude Code came through Sentry. Datadog, PagerDuty, and Jira have the same exposure.
-
 Business5 days ago
PRISM’s IPO filing mentions Zostel case, CCI investigation
-
 Crypto World4 days ago
Airdrop Registration Becomes Key Focus For Remittix As RTX Launch Updates Approach
-
 Crypto World1 day ago
Standard Chartered Secures MiCA License as ESMA Adds 37 New Crypto Firms
You must be logged in to post a comment Login