

Crypto World
Break and Retest Strategy in Trading
The break and retest strategy is a trading approach based on support and resistance levels. A breakout occurs when price moves beyond a key level, while a retest happens when price returns to that level before potentially continuing in the direction of the breakout. Traders use this strategy in forex and CFD markets to identify possible trend continuation setups and evaluate market structure shifts.
The approach is commonly applied in trending conditions, where price momentum may support continuation after the retest is confirmed. Traders often combine break and retest in trading with price action analysis, volume, or technical indicators to assess breakout strength and manage risk more effectively. In this article, we explain how the break and retest strategy works, how traders may apply it in different market conditions, and which confirmation methods are commonly used.
Break and Retest Strategy Explained

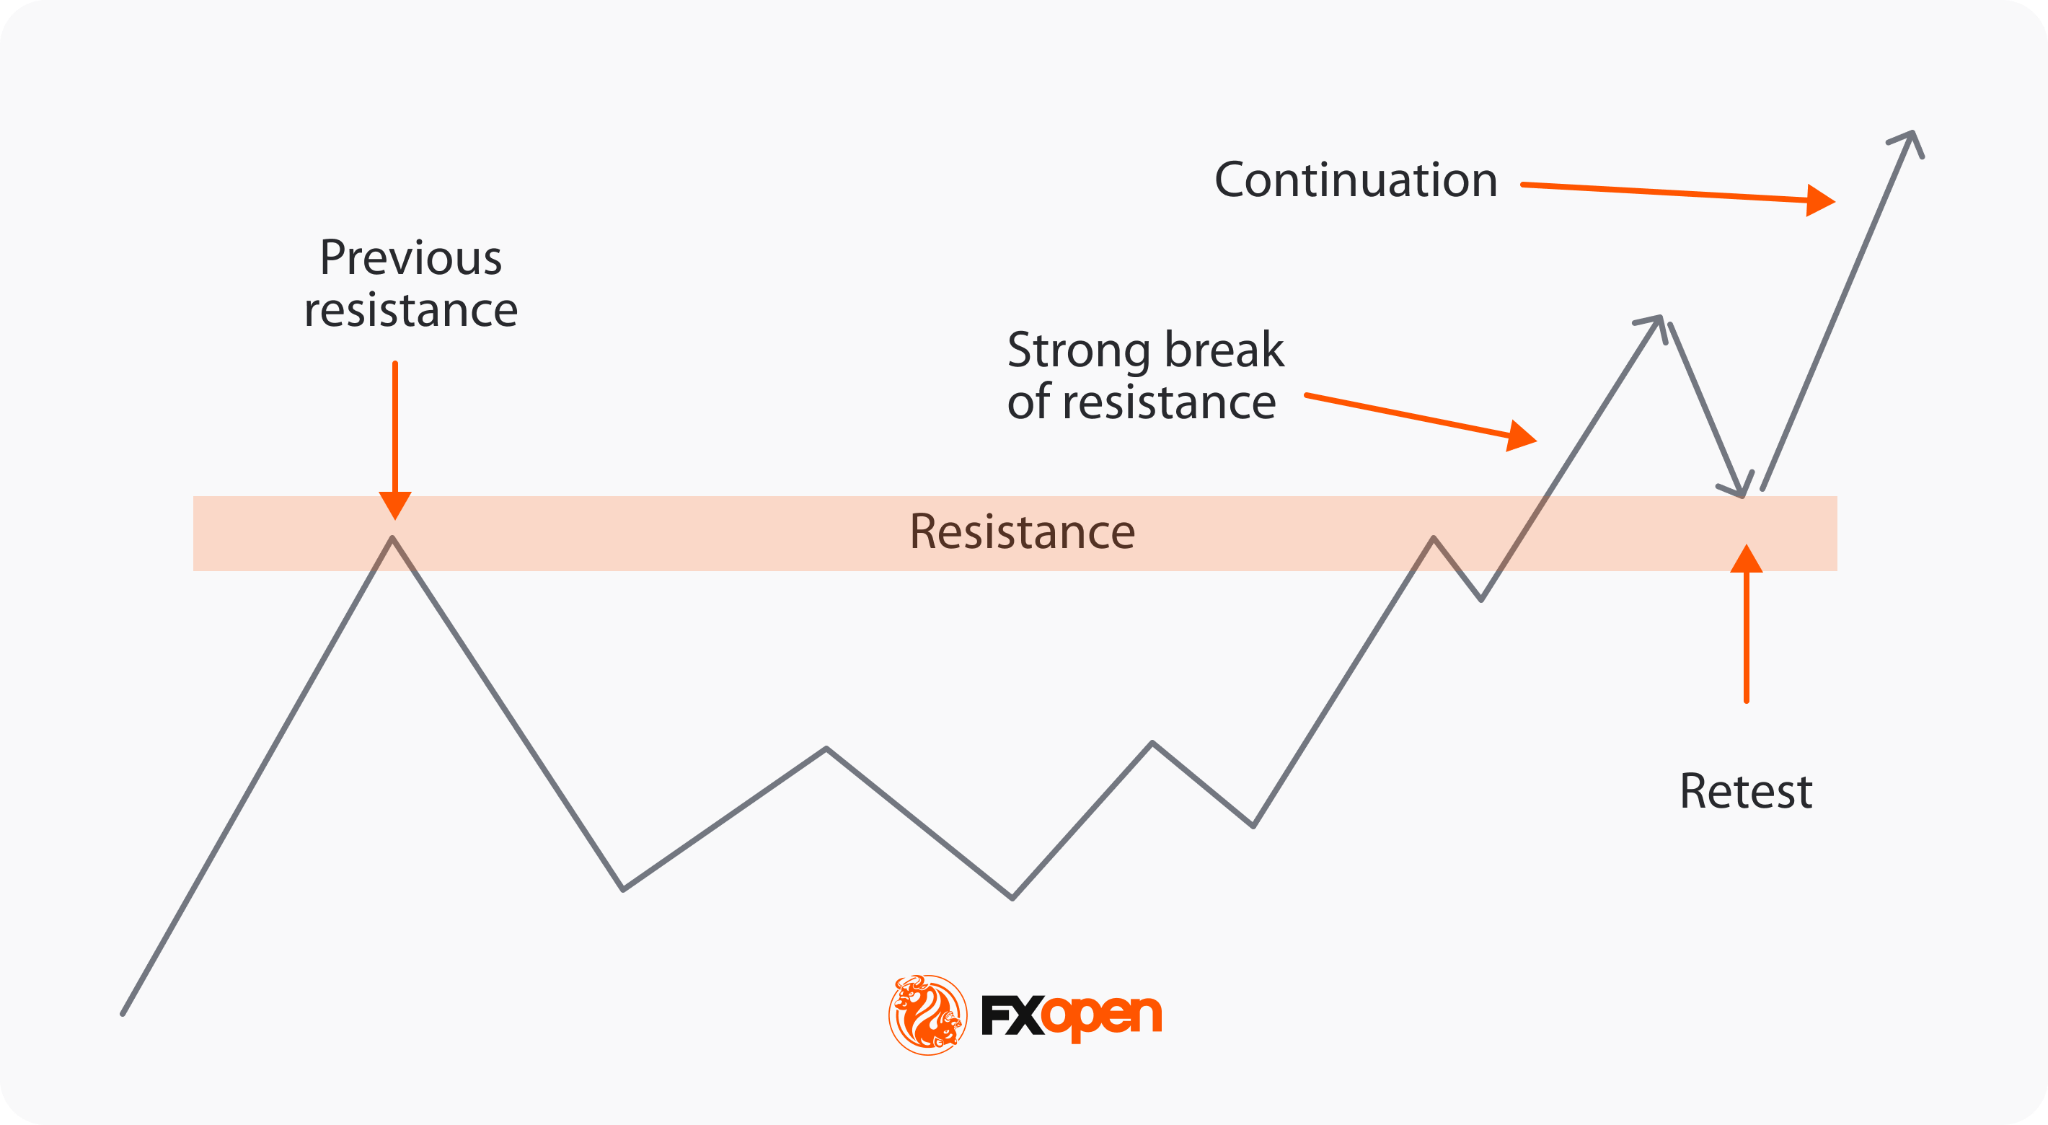
The break and retest strategy involves three stages. Price first breaks a major support or resistance level. It then returns to retest that level. Finally, the trend continues in the breakout direction. Each stage builds on the previous, with the retest giving traders a second reference point.
The breakout itself is a liquidity shift. Resting orders above resistance and below support get absorbed when price moves through. New positions then build in the breakout direction. The retest acts as validation: the level either holds in its new role or fails.
A support/resistance retest works on role reversal. Broken resistance often acts as support on the return move. Broken support often acts as resistance. When the retest holds and price moves away from the level, the original signal is confirmed. The trend tends to continue from that point.
Break and Retest Strategy Steps
The break and retest strategy follows a fixed sequence. Each step builds on the last, with execution clarity around entries, stops, and invalidation.
1. Identifying Key Levels
Traders mark significant support and resistance levels on the chart. Levels validated by multiple touches and clear reactions carry more weight than untested ones.
2. Monitoring for a Breakout
A breakout occurs when price closes decisively beyond a key level, often with rising trading volume. A volume surge supports the move and reduces the chance of a false break.
3. Waiting for the Retest
After the breakout, price often retraces to test the broken level. Former resistance now acts as support, or former support as resistance, depending on direction.
4. Confirming the Retest
Confirmation comes from price action at the retest. Rejection candles such as pin bars or engulfing patterns, paired with sustained volume, suggest the new level is holding.
5. Entering the Trade
Traders typically enter once the rejection candle closes.
6. Managing the Trade
Traders could set take-profit levels at prior swing points or fixed risk-reward ratios. Stop-loss orders could sit beyond the retest extreme: below the new support for longs, above the new resistance for shorts. They also may be trailed to protect unrealised gains as price moves favourably.
Entry and Exit Logic
A break and retest entry strategy needs a defined trigger. The most common is a candle close in the breakout direction after the retest, often with a rejection wick at the level. Aggressive traders typically enter on the close of the rejection candle itself. More conservative traders typically wait for the next candles to confirm direction before committing.
Stop placement follows the structure. For longs, stops typically sit a few pips below the retest low or below the most recent swing point. For shorts, stops sit above the retest high or below the most recent swing high. Position sizing then scales to the stop distance rather than the other way around. This anchors risk management to where the trade idea is invalidated, not to an arbitrary pip figure.
Take-profit targets are commonly set at the next significant structural level, or at a fixed risk-reward ratio such as 1:2 or 1:3.
Break and Retest Trading Example (Forex)
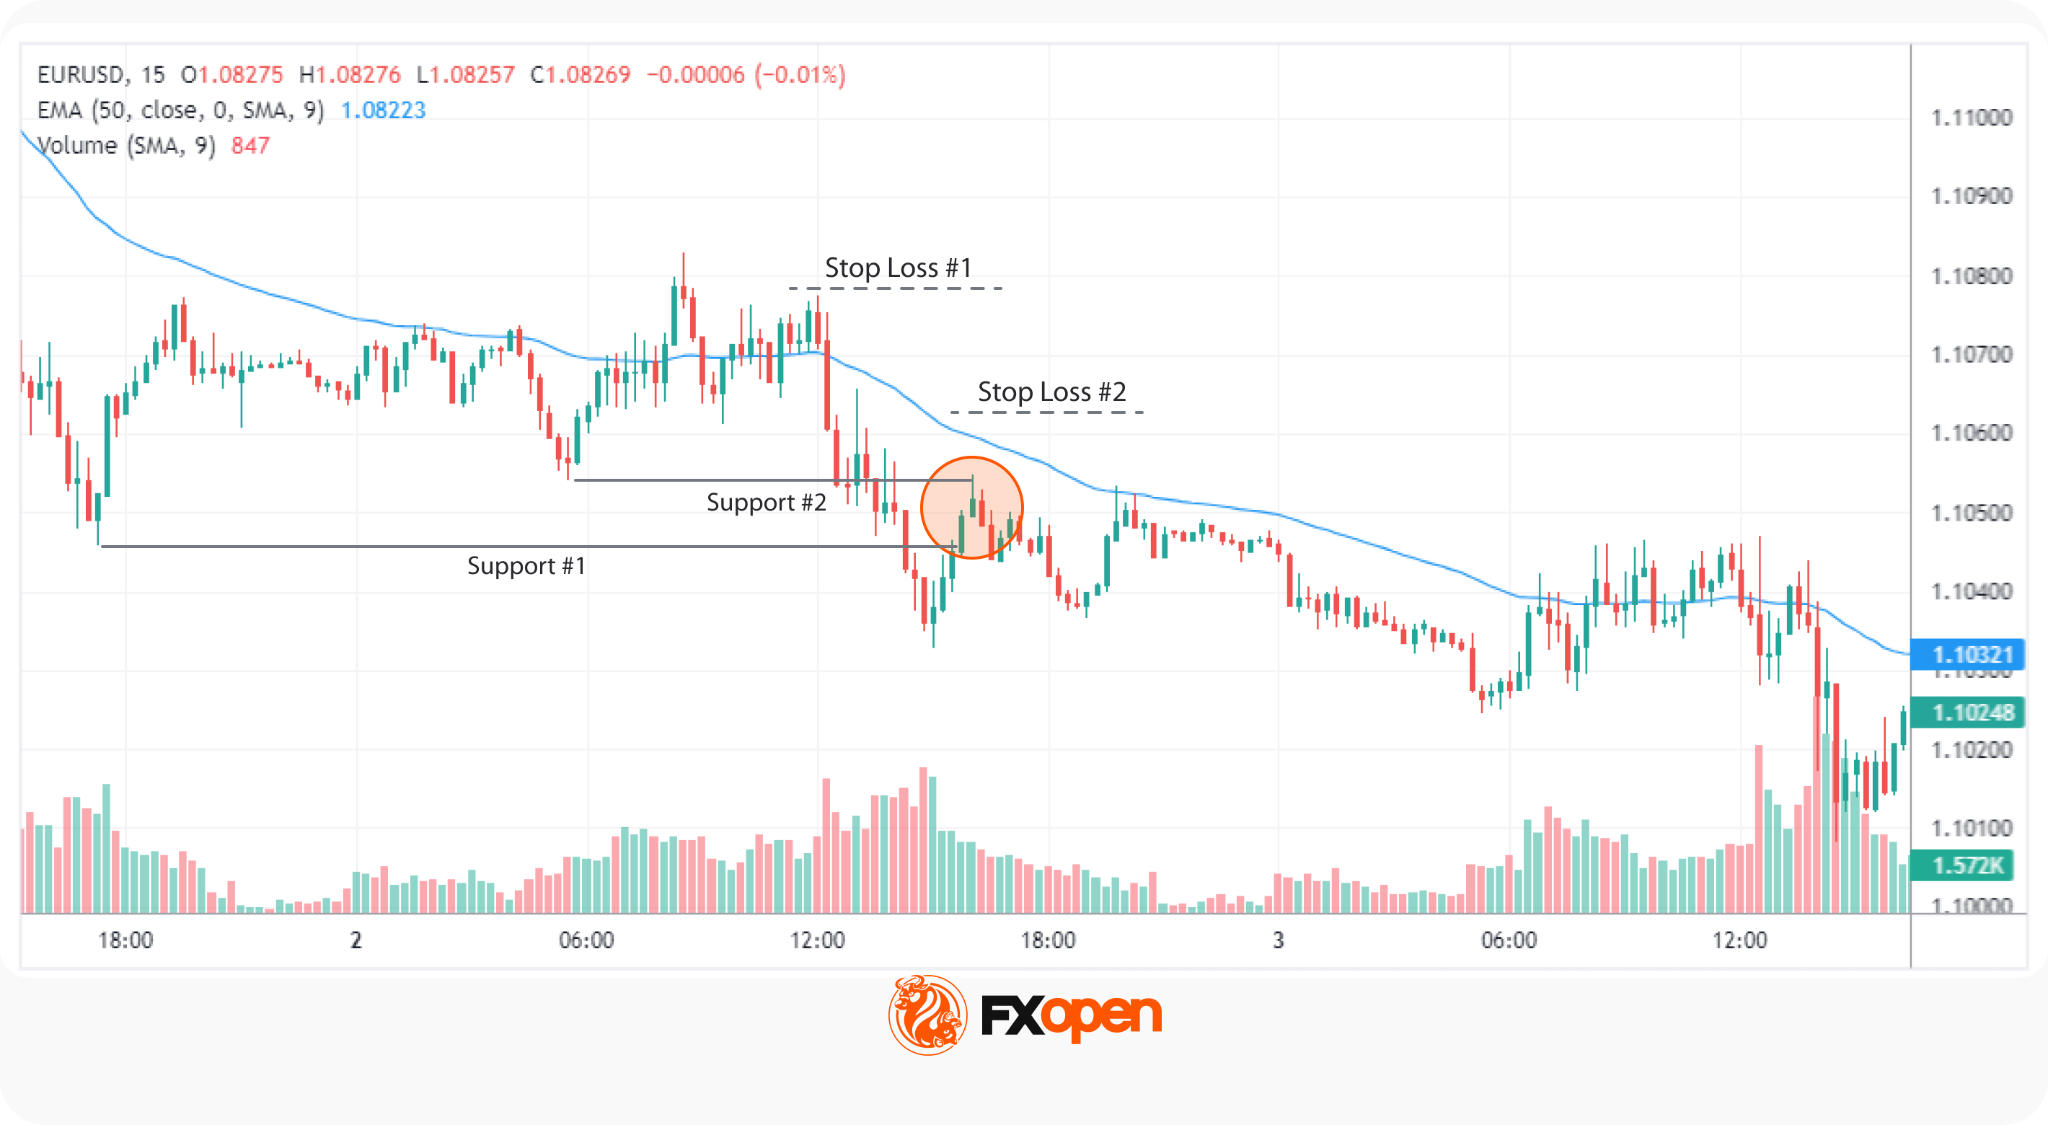
Consider this EUR/USD 15-minute chart, which displays a clear bearish trend. The 50-period Exponential Moving Average (EMA) slopes downward, acting as dynamic resistance with price staying below it. Recently, the price broke below a key support level on higher-than-average volume, signalling the time to apply the break and retest strategy.
Two support levels are worth monitoring. The first sits at the broader structural low. Trading at this level can allow traders to enter the market quickly, though it comes with a less favourable risk-reward ratio.
The second support level is found within the recent brief retracement. This level offers an entry with a tighter stop, improving the risk-reward profile. The trade-off is that price may not retrace deeply enough, leaving traders without a fill.
The entry point is identified by a candle with a wick longer than its body (a pin-bar on the 30m chart), indicating rejection of higher prices as the market retests the second support level. Once this candle closes, traders typically enter at the next candle.
Stop losses would typically be placed either above the last major swing high or the 50-period EMA, depending on individual risk tolerance. Take-profit targets are commonly set at a 1:3 risk/reward ratio, where every pip risked targets three pips of potential return. An alternative is the next significant support level below, where price reaction may develop.
Alternative Entry Scenarios
Not every retest develops the same way. A shallow retest pulls back only marginally before resuming the trend, often leaving conservative traders without a fill. An aggressive entry on the first rejection candle captures these moves but accepts wider initial drawdown risk.
A deep retest pulls back further into the previous range, sometimes to the 50% or 61.8% Fibonacci level of the breakout swing. These setups could offer tighter stops and a stronger risk-reward profile, though they carry a higher chance of the level failing entirely. Ultimately, missed trades are a cost of waiting for confirmation in a breakout trading strategy.
Confirmation Methods in Break and Retest Trading
Price action remains the primary confirmation tool. A rejection candle at the retest level carries more weight than any indicator reading on its own. Indicators, multi-timeframe analysis, Fibonacci levels, and fundamentals are layered on top of that price-action signal rather than used in isolation.
Retest trading confirmation signals gain reliability when two or more methods align around the same level. Conflicting signals are themselves information, often pointing to a setup worth skipping. Here are several methods traders consider:
1. Indicators
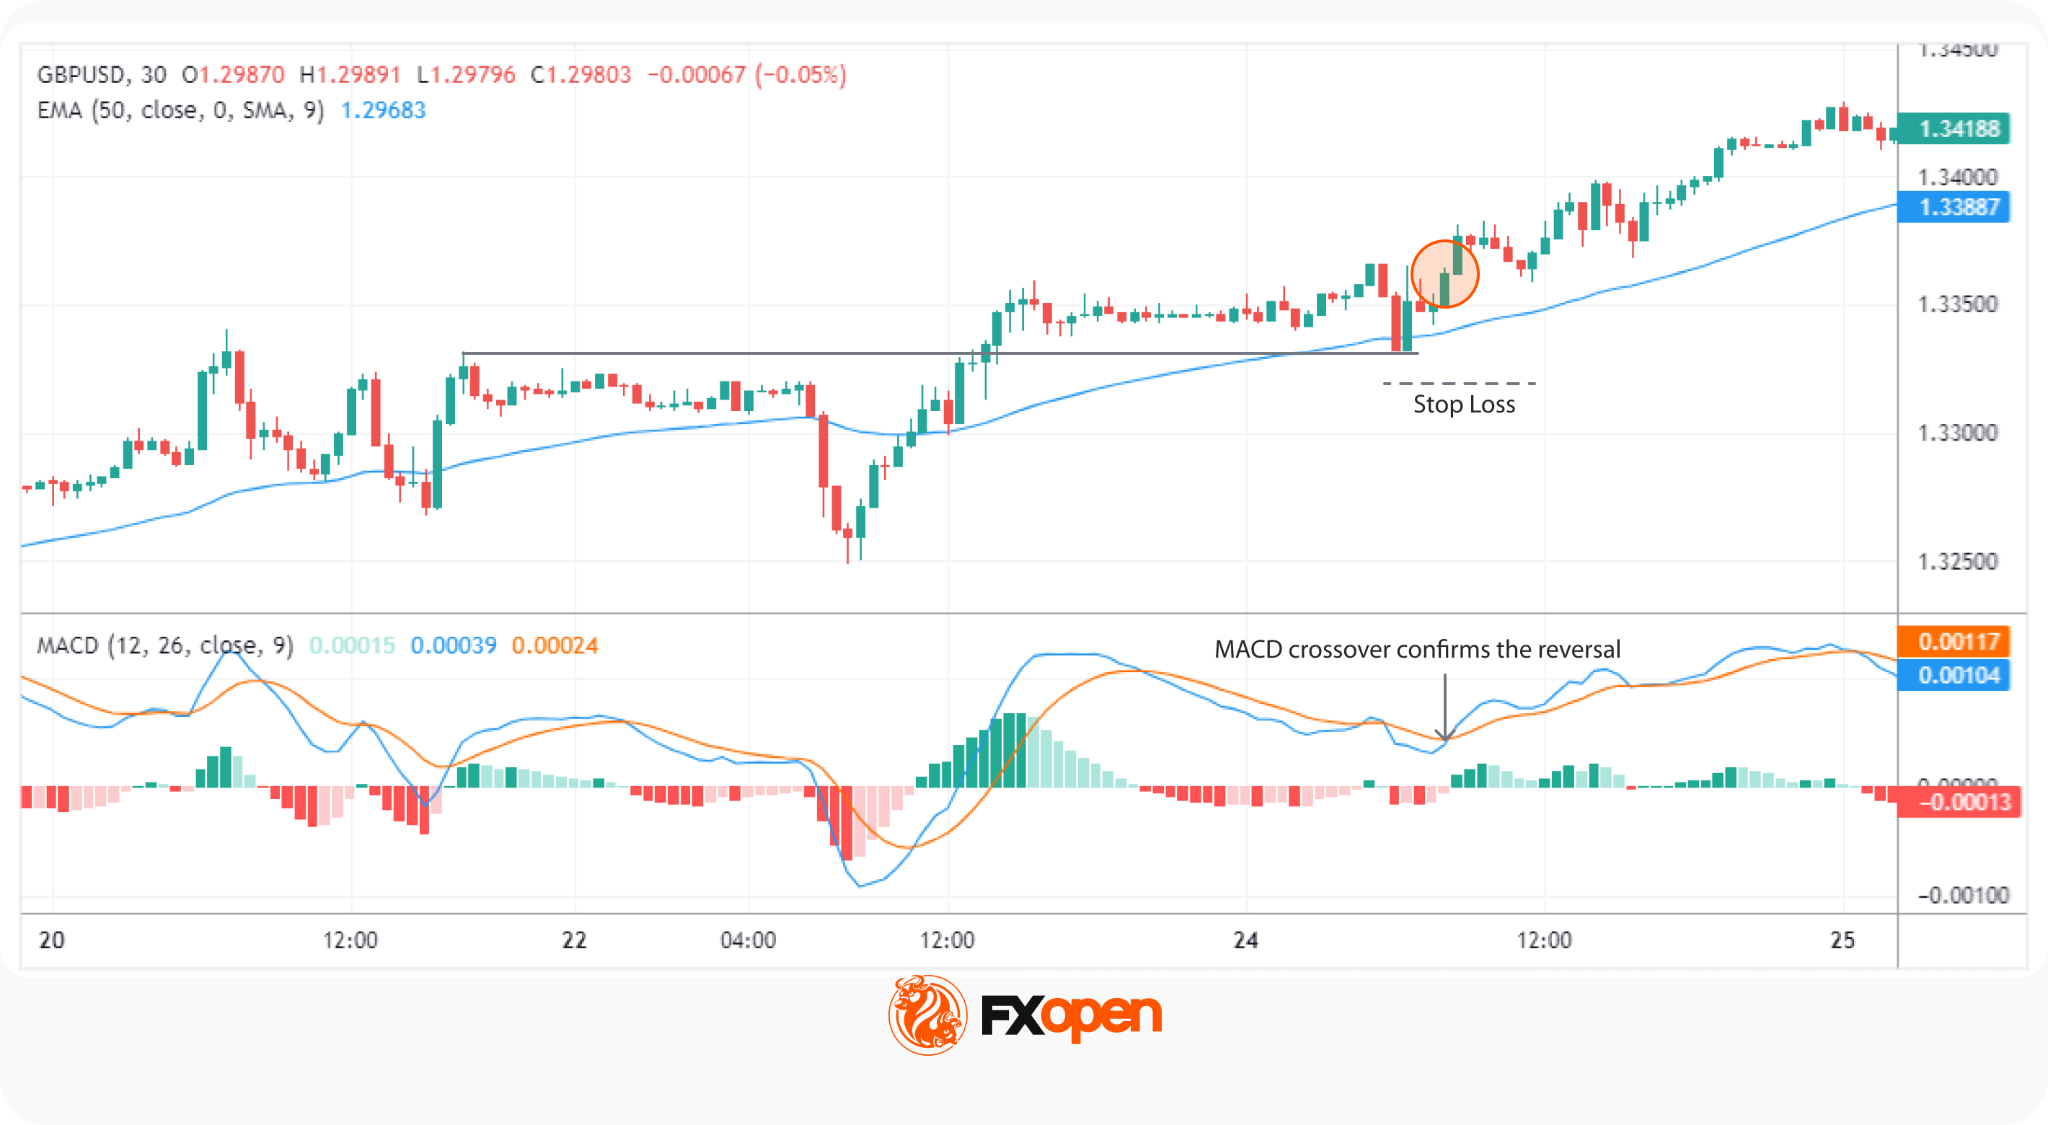
The RSI and MACD are two common break and retest indicators. An RSI crossing below 70 or above 30 during a breakout suggests weakening upside/downside momentum. An MACD line crossing above/below its signal line, or the histogram rising/falling above zero, suggests strengthening bullish/bearish momentum.
2. Multi-Timeframe Analysis
Multi-timeframe analysis works top-down. The higher timeframe (HTF) sets the directional bias, the lower timeframe (LTF) refines entry timing. A breakout observed on a 4-hour chart gains additional confirmation when a strong trend is also visible on a daily chart. Alignment across timeframes filters out lower-timeframe noise.
3. Fibonacci Retracements
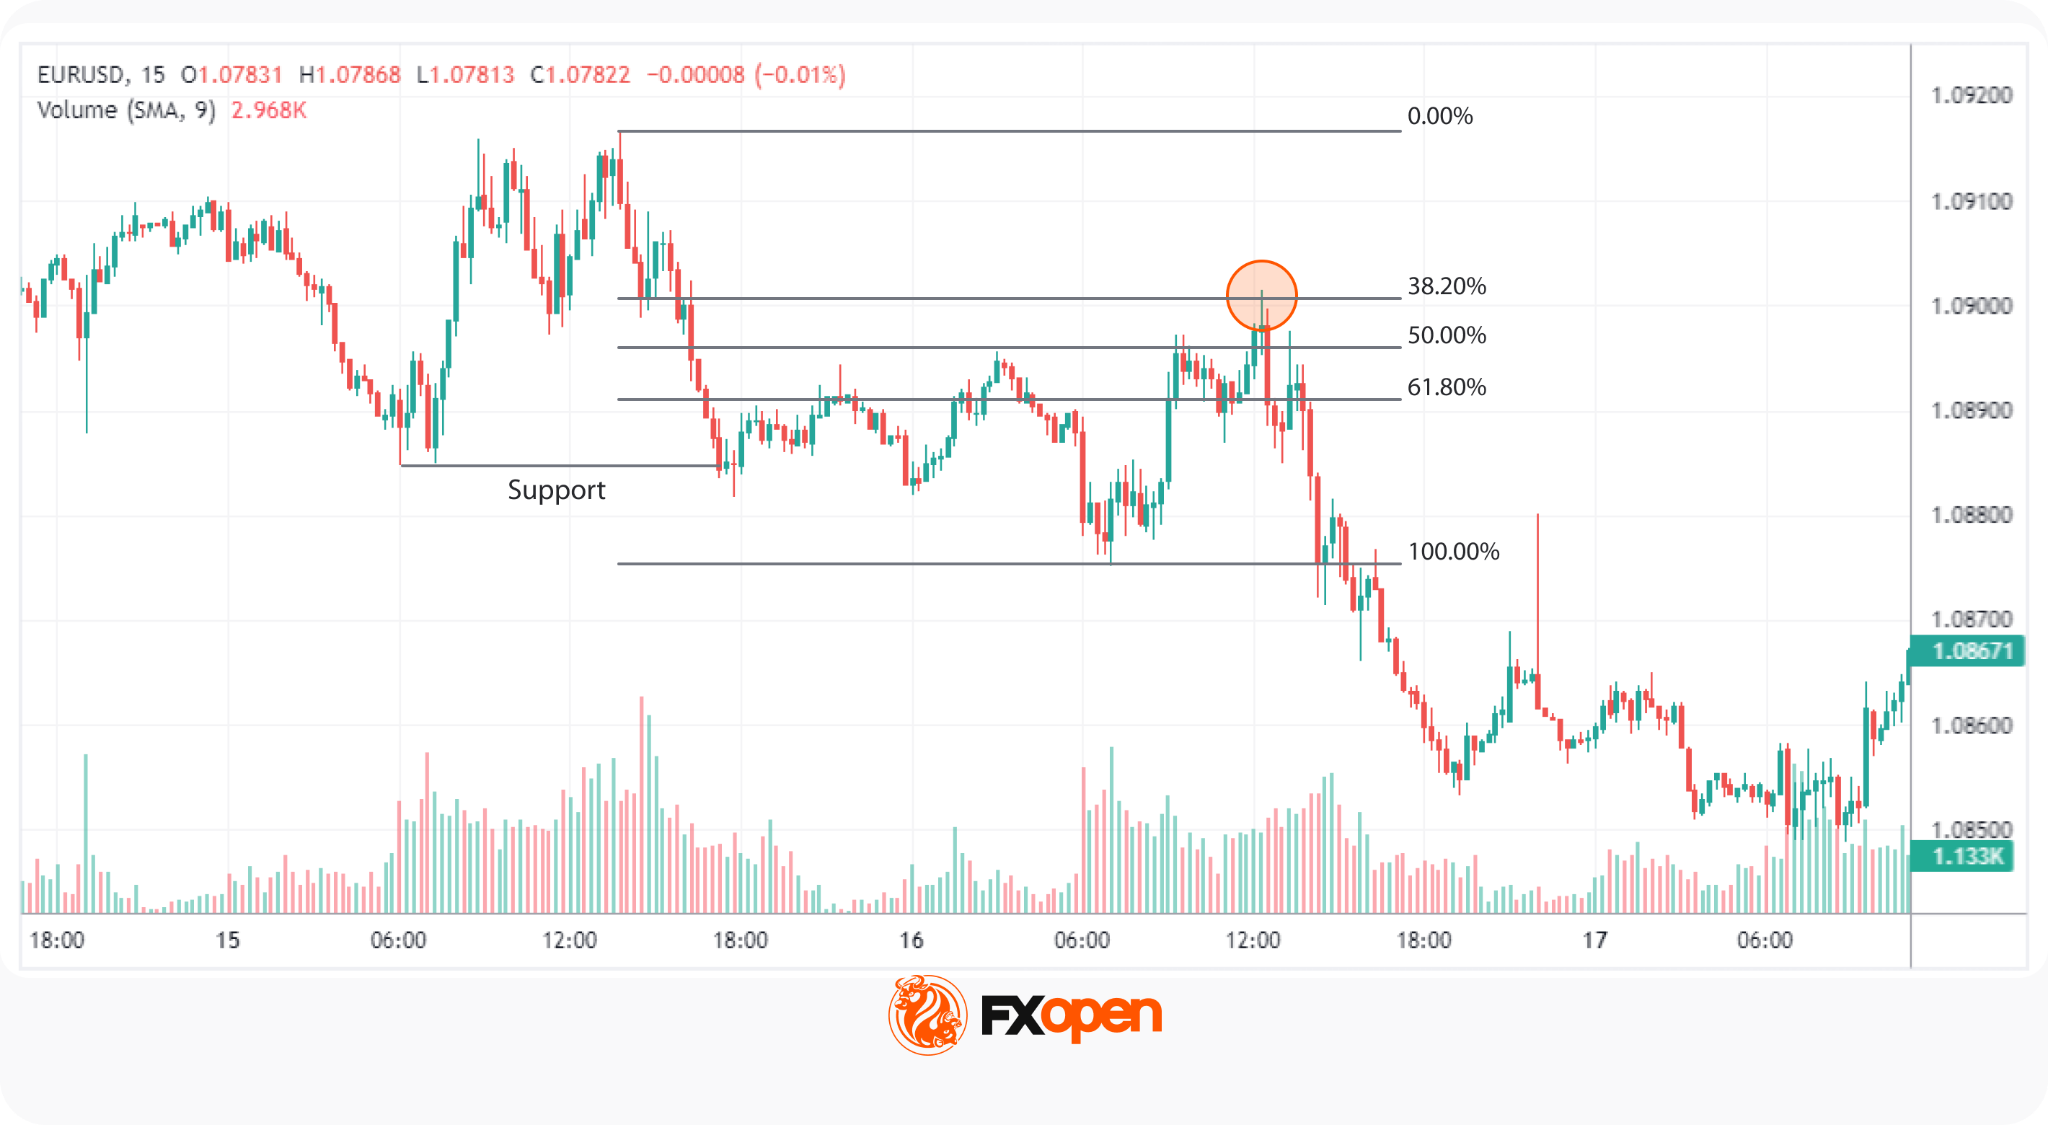
The Fibonacci retracement tool is drawn from the breakout swing high to the breakout swing low (or vice versa for bullish setups). The 38.2%, 50%, and 61.8% levels are the most-watched retest zones. According to theory, a retest that holds at one of these levels carries stronger structural support than a retest at an arbitrary price.
4. Fundamental Analysis
Fundamentals tie technical setups to real volatility drivers. A breakout aligned with a major economic release or central bank decision is more likely to sustain than one occurring in low-volume conditions. Traders typically cross-check an economic calendar for scheduled events around the retest window.
When Break and Retest Conditions Are Valid
Recognising when conditions favour the strategy is as important as the entry mechanics.
Trending markets may produce clearer break and retest setups because a directional bias can support continuation after the breakout. Range-bound or choppy markets generate frequent false breaks, with price flipping back through levels without commitment.
Volatility expansion may support breakout validity. A move accompanied by widening range and rising volume suggests participation behind the price action. A breakout on flat volume often lacks the order flow to sustain.
Session timing may also influence a forex breakout strategy. The London and New York sessions account for a large share of daily forex turnover, while their overlap is often associated with higher liquidity and volatility. As a result, some traders monitor breakouts forming during these periods more closely than those developing in quieter market conditions, where price expansion may be less consistent.
Advantages of the Break and Retest Strategy
The break and retest strategy has several advantages that make it one of the most popular trading approaches:
- Additional Confirmation: The retest serves as an additional validation of the breakout, boosting trader confidence in their entry decision and reducing hesitation.
- Strong Risk Management: Setting stop-loss orders based on the retest level provides a clear risk boundary.
- Alignment with Market Trends: This strategy naturally aligns trades with the prevailing market trend. By trading in the direction of the breakout, traders can take advantage of sustained movements.
- Versatility Across Markets: The breakout and retest strategy can be applied to various financial instruments, including forex, stocks, and commodities. Its adaptability makes it a valuable tool in diverse trading environments.
- Scalability and Flexibility: This strategy can be adapted to different timeframes and trading styles, making it popular among both short-term and long-term traders seeking to implement a consistent approach.
Disadvantages of the Break and Retest Strategy
While the break and retest strategy can be a powerful tool, traders may face several challenges when implementing it:
- False Breakouts: Not every breakout leads to a sustained trend. Sometimes, the price moves beyond a support or resistance level only to reverse shortly after. Recognising these false signals is crucial to avoid entering trades that may quickly turn against expectations.
- Market Conditions: According to theory, this strategy is more popular in trending markets. In sideways or highly volatile environments, breakouts can be less reliable, making it harder to distinguish a strong price movement from random swings.
- Timing the Retest: Accurately determining when the price will retest the broken level can be challenging. Entering too early may expose traders to higher risk, while waiting too long might result in missed trades if the retest doesn’t occur as anticipated.
- Reliance on Confirmation Signals: While additional indicators like RSI or MACD can support the strategy, over-reliance on these tools can complicate decision-making. Traders balance multiple signals without becoming overwhelmed or confused.
- Emotional Discipline: Maintaining discipline during retests is critical. Traders might feel pressured to act quickly if the market moves unexpectedly, leading to impulsive decisions that deviate from their trading plan.
Common Mistakes in Break and Retest Trading
Several recurring mistakes may reduce the effectiveness of the strategy. Recognising them early may help traders manage risk more consistently.
- Early entry. Jumping in on the first touch of the level rather than waiting for a rejection candle leaves the trade exposed to a false breakout. The retest needs to confirm, not just occur.
- Ignoring higher timeframes. When traders ignore a higher-timeframe trend, it may turn valid setups into low-probability trades. A clean retest against the daily-chart direction often fails, even when the lower-timeframe structure looks textbook.
- Chasing breakouts is the opposite error. Entering well after the initial break, with price already extended, could give a poor risk-reward profile and a wider stop. The retest is expected to be the entry, not the breakout candle.
- Overusing indicators clutters the decision. Stacking RSI, MACD, Bollinger Bands, and Stochastics on the same chart produces conflicting signals more often than convergent ones. One or two confirmation tools layered on price action often are more popular than five.
The Bottom Line
This strategy provides a structured approach for trading on breakouts and retests. Understanding how the price may behave after a breakout may support traders in their future decisions. One of the major advantages of the break and retest strategy is that it can be applied across different markets and timeframes. However, traders should note that break and retest trading requires consideration of market conditions and careful risk management.
Traders looking to apply the strategy can consider opening a trading account at FXOpen and gain access to three advanced trading platforms, tight spreads, and low commissions from $1.50 per lot (additional fees may apply).
FAQ
What Is a Retest in Trading?
A retest occurs when the price returns to a broken support or resistance level after an initial breakout. It serves to confirm the strength of the breakout, which may help traders decide whether the new trend will continue or if the breakout was false.
What Is the Break and Retest Strategy?
The break and retest strategy involves identifying a breakout of a key support or resistance level and then waiting for the price to return to that level. Traders use this retest as a confirmation to enter the market, aiming to follow the new trend.
How Many Times Can I Backtest My Strategy?
Backtesting is typically done extensively across different market conditions and timeframes. According to theory, traders need to test a strategy on at least 100 trades to understand how it performs in various scenarios.
Does Retest Always Happen?
No, the retest does not always happen. While retests are common, they are not guaranteed. Traders often use additional confirmation signals and be prepared for both possibilities when applying the break and retest strategy.
Which Timeframe Is Used for Break and Retest Trading?
The break and retest strategy works across timeframes. Higher timeframes such as the 4-hour and daily charts may produce clearer break and retest setups, as price movements can appear less affected by short-term market noise. Lower timeframes may appeal to active traders but can generate more frequent false breaks and less stable retest behaviour.
What Confirms a Valid Retest?
A valid retest is confirmed by price action at the broken level. Rejection candles such as pin bars or engulfing patterns, sustained volume, and alignment with the higher-timeframe trend all add weight. Confirmation matters more than the speed of entry.
Is Break and Retest Suitable for Forex Trading?
Yes. The break and retest strategy is widely applied in forex due to clear support and resistance structure and high liquidity. Major pairs such as EUR/USD and GBP/USD produce frequent setups, particularly during London and New York session overlaps.
This article represents the opinion of the Companies operating under the FXOpen brand only. It is not to be construed as an offer, solicitation, or recommendation with respect to products and services provided by the Companies operating under the FXOpen brand, nor is it to be considered financial advice.


Key takeaways
- ADA remains under pressure after last week’s 30% sell-off
- The coin could dip lower if the bearish trend in the market persists.
Cardano (ADA) continues to struggle on Wednesday, trading near $0.1600 and extending losses following last week’s sharp 30% decline.
The cryptocurrency remains under intense selling pressure as investor confidence weakens and retail participation fades.
Despite the bearish backdrop, on-chain data suggests that selling activity from long-term holders may be approaching exhaustion, potentially laying the groundwork for a future recovery.
Dormant supply spike suggests capitulation among long-term holders
Recent on-chain data from Santiment shows a significant surge in dormant ADA supply re-entering circulation during early June.
Several spikes in dormant supply spent exceeded 20 billion ADA, culminating in a massive 40.6 billion ADA movement on June 9, the largest recorded spike during the current sell-off.
This wave of activity indicates that long-term holders who had previously remained inactive chose to move or sell their holdings amid market weakness.
The surge also interrupted the growth in the average age of ADA wallets, confirming that dormant addresses became active again.
While further selling from long-term holders remains possible, such spikes are often viewed as capitulation events that signal the exhaustion of selling pressure and frequently precede market bottoms.
Retail sentiment toward Cardano has deteriorated significantly following last week’s decline.
Derivatives data highlights the decline in speculative demand. According to CoinGlass, Cardano futures Open Interest (OI) has dropped to $348.55 million, its lowest level since November 2024. This extends a steady decline from $585.35 million recorded on May 12.
A falling OI typically signals that traders are closing leveraged positions and becoming more risk-averse, reducing the likelihood of a strong recovery in the near term.
ADA price analysis: Can Cardano stay above $0.1500?
Cardano is trading slightly below $0.1600, maintaining a bearish trajectory after reaching a short-term peak of $0.1745 on Monday.
Technical indicators continue to favor sellers. The Relative Strength Index (RSI) at 39 is approaching the oversold territory, indicating severe selling pressure.
The Moving Average Convergence Divergence (MACD) remains below the zero line, confirming that bearish momentum remains dominant.
While oversold conditions could trigger occasional relief rallies, there is currently no strong evidence of a trend reversal.
If the rally resumes, ADA could surge past Monday’s high of $0.1745 before hitting the $0.2000 psychological level.
A move back above the $0.2205–$0.2275 zone would be needed to weaken the prevailing bearish outlook.

However, if the selloff persists, ADA could drop below Saturday’s low of $0.1486, with the major long-term support at $0.1000 also a target.
A break below $0.1486 could expose ADA to a deeper decline toward the $0.1000 region.
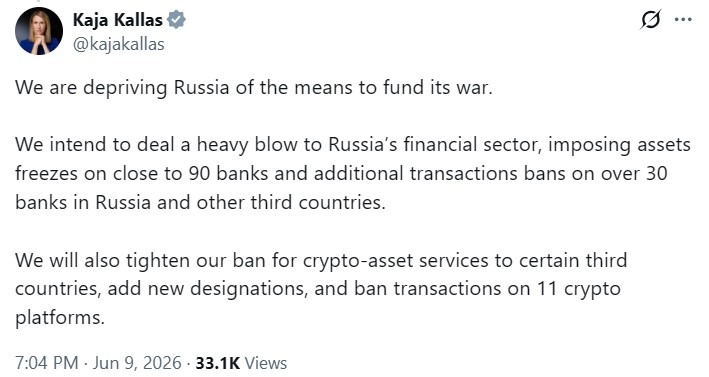
The European Union proposed banning transactions on 11 crypto platforms as part of its 21st sanctions package against Russia.
Kaja Kallas, vice president of the European Commission and the EU’s high representative for foreign affairs and security policy, outlined measures targeting banks, weapons manufacturers, oil traders, refineries and other entities outside the bloc.
“We will also tighten our ban for crypto-asset services to certain third countries, add new designations, and ban transactions on 11 crypto platforms,” Kallas said in a post on X.
The proposal would widen the EU’s sanctions campaign beyond Russian banks and energy revenues to crypto firms accused of helping Moscow circumvent restrictions imposed over its war in Ukraine.

Source: Kaja Kallas
The Commission did not identify the 11 crypto platforms in its public statements. Cointelegraph sought clarification on which platforms would be affected, but the Commission did not provide additional details before publication.
European Commission President Ursula von der Leyen said the package includes bans on 31 additional Russian banks and 20 entities in third countries, including banks, crypto platforms and oil traders.
She said the targets had served sanctioned Russian individuals and entities or helped circumvent EU measures.
EU proposal follows UK sanctions against HTX
The EU proposal follows the United Kingdom’s May 26 sanctions against Huobi Global S.A., the Panamanian company behind HTX, over alleged support for Russia-linked financial networks.
UK authorities said there were reasonable grounds to suspect HTX had supported the Russian government through financial services and funds facilitated by A7 Limited Liability Company and Garantex, both sanctioned entities.
Related: MiCA architect says EU should prioritize tokenization over DeFi rules
HTX has denied the allegations, saying the sanctioned entity is separate from the online exchange. A Global Ledger report later said HTX processed about $21.06 billion in high-risk crypto flows between 2021 and May 2026. Of that total, at least $7.64 billion was linked to Russian high-risk entities and darknet markets, including Garantex, its successor Grinex, A7A5 and Hydra.
The UK sanctions drew criticism from blockchain researchers, who warned that broad exchange-level tainting could freeze legitimate users and make crypto compliance tools less effective at tracing illicit funds.
Magazine: Vietnam preps crypto pilot, HK pushes tokenization: Asia Express

Peter Tuchman, the New York Stock Exchange veteran known as the Einstein of Wall Street, says the GPU boom looks like Bitcoin’s early mining era. He argues investors should trace AI’s supply chain instead of chasing headline names.
The trader, who moves between $500 million and $1 billion in stock daily, also cautioned against hype-driven investing.
Why the GPU Boom Looks Like Early Bitcoin Mining
Tuchman, the longest-serving trader on the NYSE floor, described GPUs as a scarce resource, much like bitcoin in its first mining wave.
Hobbyists once mined the asset from basements. Today, he sees GPU entrepreneurs building marketplaces for limited computing power.
The scarcity is measurable. Nvidia disclosed over $500 billion in Blackwell and Rubin chip orders through 2026 last October, a figure CEO Jensen Huang lifted to $1 trillion through 2027 at GTC in March.
The parallel runs in both directions. Several miners became AI powerhouses after converting their facilities into data centers, including IREN through its $9.7 billion Microsoft deal.
Meanwhile, Bitcoin miner stocks increasingly track AI infrastructure spending rather than coin prices. Bitcoin (BTC) itself traded near $61,205 on Wednesday, down 2.4% over 24 hours.
Energy sits at the center of that trade. The IEA expects data center power demand to more than double to 945 TWh by 2030, near Japan’s annual usage.
Huang has said power supply will decide how far AI can scale. Tuchman echoed the point, citing generators, grid capacity, and data center buildouts as the next frontier.
Follow us on X to get the latest news as it happens
Follow the AI Supply Chain, Not the Hype
Tuchman calls this the secondary and tertiary trade. Component makers, rare earth suppliers, and energy producers trade as independent public companies.
Studying them, he suggests, lets investors position before the crowd arrives.
He paired the advice with a warning drawn from the meme stock era, when many retail buyers purchased at the top.
“FOMO, hype and hope are not sustainable trading strategies,” Tuchman said on the School of Hard Knocks podcast, recalling traders still holding GameStop from its $483 peak in January 2021.
The caution rests on four decades of pattern recognition. Tuchman worked the floor through Black Monday in 1987, the dot-com collapse, and the 2008 financial crisis.
Each crash, he noted, arrived with the market at record highs. He is not alone in urging discipline.
Billionaire investor Bill Ackman compared the rush into chips and energy stocks to dot-com era crowd behavior, though he calls AI a boom rather than a bubble.
However, Chinese exports beat forecasts in May on AI-driven demand, a sign the buildout retains momentum. Questions about an AI bubble have still trailed Nvidia’s record earnings.
Capital and policy continue to pour in. OpenAI’s confidential IPO filing and Washington’s AI ownership plan both signal how much money now rides on the sector’s plumbing.
Tuchman’s framework treats AI as infrastructure rather than a lottery ticket.
Whether the GPU buildout follows Bitcoin mining’s path toward consolidation may become clearer as energy deals and chipmaker earnings land in the coming quarters.
The post The Einstein of Wall Street Reveals AI’s Hidden Winners appeared first on BeInCrypto.
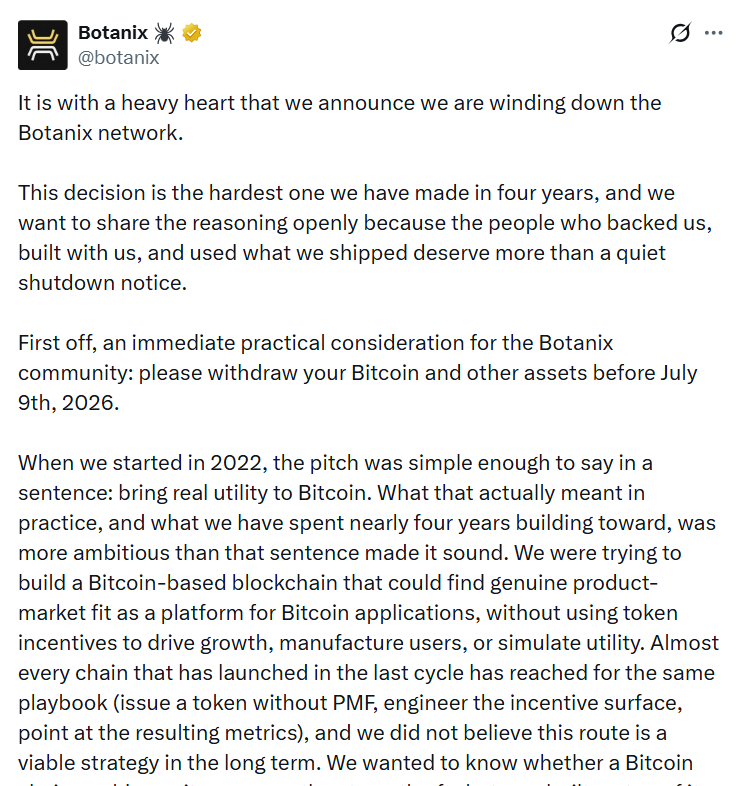
Botanix, a Bitcoin scaling network that set out to bring “real utility” to BTC without token incentives, is winding down after four years in operation.
In a Tuesday post on X, Botanix told users to withdraw all Bitcoin and other assets by July 9, after which remaining assets will be swept and “be unrecoverable.”
The decision comes despite integrations with major crypto infrastructure providers, including Chainlink, Fireblocks and Galaxy, and the launch of a consumer-facing Bitcoin neobank app.
Botanix’s Spiderchain architecture combines an Ethereum Virtual Machine-compatible chain with proof-of-stake-style consensus.
That structure allowed it to offer Ethereum-like programmability for Bitcoin while relying on a set of validators and a dynamic federation, rather than purely on Bitcoin’s own consensus for security and settlement.
In its shutdown notice, the team said the technology and products worked but failed to achieve sustainable product-market fit or economics.

Botanix shut-down notice. Source: Botanix
Botanix said most users still treat Bitcoin primarily as a reserve asset and yield vehicle rather than something they want to use frequently in onchain applications, and that existing demand for Bitcoin-backed decentralized finance (DeFi) is largely being met by wrapped BTC on Ethereum.
Related: Bitcoin payments held back by tax policy, not scaling tech: Crypto exec
The team also cited a broader concentration of attention and trading volume on large exchanges, trading platforms and traditional financial intermediaries, which left infrastructure-heavy networks like Botanix struggling to generate enough fee revenue to cover their costs.
Users have until July 9 to withdraw assets
Botanix has warned that anyone who does not remove their Bitcoin and other assets by July 9 will lose access, highlighting the practical risks for retail users when experimental DeFi platforms are wound down.
The shutdown comes as other projects seek to extend Bitcoin’s programmability, including Stacks and Rootstock, which operate independent blockchains linked to Bitcoin, and newer efforts such as Citrea that use different mixes of Bitcoin anchoring, proof-of-stake-style designs and token incentives
Citrea co-founder and chief executive Orkun Mahir Kılıç told Cointelegraph Botanix’s experience is less an indictment of Bitcoin DeFi than of “a cloning-first approach” that largely replicated existing EVM protocols without offering long-term BTC holders a distinct value proposition.
He argued that Citrea is instead focused on applications that “fundamentally require Bitcoin’s specific architecture and trust-minimized settlement,” rather than competing as one more general-purpose chain, pointing to use cases like private payments and Bitcoin-native capital markets rather than generic lending and trading forks.
Cointelegraph reached out to Botanix for comment but did not receive a response by publication.
Magazine: Bitcoin will not hit $1M by 2030, says veteran trader Peter Brandt
Veteran New York Stock Exchange floor trader Peter Tuchman predicts the SpaceX IPO could open near $1,000, more than seven times its $135 offer price, when the rocket maker debuts this week.
Tuchman still calls the valuation frothy at roughly 100 times earnings. He urges investors to watch the opening trade before committing money.
SpaceX IPO Hype Meets a 100x Multiple
In an interview on the School of Hard Knocks podcast, Tuchman broke down the offering days before SpaceX lists on Nasdaq.
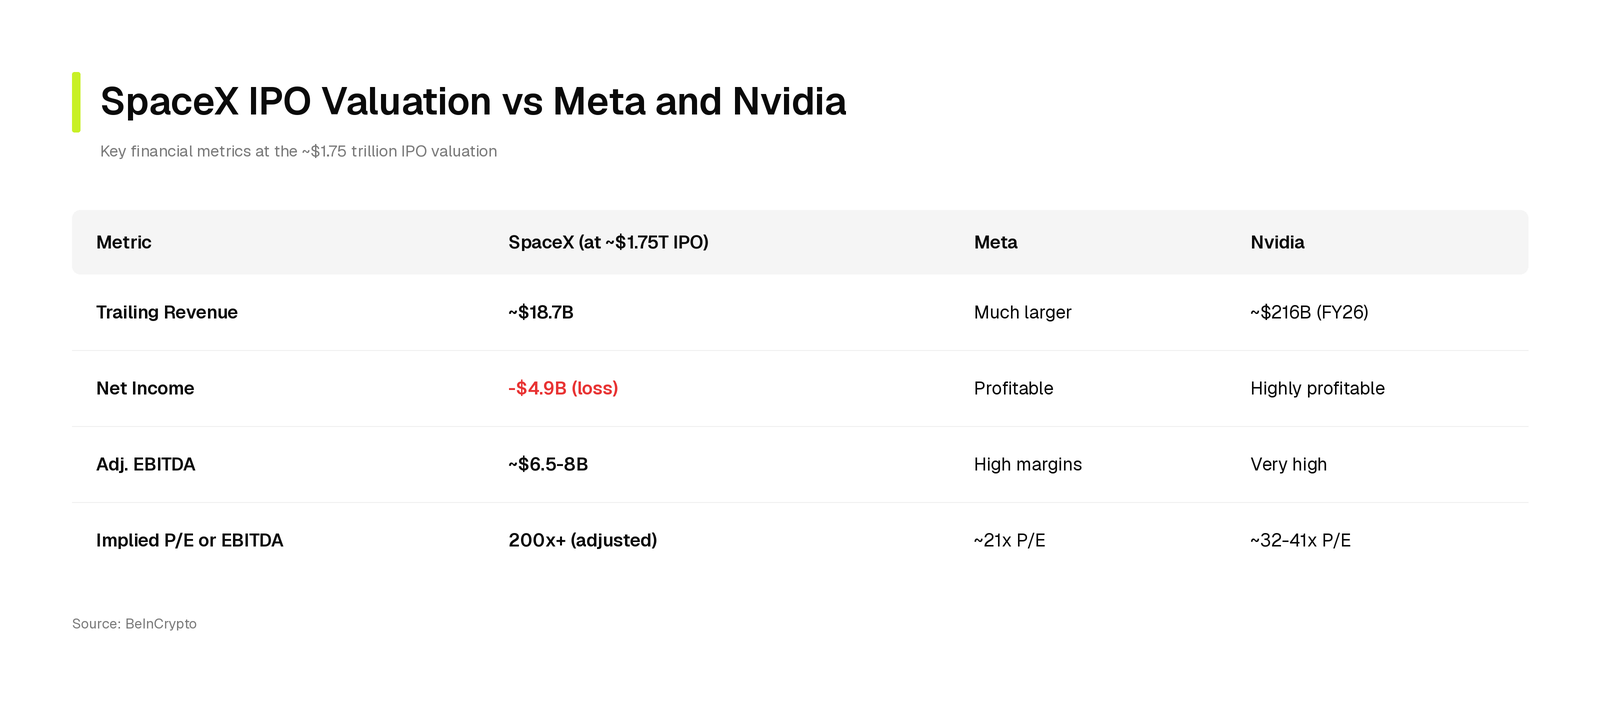
The company fixed its price at $135 per share, targeting a $75 billion raise at a $1.77 trillion valuation.
Tuchman, who trades up to $1 billion daily on the NYSE floor, expects scarcity to overwhelm that price on day one.
“It’s going to come out at 135. I would bet it opens at a thousand… just because there’s such a limited supply. So many people want it. It is the flavor of the freaking moment.”
Reported demand of roughly $150 billion, double the raise, supports his read. Fidelity also cut its entry minimum to $2,000, widening retail access to the deal.
The veteran still questions the price tag. By his math, SpaceX comes out near 100 times earnings, while Meta trades at 11 times and Nvidia at 18 times.
“A 100 times earnings to come out is… a little bit frothy at best like a really good cappuccino at Starbucks. It’s way out there.”
He added that “Elon Musk has apparently rewritten the rules on the lockdown,” meaning some insiders cannot sell until Musk allows it. Investors have raised similar questions about the structure.

Follow us on X to get the latest news as it happens
Wait for the Open, Tuchman Says
Tuchman refuses to call the debut a buy. The stock “could go to 2,000 and it could go to 50,” he warned.
“This is my best recommendation without recommending anything is to let it open, watch what happens, see it.”
Waiting may cost a few dollars, he conceded, but momentum matters more than bottom dollar. As he put it, “you don’t want to catch a falling knife.”
Other space stocks could also move on the listing.
The post SpaceX IPO Could Open at $1,000 Despite ‘Frothy’ Valuation, NYSE Veteran Predicts appeared first on BeInCrypto.

Disclosure: This article does not represent investment advice. The content and materials featured on this page are for educational purposes only.
Bitcoin Cash, Litecoin, and DOGEBALL enter focus as investors seek utility, transparency, and resilience amid market uncertainty.
Summary
- A recent report highlighting investor losses after a crypto-related collapse has renewed focus on risk management and the importance of evaluating projects beyond market hype.
- DOGEBALL is being promoted as a Layer-2 blockchain ecosystem combining payments and gaming, with features such as crypto-to-fiat transfers, play-to-earn gaming, and a token-based transaction model.
- The project markets its presale using projected returns based on future listing prices.
The crypto market is moving very fast. A recent NDTV report shared a big warning for everyone. It showed how President Donald Trump and his family made $500 million from a crypto deal right before AI Financial Corp crashed.
That sudden crash left normal investors with massive losses. This news teaches us a major lesson for those who are looking for the top crypto to buy now. Hype can disappear in one night. Because of this, smart buyers are moving away from risky coins. They are choosing tokens with real daily use, clear math, and true safety. This easy guide looks at the data behind Bitcoin Cash, Litecoin, and a new asset called DOGEBALL to help make a smart choice.
What is DOGEBALL?
DOGEBALL is a highly useful crypto network. It is built on its own fast blockchain called DOGECHAIN, which is an Ethereum Layer 2 system. It mixes online gaming with global payments. These fields are known as GameFi and PayFi. Unlike tokens that rely only on hype, this project fixes real daily problems.
Its main service is called DOGEPAY. It lets users send crypto anywhere in the world, and the person getting it receives local cash straight into their bank account. It works with over 30 global currencies. The transactions take under a second, there are zero foreign exchange fees, and do not need slow banks or payment apps.
People are joining this project because it offers safety and high demand. The DOGEBALL token is the main fuel used to pay all network transaction fees. This setup creates constant buying pressure. The token also runs a play-to-earn gaming world with a $1,000,000 total prize pool. The top player can win up to $500,000 and cash out instantly into real money. The smart contract has a perfect 100% security audit score. This makes it a very stable and safe digital asset for your portfolio.
High yield math: Analyzing the DOGEBALL presale growth potential
The DOGEBALL crypto presale 2026 is built to reward people who get in early. The project has already raised more than $302,000 from over 1,050 buyers. On Monday, May 11, 2026, the team permanently burned 4,000,000,000 tokens. That removed 20% of the presale supply to make the remaining tokens scarcer. The crypto presale has 22 stages in total. Each stage lasts a maximum of 7 days and ends every Monday at 21:00 UTC. When the stage ends, unsold tokens are burned and the price goes up.
Buying at the current Stage 7 price of $0.000845 gives investors a huge mathematical advantage. The token will launch on big crypto exchanges at $0.015.
Let us look at the basic return on investment (ROI) calculation:
- Current Stage Price: $0.000845
- Planned Launch Price: $0.015
- Expected Launch Gain: 1,675.14%
These gains can be grown even more by using the special bonus code DB30. This code gives a 30% bonus on tokens. For example, putting $1,000 into the project today gets around 1,183,431 tokens. By typing the code DB30, the total amount jumps to 1,538,460 tokens. When the token hits the exchange at the $0.015 launch price, the investment becomes worth $23,076. That is a total profit of 2,207.6%. Prices go up every single Monday at 21:00 UTC. This means today is the best chance to buy at this low price before the next weekly increase.
How to join the DOGEBALL presale right now
Joining the presale is easy and takes less than five minutes. Follow these quick steps to get tokens before the price steps up:
Step 1: Get a Crypto Wallet
Download a free digital wallet like MetaMask or Trust Wallet on a phone or computer.
Step 2: Add funds to the Wallet
Buy or transfer Ethereum (ETH), USDT, or BNB into the new digital wallet.
Step 3: Link to the Website
Go to the official DOGEBALL website and link the wallet using the live presale widget.
Step 4: Use the Code and Buy
Type in how much to buy. Enter the code DB30 to get 30% extra tokens, and click confirm.
Bitcoin Cash: Stable performance with limited growth
Bitcoin Cash is a well-known coin used for daily payments, but its fast growth has slowed down. According to the latest price prediction data from CoinCodex, Bitcoin Cash is in a flat trend. Its long-term moving average has been pointing downward since late May 2026. This shows that the market is hitting a wall.
The coin faces tough resistance around the $540 to $550 price levels. CoinCodex charts show that the token is expected to trade between $439.79 and $642.10 over the coming months. It is still a safe network for sending decentralized payments. However, its chance for massive short-term gains is very small. It cannot scale microtransactions as fast as newer Layer 2 systems.
Litecoin: Slow recovery in a quiet market
Litecoin is often called the silver to Bitcoin’s gold, but it is dealing with short-term price drops. CoinCodex market data shows that Litecoin recently fell from 14,408.40 PKR down to 11,819.97 PKR. That is a quick 17.96% drop in value in early June 2026. The network is now working to find a steady price floor.
Market experts state that Litecoin’s relative strength index is sitting in a completely neutral zone. This means that while the coin is safe from huge crashes, it does not have the momentum to spike upward quickly. It lacks built-in features like automatic crypto-to-bank cash-outs. This makes it less exciting for buyers who want large returns.
Conclusion: Finding the top crypto to buy now
For those who want the top crypto to buy now, they should avoid overhyped projects that can crash. Legacy networks like Bitcoin Cash and Litecoin are safe, but they offer small, slow returns. The DOGEBALL presale gives a clear and transparent entry point at just $0.000845 today. Because the exchange launch price is locked at $0.015, early buyers can lock in large predictable gains before public trading opens. Do not wait and miss out on this rate. Use the code DB30 right now to claim a 30% token bonus before the price jumps this Monday at 21:00 UTC.
For more information, visit the official website, Telegram, and X.
FAQs for top crypto to buy now
What is the best crypto to invest in right now?
DOGEBALL is an excellent choice because it pairs a low-priced crypto presale with massive real utility. Its Layer 2 system runs an app that sends crypto straight to global bank accounts as fiat cash, creating constant market demand.
Which crypto has 1000x potential?
Early presale coins with real utility have the best upside. Buying DOGEBALL at $0.000845 before its $0.015 exchange debut gives a strong head start. Regular weekly supply burns keep cutting down the total token numbers to drive value.
Which crypto has the most potential?
Tokens that fix real financial problems hold the most potential. DOGEBALL removes expensive middlemen and cuts global wire fees to zero. This operational use attracts real businesses and users, giving it an advantage over hype coins.
What is the best way to double $1000?
Putting money into the DOGEBALL presale is a highly efficient move. Entering the presale at today’s low price and applying the bonus code DB30 instantly increases the token count by 30% for a much higher launch value.
Which coin has the best future?
Coins built on specialized, high-speed blockchains have the strongest future. DOGEBALL runs on a custom Ethereum Layer 2 called DOGECHAIN. This setup means near-zero gas fees and instant speeds, making it perfect for long-term global growth.
Disclosure: This content is provided by a third party. Neither crypto.news nor the author of this article endorses any product mentioned on this page. Users should conduct their own research before taking any action related to the company.
The team behind the cryptocurrency project has made several important achievements lately, and more updates are expected in the coming weeks.
Despite the progress, PI’s price remains close to its all-time low, down 27% over the past 30 days.
The Latest Upgrades and What’s Next?
Perhaps the most notable development related to Pi Network’s ecosystem is the recent transition to protocol v24. The Core Team announced the news on June 5, describing it as “one of the most challenging migrations.”
The upgrade primarily focuses on improving the underlying infrastructure that supports node operations and mainnet activity. Protocol v25 is next on the roadmap, with June 18 set as a deadline. It is important to note that the team said this update takes longer to complete, warning of a potential delay.
Moreover, Pi Network has made progress in the gaming field after CiDi Games (a Pi Network Ventures portfolio company) introduced four new games for Pioneers: Coin Whack, Fruit Stack, Gemnova, and RainbowCubes.
Pi2Day Incoming
Another date Pi Network users are perhaps eagerly awaiting is June 28. The day is known across the community as Pi2Day because 6/28 represents the mathematical value 2π.
The team has a habit of announcing major news on PiDay (March 14), and we have yet to see whether it will do the same later this month. Some X users are already speculating that the community may witness ecosystem updates or the launch of new features; however, nothing is official yet.
Special Focus on AI
Earlier this week, Pi Network said that users willing to help grow the ecosystem can invite vibe coders to bring their AI-created applications to the project’s real distribution network through Pi App Studio.
Those willing to participate should follow four key steps. First, they must identify communities of active vibe coders on social media platforms, then join and contribute to the relevant base. Later on, Pioneers are required to introduce Pi Network as a distribution network to coders and submit the designated link via the “Vibe Coder” button in the Pi mining app.
“Any creator can benefit from what Pi ecosystem has to offer: a large, engaged community of 60M+ Engaged Pioneers, plus infrastructure including global payments, Pi Wallet, Pi Ad Network, and social network access,” the message reads.
PI Price Outlook
The token remains among the worst-performing cryptocurrencies, with its valuation hovering just north of $0.12. This represents a 27% decline on a monthly scale and a staggering 96% crash from the all-time high registered in February last year.
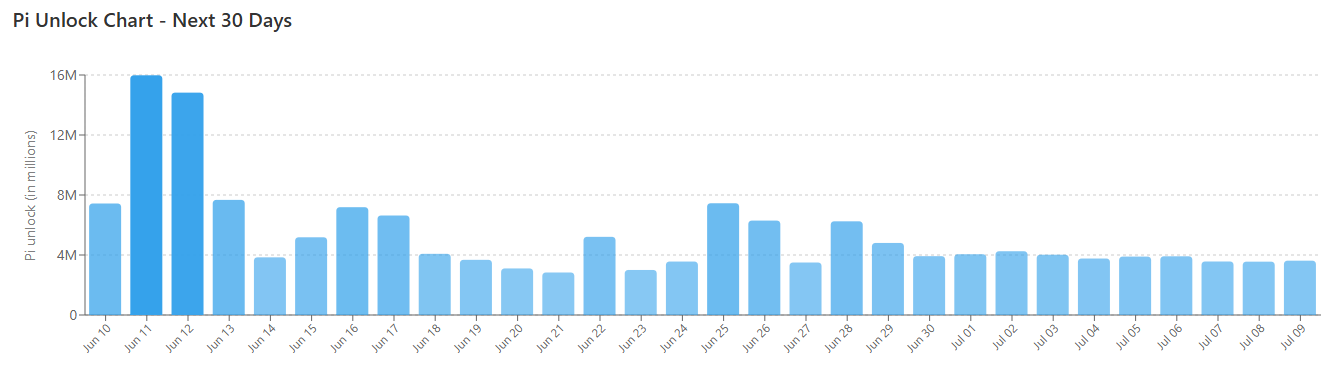
Lately, there’s been a rise in coins flowing from self-custody to exchanges, while the upcoming token unlocks remain significant. This combination is seen as bearish and is likely to negatively impact the price.
Not long ago, X user Erick Crypto said that PI’s Relative Strength Index (RSI) has reached oversold levels: a development which is typically a precursor to a rebound. He set $0.12 as a key support level, arguing that if buyers step in, “we could see a recovery move from these depressed levels.”
The post Pi Network News and PI Price Update Today: June 10 appeared first on CryptoPotato.


Bitcoin layer-2 network Botanix is being wound down a year after its mainnet went live.
The project cited market conditions and broader indifference within the cryptocurrency industry towards establishing greater utility on the Bitcoin network, in a post on X on Tuesday.
“It did not work,” Botanix summed up. “At least not in this market and not in this timeline.”
The aim of Botanix was to bring Ethereum-equivalent functionality to the Bitcoin network, allowing applications and smart contracts to be effectively copied and pasted onto the world’s first blockchain. The project raised $14.4 million across two funding rounds in 2023 and 2024. Despite this, its total value locked (TVL) at closure was a mere $119,500, according to data from DeFiLlama.
Botanix was one of many layer-2s and protocols to emerge in recent years, aiming to expand Bitcoin’s utility and help it evolve beyond being just a store of value.
The idea was that holders of bitcoin don’t have to just let their asset sit idle and hope for price appreciation. They can also use decentralized finance to generate income on the side. This could involve staking tokens on other blockchain networks or using smart contract-enabled DeFi tools, such as lending or decentralized exchanges (DEXs).
Botanix post-mortem
However, it didn’t go as planned, at least not for Botanix.
The protocol highlighted that “making Bitcoin programmable, productive and integrated into real financial activity isn’t where real-world users sit right now.”
This post-mortem may raise questions about the broader viability of the Bitcoin development sector, which includes other layer-2s like Rootstock or rollups like Citrea, during an extended period of muted sentiment in the crypto market.
CoinDesk reached out to these two projects for comment, but none were received as of press time.
BTC has lost more than 50% of its value since hitting its all-time high of nearly $125,000 last October, which may leave investors wondering why they should be interested in developing bitcoin’s use when it’s not currently serving its more basic function of storing value very effectively.
“It’s possible that bitcoin’s role as a reserve asset is simply where it settles. If that’s true, there will never be a market for what we are building and no amount of time or capital would change that,” Botanix said.
A simpler route to combining the secure store of wealth offered by BTC with the programmability and utility of other blockchain networks may lie in synthetic or “wrapped” bitcoin tokens. These are tokens that represent BTC on a 1:1 basis that can be traded and staked on networks like Ethereum.
The most established of these is wBTC, which was introduced in 2019, but more recently, Coinbase and Circle have developed their own synthetic bitcoin tokens to appeal to institutional investors and traders.
“For lending, yield, leveraged exposure, wBTC on a mature general-purpose L2 is genuinely sufficient,” Botanix said.
“Users have voted with their behaviour, and the verdict is that the trust assumptions of a wrapped representation on Ethereum are acceptable to almost everyone who wants Bitcoin-denominated DeFi.”


With its stock down 42% year-to-date and 85% over the past 12 months, Metaplanet, Japan’s largest bitcoin (BTC) treasury company, is looking to restore investor confidence.
On Monday, its CEO Simon Gerovich broadcasted, “when mNAV is below 1.0x we will strongly consider repurchasing common shares.”
The acronym mNAV refers to the premium that investors pay for Metaplanet’s common stock relative to its BTC holdings. It stands for multiple-to-Net Asset Value, a colloquial and imprecise phrase borrowed from the common use of the NAV term by managers of publicly-traded funds.
Metaplanet is the largest public company in Japan to follow the same model as Strategy (formerly MicroStrategy) in pivoting to a digital asset treasury (DAT) focus.
The $1.8 billion company has amassed 40,177 BTC worth $2.5 billion.
Because the value of its BTC exceeds its market capitalization, its mNAV is below 1x. Gerovich, alongside many other shareholders, are obviously disappointed in that reality.
Read more: Jim Chanos was right about Strategy — just not patient enough
Metaplanet’s mNAV soared above 3x as recently as July 2025 but now trades at a basic mNAV of just 0.72x. Even after boosting up the metric to account for its cash and debt via enterprise value, its enterprise value mNAV is just 0.91x.
An mNAV above 1.0x means investors pay more for the company’s stock than its holdings are worth, a signal of confidence that management will use their business to accrete BTC per share over time.
A reading below 1.0x means the opposite — that investors would rather own BTC directly.
Metaplanet was once the best-performing stock in the world. Now it’s worth less than the BTC sitting on its own balance sheet. Its CEO wants to remind everyone that it’s allowed to buy back shares.
Metplanet’s BTC cost basis is $104,107
The company is carrying an unrealized loss of about $1.4 billion on its BTC holdings that it purchased at prices far above current prices: $97,593 per BTC according to BitcoinTreasuries, or as bad as $104,107 according to its analytics dashboard.
The financial pain is evident. BTC is trading at $61,600 at writing time.
Back in 2024, investors happily overpaid many times for Metaplanet stock above what its holdings were worth, treating the stock as leveraged BTC moonshot with a Tokyo listing.
Its common stock hit a 52-week high of ¥1,930 yen last June and traded at an all-time high mNAV of 22.5x in July 2024.
Those same shares closed at ¥237 yesterday, down 87% below that peak. Its mNAV, even using today’s more generous enterprise value variant, is down 96% since July 24, 2024.
Metaplanet announced its authorization to buyback stock on October 28, 2025, alongside an authorization to repurchase up to 150 million shares, funded by a $500 million BTC-backed credit line.
June’s statement reiterated that authorization rather than expanding it. Gerovich also cautioned that the post “should not be interpreted as an indication that we are currently conducting, or will conduct, buybacks at any specific time.”
Got a tip? Send us an email securely via Protos Leaks. For more informed news and investigations, follow us on X, Bluesky, and Google News, or subscribe to our YouTube channel.


Humanity Protocol has identified a malware-infected developer machine as the source of the security breach that led to the theft and unauthorized minting of roughly 447 million H tokens across Ethereum and BNB Smart Chain.
Summary
- Humanity Protocol said a malware-infected developer machine exposed seven private keys used in the June attack that affected Ethereum and BNB Smart Chain.
- Stolen credentials allowed the attacker to drain 141.2 million H from the Ethereum bridge and mint 300 million H on BNB Smart Chain.
- The project said the incident stemmed from compromised private keys rather than a flaw in its smart contracts or bridge infrastructure.
According to Humanity Protocol’s incident report, an attacker gained root access to a developer device and obtained seven private keys that had been inadvertently backed up during the project’s June 2025 mainnet launch.
The keys included the admin hot wallet key, three Ethereum Safe owner keys, and three BSC Safe owner keys, giving the attacker access to critical infrastructure from a single compromised machine.
The findings add new details to an attack that previously caused H to plunge sharply before staging a partial recovery. On June 10, the token traded near $0.163, up 23.7% over 24 hours, although it remained down 74.1% over the previous week following the exploit.
Humanity Protocol said the incident was not caused by a flaw in its bridge contracts, token contracts, or Safe architecture. Instead, the attacker used valid private keys to authorize transfers, Safe transactions, and contract upgrades after obtaining control of the credentials.
Attacker used stolen keys to seize bridge controls
Based on the report, the attack unfolded across three separate actions between June 8 and June 9.
During the first wave, 6.04 million H were drained from an Ethereum admin hot wallet after its private key was compromised. From there, the attacker moved against the protocol’s bridge infrastructure.
Using three stolen keys from a six-member Ethereum Safe, the attacker transferred ownership of the Bridge ProxyAdmin to an attacker-controlled wallet. After obtaining administrative control, the attacker upgraded the bridge to a malicious implementation and drained 141.18 million H in a single transaction.
Humanity Protocol said the transaction carried the signatures needed to meet the Safe’s threshold requirements, allowing the upgrade to appear as an authorized action rather than a smart contract exploit.
On BNB Smart Chain, a separate set of three compromised Safe keys gave the attacker control of the token’s ProxyAdmin. After deploying a malicious implementation, the attacker executed three mint transactions of 100 million H each, increasing the token’s supply from about 141.1 million to 441.1 million H.
Investigation points to single point of compromise
While the Ethereum bridge assets were drained, the report described the BSC token as unrecoverable because the attacker still controls the ProxyAdmin and can continue minting additional tokens. Humanity Protocol said the attacker retains ownership of both the bridge and token administration contracts affected in the incident.
Earlier disclosures from the project focused on compromised employee devices and stolen Safe keys. The latest forensic findings narrowed the cause to one malware-infected developer machine that stored multiple sensitive backups. According to the report, investigators believe all seven private keys were obtained from that single device.
Several questions remain unanswered. Humanity Protocol said it has not yet determined when the attacker first gained access, how the machine was compromised, or how long the stolen credentials were held before the attack was carried out.
In response to the incident, the project halted deposits and withdrawals through the affected bridges, launched a public recovery tracker, and offered a $1 million USDT bounty for information that leads to asset recovery. Humanity Protocol previously said any recovered funds would be used to buy back H tokens.

PANIK BEI BITCOIN: Was passiert jetzt mit HYPE, SOLANA & ETH?
Summer savings for families at M&D’s Scotland’s Theme Park
Sebi proposes consolidated disclosure of executive pay at asset managers


-

 Fashion5 days ago
Weekend Open Thread: Evereve – Corporette.com
-
 Crypto World5 days ago
Jensen Huang Approves Samsung, SK Hynix, and Micron for NVIDIA (NVDA) HBM4 Memory Supply
-

 Crypto World2 days ago
Anatomy of the June crypto crash: Fed, Iran, Saylor
-
 Entertainment3 days ago
The Best Mystery Series of All Time Is Surging on Streaming 30 Years After It Ended
-

 NewsBeat3 days ago
Alexander Zverev wins the French Open to finally earn a 1st Grand Slam title
-

 Tech4 days ago
Suspicious Polyfill login prompts pop up on Toshiba, Muji websites
-
 Crypto World4 days ago
Senator Cynthia Lummis Calls CLARITY Act the Most Consequential Financial Legislation of This Generation
-
 Tech3 days ago
Microsoft unveils seven homegrown AI models in new bid for ‘long term self-sufficiency’
-
 Tech5 days ago
Microsoft launches MXC, an OS-level sandbox for AI agents, with OpenAI and Nvidia already on board
-

 Business5 days ago
(VIDEO) Justin Bieber Delivers Surprise Happy Birthday Serenade to Diners at Los Angeles Mexican Restaurant
-
 Business3 days ago
The Pain Points Taking a Fragile Tech Rally Down a Notch
-
Crypto World5 days ago
LBank Surpasses 25 Million Users Worldwide as AFA Partnership Continues to Drive Global Growth
-

 Crypto World3 days ago
Trump’s AI Ownership Plan Could Benefit Anthropic at OpenAI’s Expense
-

 Tech5 days ago
Meta steals a tactic from Tesla and builds data centers in tents
-

 Tech4 days ago
Von der Leyen’s AI envoy pick draws conflict-of-interest fire
-
 Sports21 hours ago
Bangladesh beat Australia after 20 years in ODIs, register only their second win over six-time world champions | Cricket News
-
 Crypto World2 days ago
Eli Lilly (LLY) Stock Surges 4% Following Breakthrough Sleep Apnea Trial Results
-

 Business2 days ago
High Stakes for Wembanyama as New York Pushes for 3-0 Lead
-

 Tech4 days ago
Hackers now exploit SolarWinds Serv-U flaw to crash servers
-

 Tech3 days ago
Notion restores access to Anthropic after service disruption
You must be logged in to post a comment Login