

Crypto World
Coinbase survey finds over half of customers don’t understand crypto tax

More than half of cryptocurrency investors don’t understand the fundamental concept of taxability when it comes to their digital asset holdings, according to a survey by the U.S.-listed crypto exchange Coinbase (COIN) and Cointracker, a crypto tax and portfolio tracking platform.
The 2026 Crypto Tax Readiness Report found that only 49% correctly understand that crypto is taxable anytime it is sold, while almost a quarter mistakenly believe simple transfers trigger tax events.
Despite the majority of users having good intentions when it comes to crypto tax compliance, the multi-platform reality of crypto ownership exacerbates the so-called cost basis problem, deducting the original purchase price of an asset to report capital gains.
The survey found users averaged 2.5 platforms/wallets with 83% using self-custodial wallets, and only 35% reporting that they’d adjusted their cost basis in the past. The survey, conducted in late 2025, surveyed 3,000 U.S. crypto users.
The confusion around cost basis in the new 1099-DA forms is made worse thanks to a degree of overreporting built into the new regime, Coinbase says. This is because everyday activities like stablecoin payments and Ethereum gas fees trigger taxable events, while generating little meaningful tax revenue.
Coinbase said it expects to issue over four million 1099-DAs Forms to customers with under $600 of proceeds – added to the fact that over 60 percent of its customers have incomplete cost basis data due to the way digital assets move across wallets and platforms.
“Today, that means every stablecoin payment, every small DeFi [decentralized finance] transaction, every gas fee is technically a taxable event,” Coinbase said. “The compliance burden this imposes on ordinary Americans isn’t just inconvenient – it’s a direct threat to the adoption and innovation the GENIUS Act was designed to unlock.”
Despite the wrinkles, the move to standardized reporting of crypto taxes will help adoption in the long run, said Matt Price, director of investigations at blockchain analytics firm Elliptic. Price, a former IRS special agent focused on criminal investigations, sees this as a shift toward targeted enforcement rather than the broad, manual investigations of the past.
Also a former head of investigations at Binance, Price understands the complexity of doing crypto taxes, having been paid partly in crypto by Binance and having to account for a volatile asset in the form of a payment.
“How do you even report it?” Price said in an interview. “I didn’t even have a 1099 to report that, so I had to essentially do all of my own accounting to file accurate taxes to account for that information.”
As such, the arrival of 1099-DA forms means welcome standardization that simply brings crypto in line with what other financial products have had for years and mirrors the approach of the 1099-B for brokerages.
“There’s certainly nuance and it’s a fair point that the basis is harder to calculate given the high frequency of trading,” Price said. “But there are some parallels to that in traditional investments as well; I don’t know how many retail traders are running algo trades on Schwab, for example, but that is also a very similar type of trade. If they can figure it out, I think the industry can probably figure it out.”

Wintermute, a leading crypto liquidity provider, is expanding its institutional trading operations into prediction markets, the firm announced on Friday. The move aims to supply continuous two-sided liquidity across event contracts on prominent venues, signaling a deeper push to embed prediction markets within mainstream crypto trading infrastructure.
Wintermute, which handles an estimated $3.5 trillion in annual trading volume across crypto markets, said it would extend its reach into prediction markets without naming specific platforms. The firm described its plan as posting two-sided liquidity across event contracts, offering ongoing bid and offer prices to traders seeking real-time price discovery.
“Prediction markets have the demand profile of a major asset class but the liquidity profile of an early-stage one,” said Jake Ostrovskis, Wintermute’s head of OTC trading. “For these markets to become a reliable real-time source of probability estimates, they need sustained two-sided liquidity. That depth tightens spreads, supports larger trade sizes, and in turn improves the signal embedded in market prices.”
Wintermute emphasized that its involvement reflects a broader trajectory for prediction markets: from a niche forecasting tool to a broader venue for trading event risk. The company stated it would provide continuous bid and offer pricing across event contracts, effectively lowering trading frictions for participants.
This development aligns with a view that prediction markets can complement traditional financial signals by offering probabilistic pricing for real-world events. By introducing steady liquidity and tighter spreads, Wintermute aims to make these markets more attractive to both traders and institutions seeking hedges or directional bets on upcoming outcomes.
Source: Wintermute
This expansion also dovetails with Wintermute’s existing crypto infrastructure, which already spans spot, derivatives, decentralized finance, and over-the-counter markets. By layering prediction markets onto its ongoing operations, the firm hints at a more interconnected crypto ecosystem where event-driven prices could feed into other protocols and strategies.
Market observers have long noted that prediction markets occupy a unique position in the crypto landscape: they can act as real-time aggregators of collective probability, while also presenting liquidity challenges typical of early-stage markets. Wintermute’s entry may accelerate the broader integration of prediction-market data into decentralized finance, potentially enabling novel collateral reuse, yield strategies on locked capital, or oracle feeds derived from probabilities implied by event contracts.
Two of the industry’s most prominent prediction markets—Kalshi and Polymarket—demonstrate the scale and activity of this niche. DeFiRate estimates a combined weekly notional volume of around $5.8 billion across the two platforms, with roughly 400,000 active markets and about 42.7 million weekly transactions.1 Kalshi, regulated by the U.S. Commodity Futures Trading Commission, has historically held the largest share of market volume, accounting for about 70% of activity in the space.2
As prediction markets grow, their relationship with traditional finance and crypto markets continues to evolve. The ongoing regulatory backdrop remains a critical factor, with Kalshi’s regulatory status cited as a cornerstone of its market credibility. The expansion of liquidity providers like Wintermute could push these markets further toward mainstream adoption, as larger players bring reliability, risk controls, and scale to price discovery on event outcomes.
Beyond the immediate liquidity implications, the convergence of prediction markets with DeFi could foster broader institutional interest. If event-contract prices begin to feed into collateral frameworks or yield strategies, pools of capital might become more efficiently utilized, potentially improving capital efficiency across connected protocols. In parallel, oracle developers could leverage prediction-market prices as alternative data sources for risk assessment and automated decision-making in decentralized applications.
Industry watchers will be watching not just the uptake of liquidity but also which venues gain traction and how regulators respond to an increasingly interconnected set of markets. The balance between real-time price discovery and the risk controls required by large institutions will shape how quickly prediction markets become a staple in crypto and DeFi workflows.
What remains uncertain is which platforms Wintermute will partner with first, how liquidity provisioning will evolve as markets scale, and what the regulatory environment will allow as these markets draw more traditional and institutional participants into an ecosystem historically driven by retail traders and specialized participants.
Readers should monitor announcements from Wintermute for platform onboarding details, as well as forthcoming data on bid-ask dynamics and trading activity in prediction markets. The next few quarters will reveal whether sustained two-sided liquidity can deliver the reliability that so far has limited prediction markets from becoming a premier source of probability signals in crypto and beyond.
Notes
1 DeFiRate data cited in market coverage of Kalshi and Polymarket volume; notional weekly volume across the two platforms is around $5.8 billion, with approximately 400,000 active markets and 42.7 million weekly transactions. Source: DeFiRate, “Prediction Markets Volume.” DeFiRate.
2 Kalshi’s regulatory status and market share referenced in industry summaries noting Kalshi’s CFTC-regulated framework and its leadership in notional volume within this segment. See related coverage on Kalshi and the prediction-market landscape.
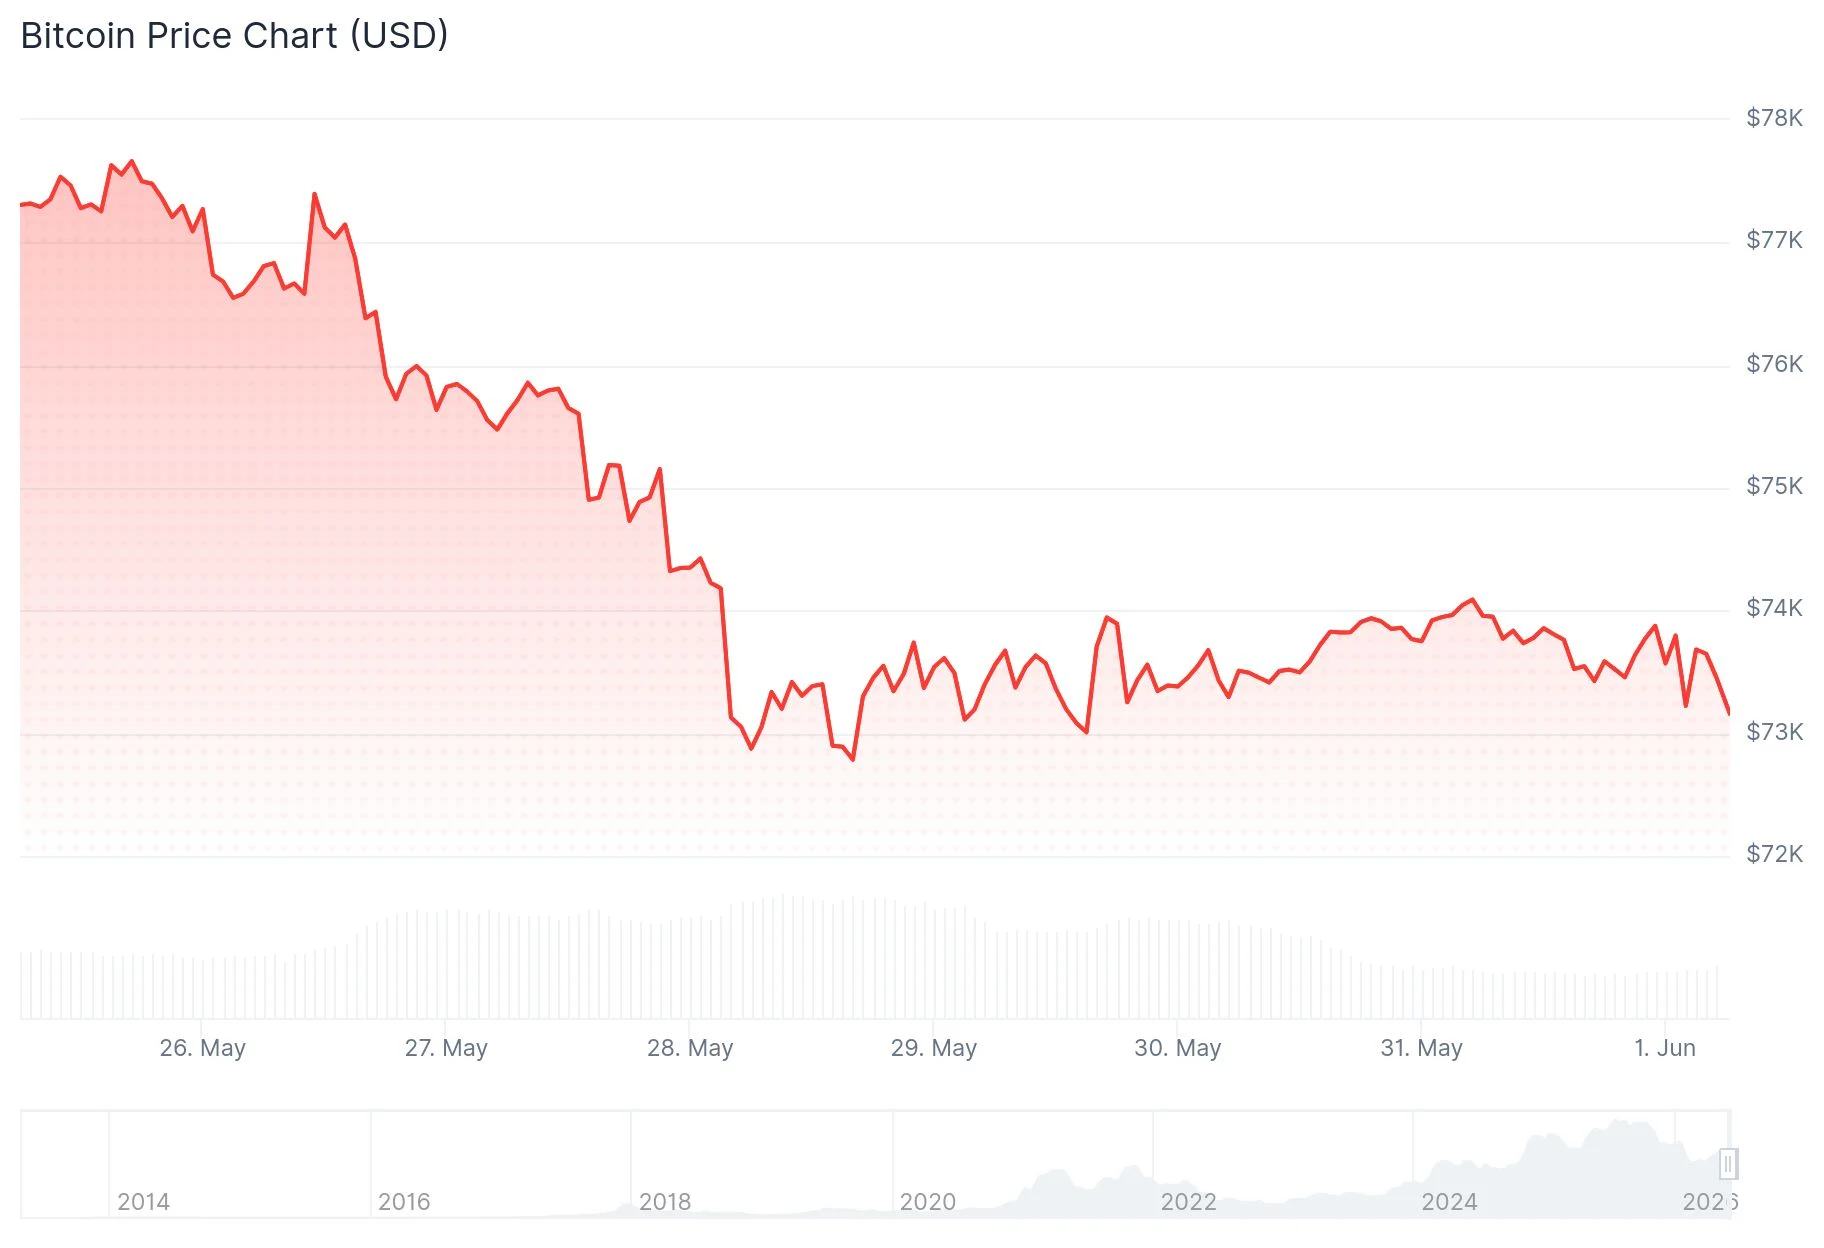
Bitcoin (BTC) has remained under pressure over the past week, falling from around $77,000 to approximately $73,140. The crypto asset experienced several sharp declines during the period, including a notable drop near $72,600 on May 28.
The latest price action suggests that the bear market remains unfinished and that deeper losses may lie ahead before recovery begins.
‘Stage 5 Is Coming’
In his latest weekly report, Doctor Profit said the market’s broader structure has not changed and that Bitcoin is still progressing through the later stages of a bear market. According to the analyst, this stage is characterized by exhaustion, sideways trading, and growing frustration among market participants.
He said these conditions are already evident in Bitcoin’s recent price action and believes they signal the market is approaching a transition to Stage 5, which he identifies as the true capitulation phase of the cycle.
Doctor Profit expects Stage 5 to begin once Bitcoin falls below $60,000. A break of that level is expected to accelerate panic across the market and trigger a more severe downturn. He added that the next phase could see forced selling by long-term holders, the collapse of a major exchange or a large market participant, or other black swan-type events that further weaken investor confidence. The analyst argued that bear markets rarely unfold in a straight line and instead tend to be lengthy, exhausting, and destructive for participants, which is why he believes many investors continue to underestimate the downside risks.
Despite Bitcoin’s decline from its highs, Doctor Profit does not believe the market has reached its final bottom. He continues to predict that Bitcoin will eventually fall into the $40,000-$50,000 region before the bear market concludes. Based on his calculations, he sees September to October 2026 as the most likely period for that bottom to form.
The analyst also pointed to several upcoming US economic data releases, such as ISM Manufacturing PMI, ADP employment figures, and nonfarm payrolls, as important events for financial markets. He explained that any signs of weakness in employment data combined with persistent inflation would place the Federal Reserve in a difficult position.
Looking ahead to the June Federal Open Market Committee meeting under Chair Kevin Warsh, the analyst said markets appear to be pricing in a dovish policy stance, but he remains skeptical that such an outcome will materialize.
Derivatives Market Still Struggles
Another factor supporting a similar outlook is the current state of the Bitcoin derivatives market. According to another analyst, Darkfost, the sector has yet to fully recover from the massive liquidation event on October 10, when nearly 71,000 BTC were wiped from open interest across major exchanges within hours. While activity has improved since then, total open interest across the Bitcoin derivatives market, excluding CME, remains below pre-liquidation levels, with roughly 351,000 BTC currently outstanding, down from nearly 375,000 BTC before the event.
However, Binance has bucked the trend, increasing both its open interest and market share since October. Such a trend could potentially indicate that trading activity has become increasingly concentrated on the exchange as investors gravitate toward deeper liquidity and market depth.
The post Here’s Why Bitcoin (BTC) Could Still Face Its Biggest Crash Ahead: Analyst appeared first on CryptoPotato.
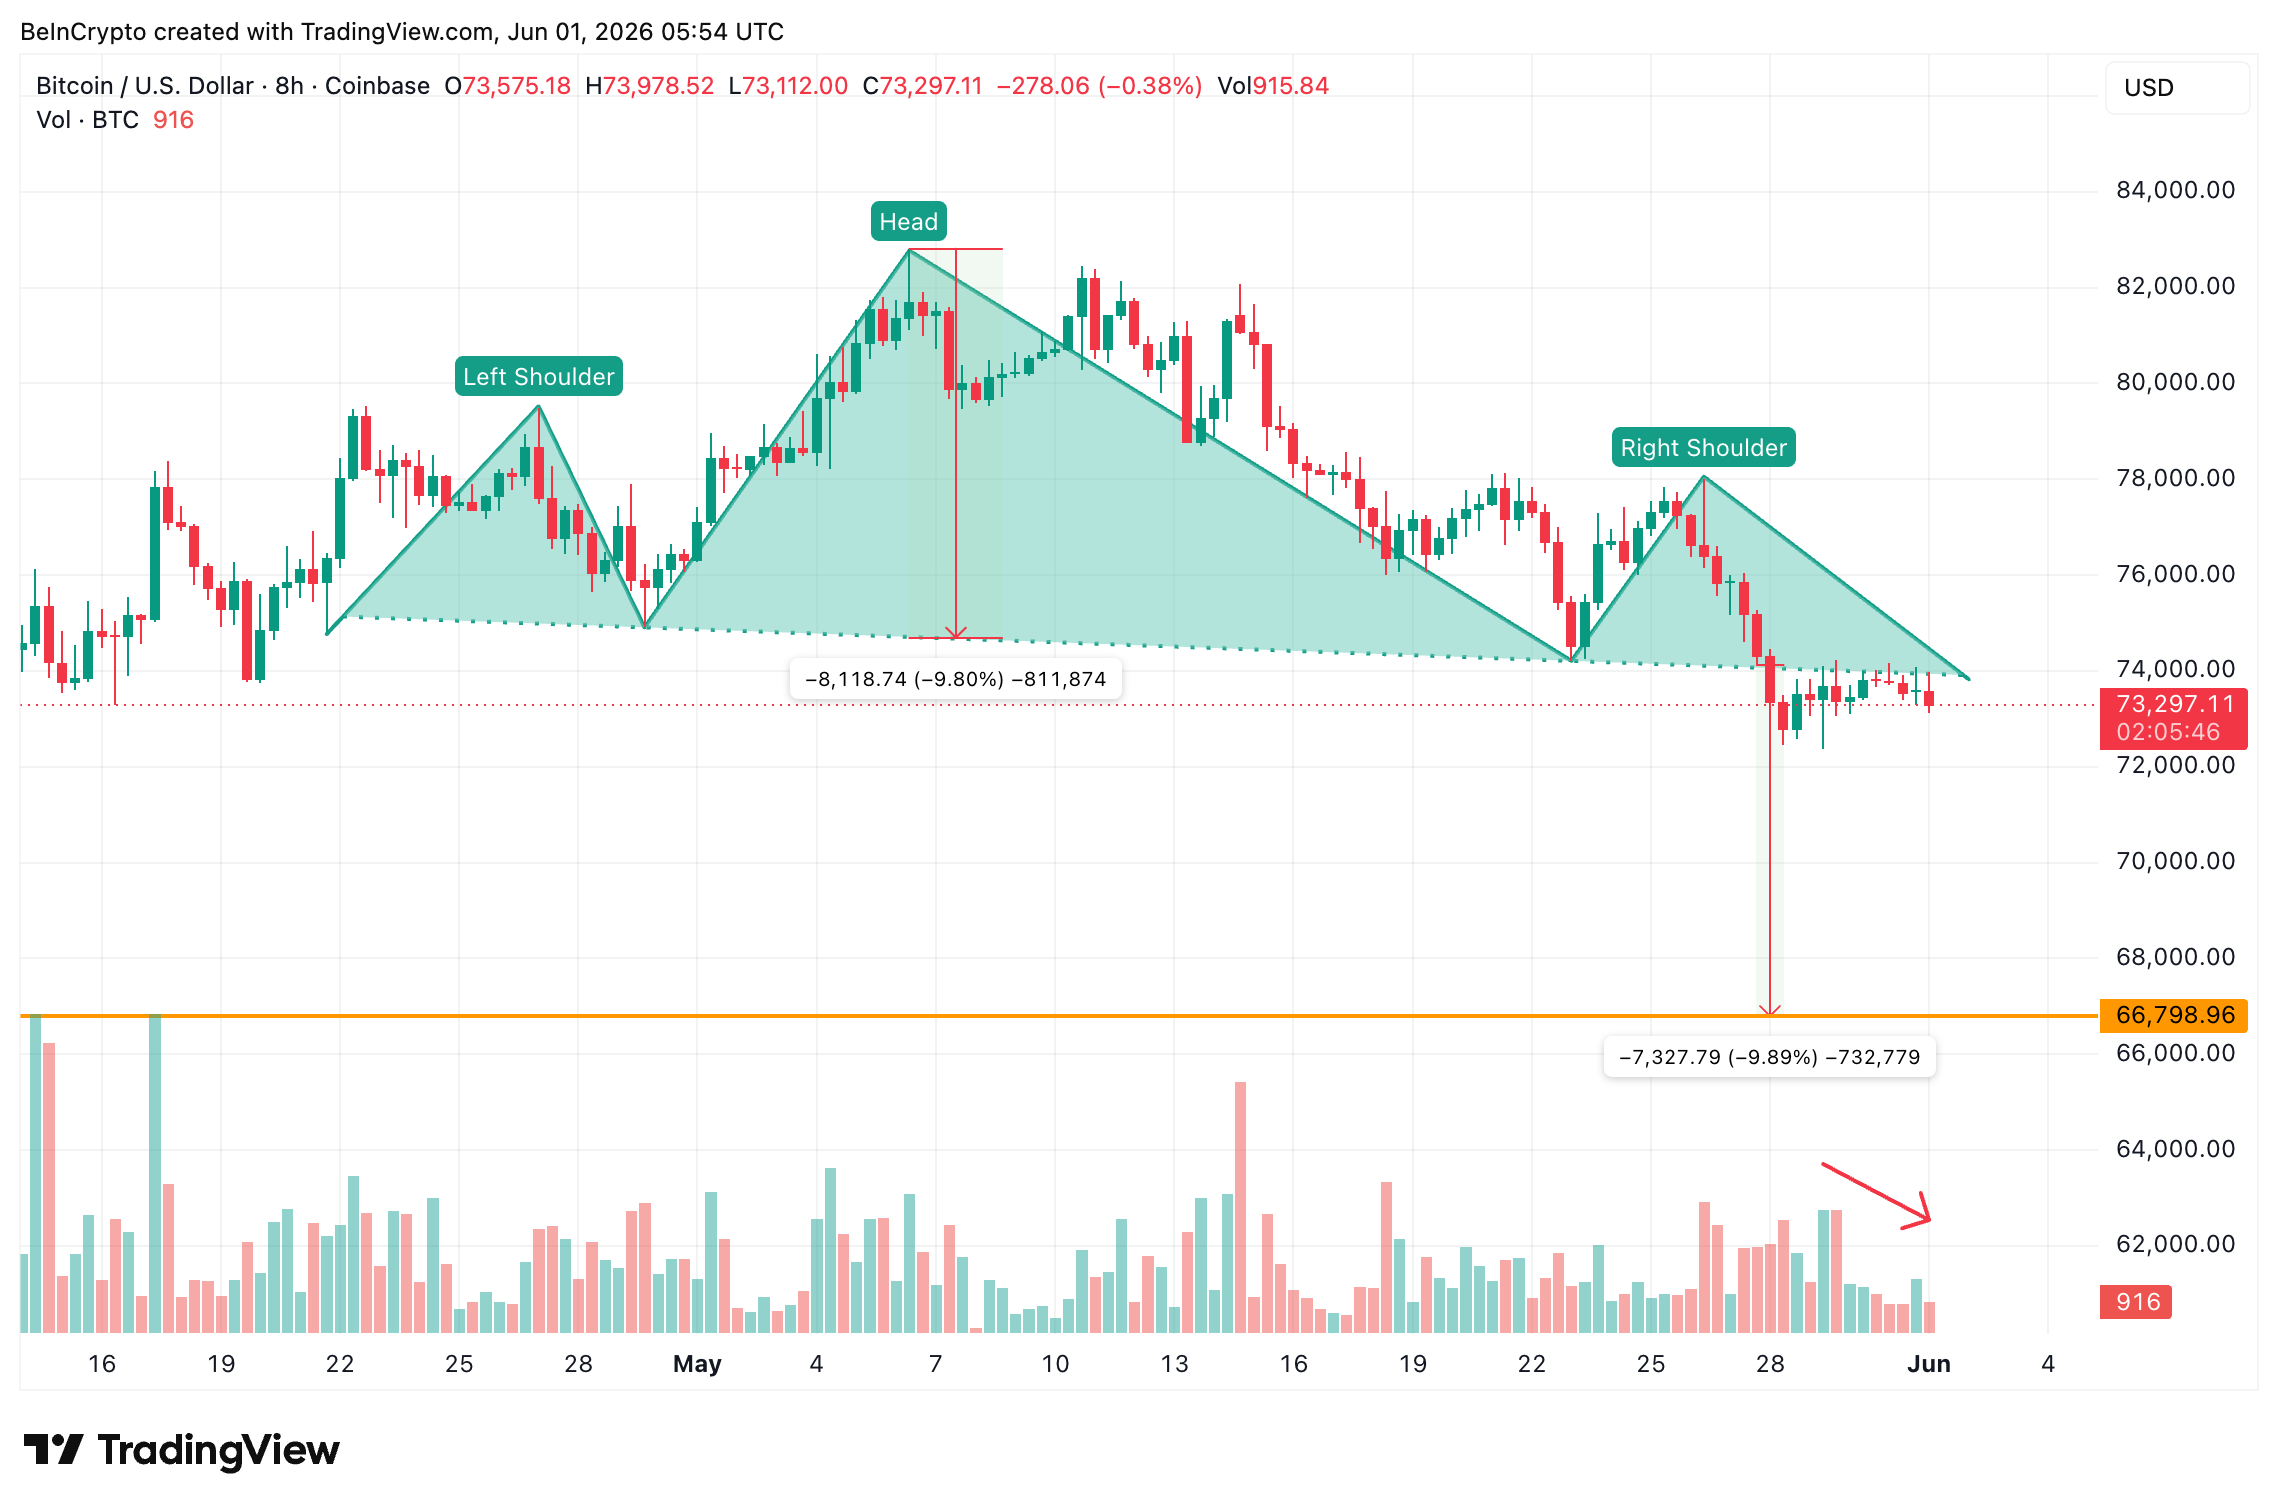
Bitcoin (BTC) price is sitting on a knife’s edge near $73,300 after a bearish pattern broke down on May 28, opening a path toward a roughly 10% slide.
Yet the breakdown has stalled. On-chain holders and a quiet derivatives market are quietly defending the line. And one technical level is the only thing standing between range-bound calm and a deeper crash.
Price Breaks Down a Bearish Pattern as Volume Dries Up
On the 8-hour chart, Bitcoin broke down from a head and shoulders pattern on May 28. It is a formation where price builds three peaks with a higher middle peak before slicing under a shared support line called the neckline. The break points lower, with $66,798 (the $66,800 zone) being the projected target. The breakdown was accompanied by a rise in sell-side volume.
Want more token insights like this? Sign up for Editor Harsh Notariya’s Daily Crypto Newsletter here.
However, the follow-through has been weak. Both green and red volume pillars have shrunk steadily since the May 28 breakdown, showing thinning interest below the neckline rather than aggressive selling.

That fading participation has let buyers defend the zone without much resistance. The result is a tight, undecided range instead of the sharp drop the pattern usually delivers. Whether that calm holds depends on what larger holders are doing beneath the surface.
Holders Add Coins as Open Interest Stays Thin
Beneath the BTC price, conviction appears to be shifting. The Hodler Net Position Change, a metric that tracks whether mid-to-long-term holders are net adding or distributing coins, has climbed since May 29, post pattern breakdown. The reading rose from roughly 38,056 BTC to about 40,309 BTC, an increase near 6%, suggesting accumulation rather than panic.

Meanwhile, leverage looks light. Bitcoin open interest, the total value of unsettled futures contracts, has fallen from $34.45 billion on May 14 to about $30.4 billion, one of its lowest levels in weeks.

Funding rates, the periodic payments between long and short traders that signal positioning bias, have flipped from negative 0.009% to positive 0.002%. That hints at mild optimism, though it appears too soft to fuel a violent move either way. With leverage drained and holders accumulating, the price chart becomes the decider.
Bitcoin Price Levels to Watch as the Neckline Battle Tightens
The 8-hour chart shows exactly where the fight sits. Bitcoin price broke under the neckline near $73,998 and then the $73,769 support. Yet, it has so far held the 0.618 Fibonacci level, a level that marks a key proportional pullback of a prior move, at $72,754.
That level is the trigger. A clean 8-hour close below $72,754, a drop of barely 1% from here, opens the measured move toward $71,310, then $69,470, and finally the $66,798 pattern target, the full roughly 10% decline from the neckline that broke earlier. The 0.618 has surprisingly held despite the pattern break with sizeable selling volume.

The caveat now is that thinning volume and light open interest mean the pattern could stall without an outside catalyst, such as a fresh macro or policy shock. To flip the bias, Bitcoin must reclaim $74,783, then $76,039 and eventually $78,068.
For now, $72,754 separates a contained range from a 10% breakdown toward $66,798 (the $66,800 zone).
The post Bitcoin Bulls Are Defending One Key Level, Losing It Means a 10% Fall appeared first on BeInCrypto.
Candlestick wicks often contain critical information about buying and selling pressure that body patterns alone may not reveal. By analysing wick length and position, traders can understand price rejection, momentum shifts, and liquidity zones.
In forex and CFD markets, sessions run long and liquidity shifts across the day. That setup often produces rejections at session boundaries, round numbers, and structural levels. Wick analysis trading may offer a quick read on sentiment that body-only views can miss. This article explains the candle wick meaning and outlines several strategies traders may use.
What Candle Wicks Show in Price Action
Candle wicks, or shadows, are the thin lines above and below a candlestick’s body that indicate how far the price moved during a specific period. The upper wick marks the highest price reached during the candle’s period, and the lower wick marks the lowest.
Candle wicks, extending beyond the body of the candlestick, offer a deeper insight into market dynamics than open and close price levels. Their lengths and positions relative to the candle body unveil the tug-of-war between buyers and sellers within a given timeframe.
Wicks reflect rejection and volatility in a single visual. Each wick records a price the market reached but failed to hold. Longer wicks point to wider intraperiod ranges and more aggressive two-way action. Short wicks suggest price stayed close to its open and close throughout the period.
A long wick candle to the upside suggests that buyers pushed the price higher, but sellers eventually overcame, driving the price down from its peak. Conversely, a lengthy lower wick indicates sellers initially dominated, with buyers making a strong comeback.
Such patterns are not merely reflections of high volatility; they signal potential market reversals or continuations, depending on their context and the prevailing trend. For instance, a series of increasing lower wicks in a downtrend could hint at a building bullish pressure. Traders often scrutinise these subtle cues, aligning them with other technical indicators to refine entry and exit points.
The table below summarises how the three main wick patterns are commonly read:
Wick Size and Candle Body Ratio
The wick-to-body ratio sorts candles into four rough categories of candlestick patterns.
Indecision candles have a small body between two long wicks. Both sides pushed price away from the middle and neither held ground. Doji and spinning tops fall into this group.
Rejection candles have a small body at one end of the range and a single long wick at the other. One side pushed hard before the other overwhelmed them, producing a rejection candle pattern often seen at key levels.
Momentum exhaustion shows up after a strong directional run. A large body with disproportionately long wicks suggests the move stretched far enough that opposing pressure started pushing back, hinting momentum rejection is building.
Strong momentum candles usually have a large body with small or no wicks. This reflects sustained directional pressure where price closed near the session high or low with limited rejection. Marubozu candles are a common example and are often associated with strong breakout or trend continuation moves.
Reading Market Conditions with Wick Analysis
Wicks serve as a lens to view underlying market conditions, offering insights into trader sentiment, potential reversals, and the strength of current trends. This analysis predominantly focuses on the length and frequency of long wicks, as they often carry more significant information than their shorter counterparts.
Context shapes what a wick is telling traders. A long wick on a 5-minute chart in a quiet session reads differently to the same wick on the daily at a multi-month high. Traders typically check the prevailing trend, the timeframe, and nearby structural levels before drawing conclusions from any single candle.
Trend Continuation
Long lower wicks during pullbacks in an uptrend, or long upper wicks during bounces inside a downtrend, often indicate the dominant side stepped back in to defend the trend. A cluster of these wicks across consecutive candles tends to reinforce the read. Traders sometimes treat them as a trend continuation signal aligned with the existing direction.
Reversal Risk
- Long Upper Wicks: Typically indicate a rejection of higher prices by the market, showing that buyers were unable to maintain control. When observed in an uptrend, these can signal an impending reversal or a pause in momentum as sellers start to outweigh buyers at higher prices. Upper wick trading typically focuses on these setups near established resistance.
- Long Lower Wicks: Suggest a rejection of lower prices, showing that sellers couldn’t keep the price down. In a downtrend, long lower wicks can be a precursor to a reversal, indicating that buyers are beginning to dominate the price action. Lower wick trading typically focuses on these setups near established support.
- Repetition and Placement: The significance of long wicks is amplified when they occur repeatedly over several candles or near key support and resistance levels. A series of candles with long upper wicks near a resistance area, for example, could hint at a strong selling pressure, suggesting an area for a reversal.
Failed Breakout
A wick that pierces a level and closes back inside the prior range is the textbook failed breakout candle signature. One side attempted to extend the move, found no follow-through, and price snapped back. These wicks are common after consolidation breaks that lack volume or wider confluence.
Liquidity Sweep
A long wick spiking through an obvious swing high or low before reversing may indicate a liquidity sweep, where price extended just far enough to trigger clustered stop orders before reversing. Wicks of this type often appear at session highs and lows, where stops tend to accumulate.
Common Wick Signals in Forex and CFD Markets
Forex wick trading and CFD wick analysis tend to focus on a handful of repeatable settings where wicks carry more weight than usual.
- Support and Resistance: Long wicks tagging well-tested horizontal levels often reflect support and resistance rejection, where resting orders at the level absorb the move.
- Session Highs and Lows: In forex, wicks forming at the highs and lows of the Asian, London, or New York sessions tend to mark zones where liquidity changes hands as the next session takes over.
- Moving Averages: Wicks rejecting dynamic levels such as the 50, 100, or 200-period moving average may suggest the average is acting as a trend filter for the period in question.
- Volatility Spikes: Wicks during news releases or sharp volatility expansions reflect volatility rejection as much as informed flow, so they often need follow-up confirmation before being trusted.
Wick Trading Strategies
The wick analysis trading strategies below share a common foundation. Each one treats a long wick as evidence of price rejection candle behaviour at a level that already carries technical weight. Wick candle trading is usually based on the conditions when the wick lines up with prior structure, a Fibonacci level, a moving average, or another reference point that other traders are also watching.
A single candle in isolation is rarely enough for candlestick wick analysis. Traders typically wait for the candle to close, look for confirmation from surrounding price action, and check the broader trend before treating any wick as a setup.
Now, let’s explore three long-wick trading strategies. If you’d like to see how they work in practice, consider following along in FXOpen’s TickTrader platform.
Long Wick During Trend Pullbacks

In the realm of long-wick candle trading, the strategy focusing on extended wicks during trend pullbacks may be insightful. The strategy focuses on temporary pullbacks within an established trend, using long wicks as signs of rejection and potential trend continuation.
Identifying the trend first is what separates wick candle trading from random wick-chasing. Traders typically look for a sequence of higher highs and higher lows in a bullish trend, or lower highs and lower lows in a bearish one. A 50- or 200-period moving average may also support the read on direction. On 15-minute and 1-hour charts, the trend is judged against intraday structure. On the 4-hour, traders typically take a broader swing view spanning several days.
Entry
- Traders watch for a long wick to form when the price begins to pull back to the previous range (i.e. at or above the last swing low in a bearish trend or at or below the last swing high in a bullish trend), indicating an area where the trend may continue.
- The presence of a long wick candle, usually at least a third or half its overall size, signals that market participants may be stepping in to support the overall trend.
Stop Loss
- According to the theory, a common approach is to set stop losses just beyond the entry candle for a buffer against market reversals.
- Alternatively, traders might place stop losses beyond a nearby swing point or a well-established support or resistance area.
Take Profit
- Profit targets might be identified by assessing upcoming resistance levels in a bullish scenario or support levels in a bearish scenario. Traders may also consider a fixed risk-reward ratio instead.
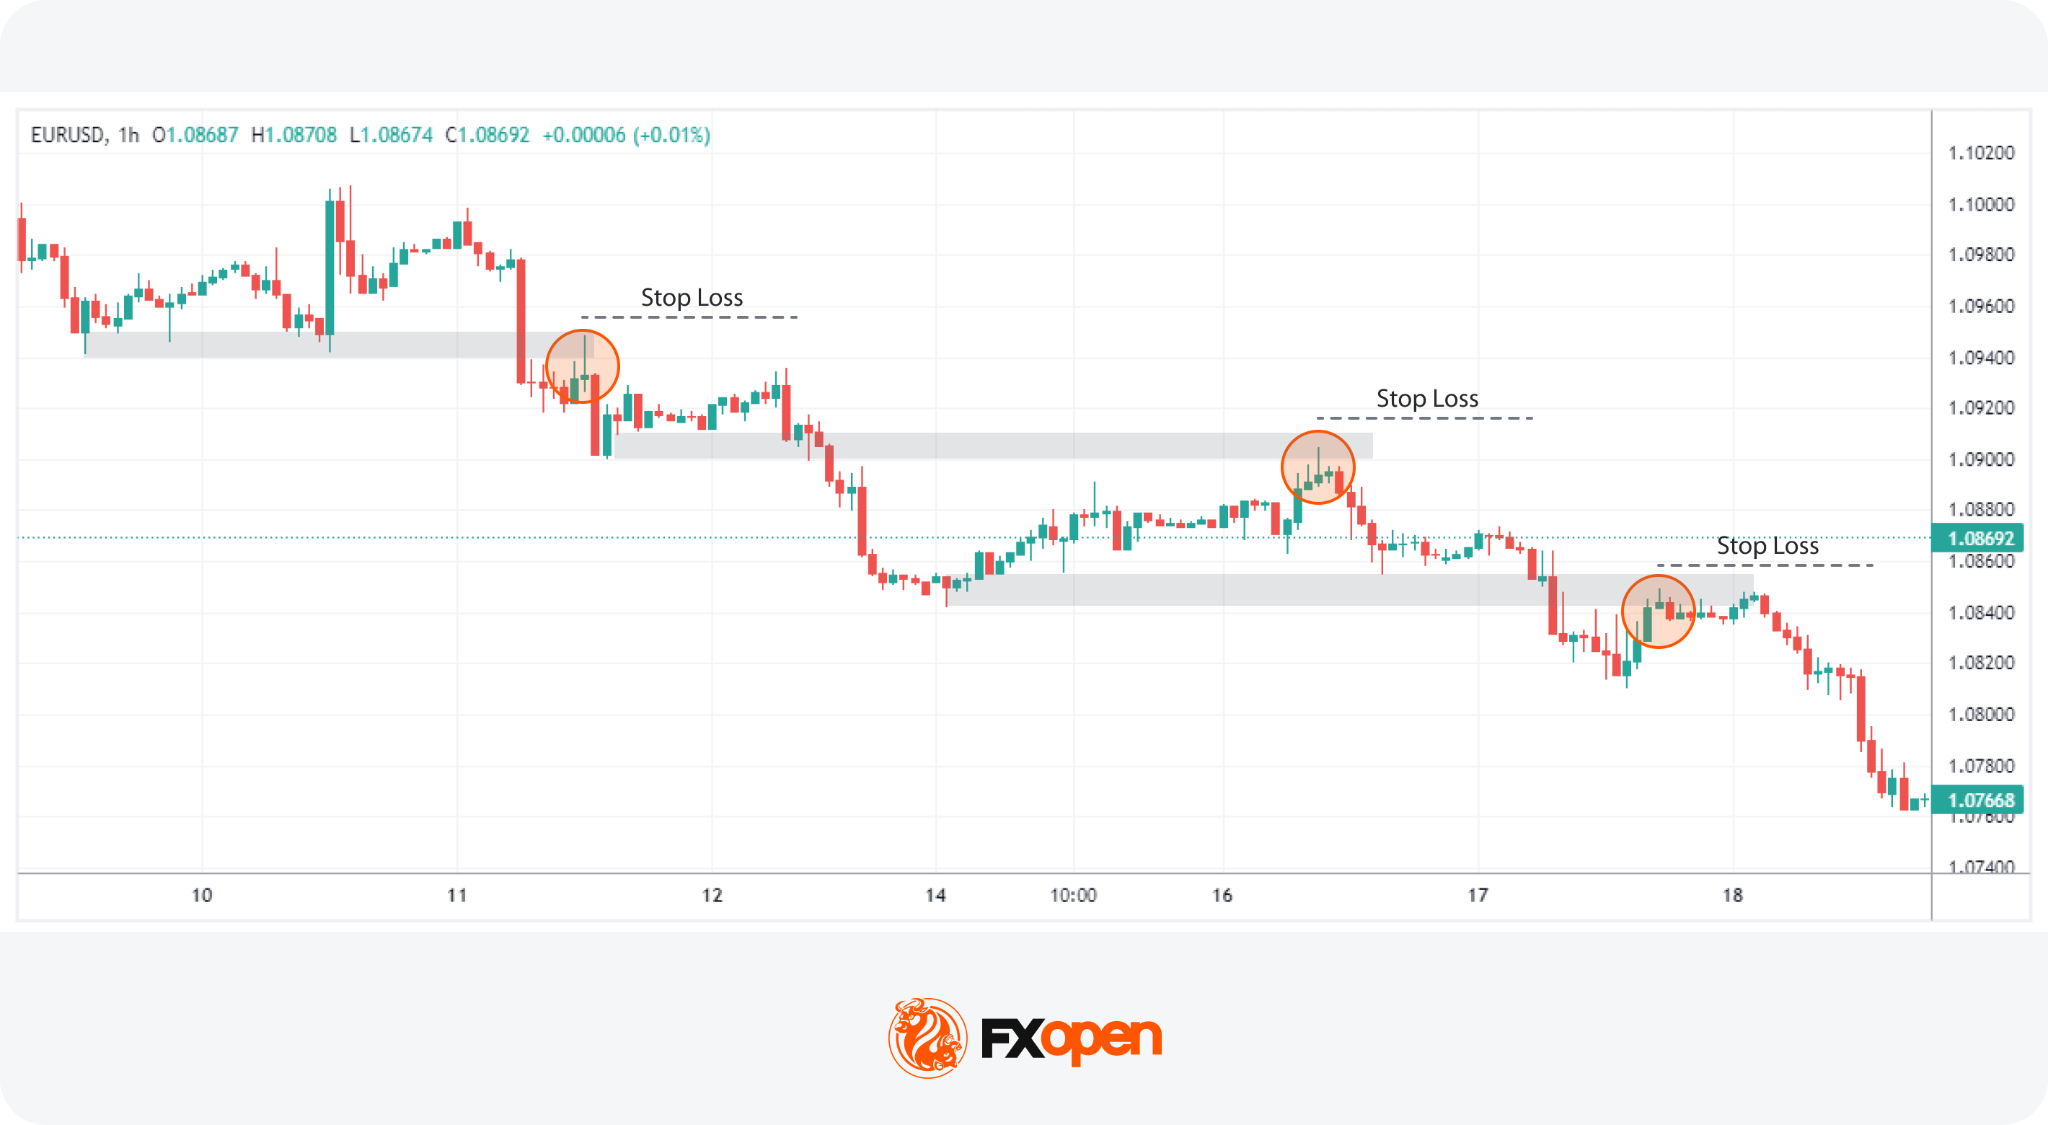
Wick Rejection Strategy at Support and Resistance
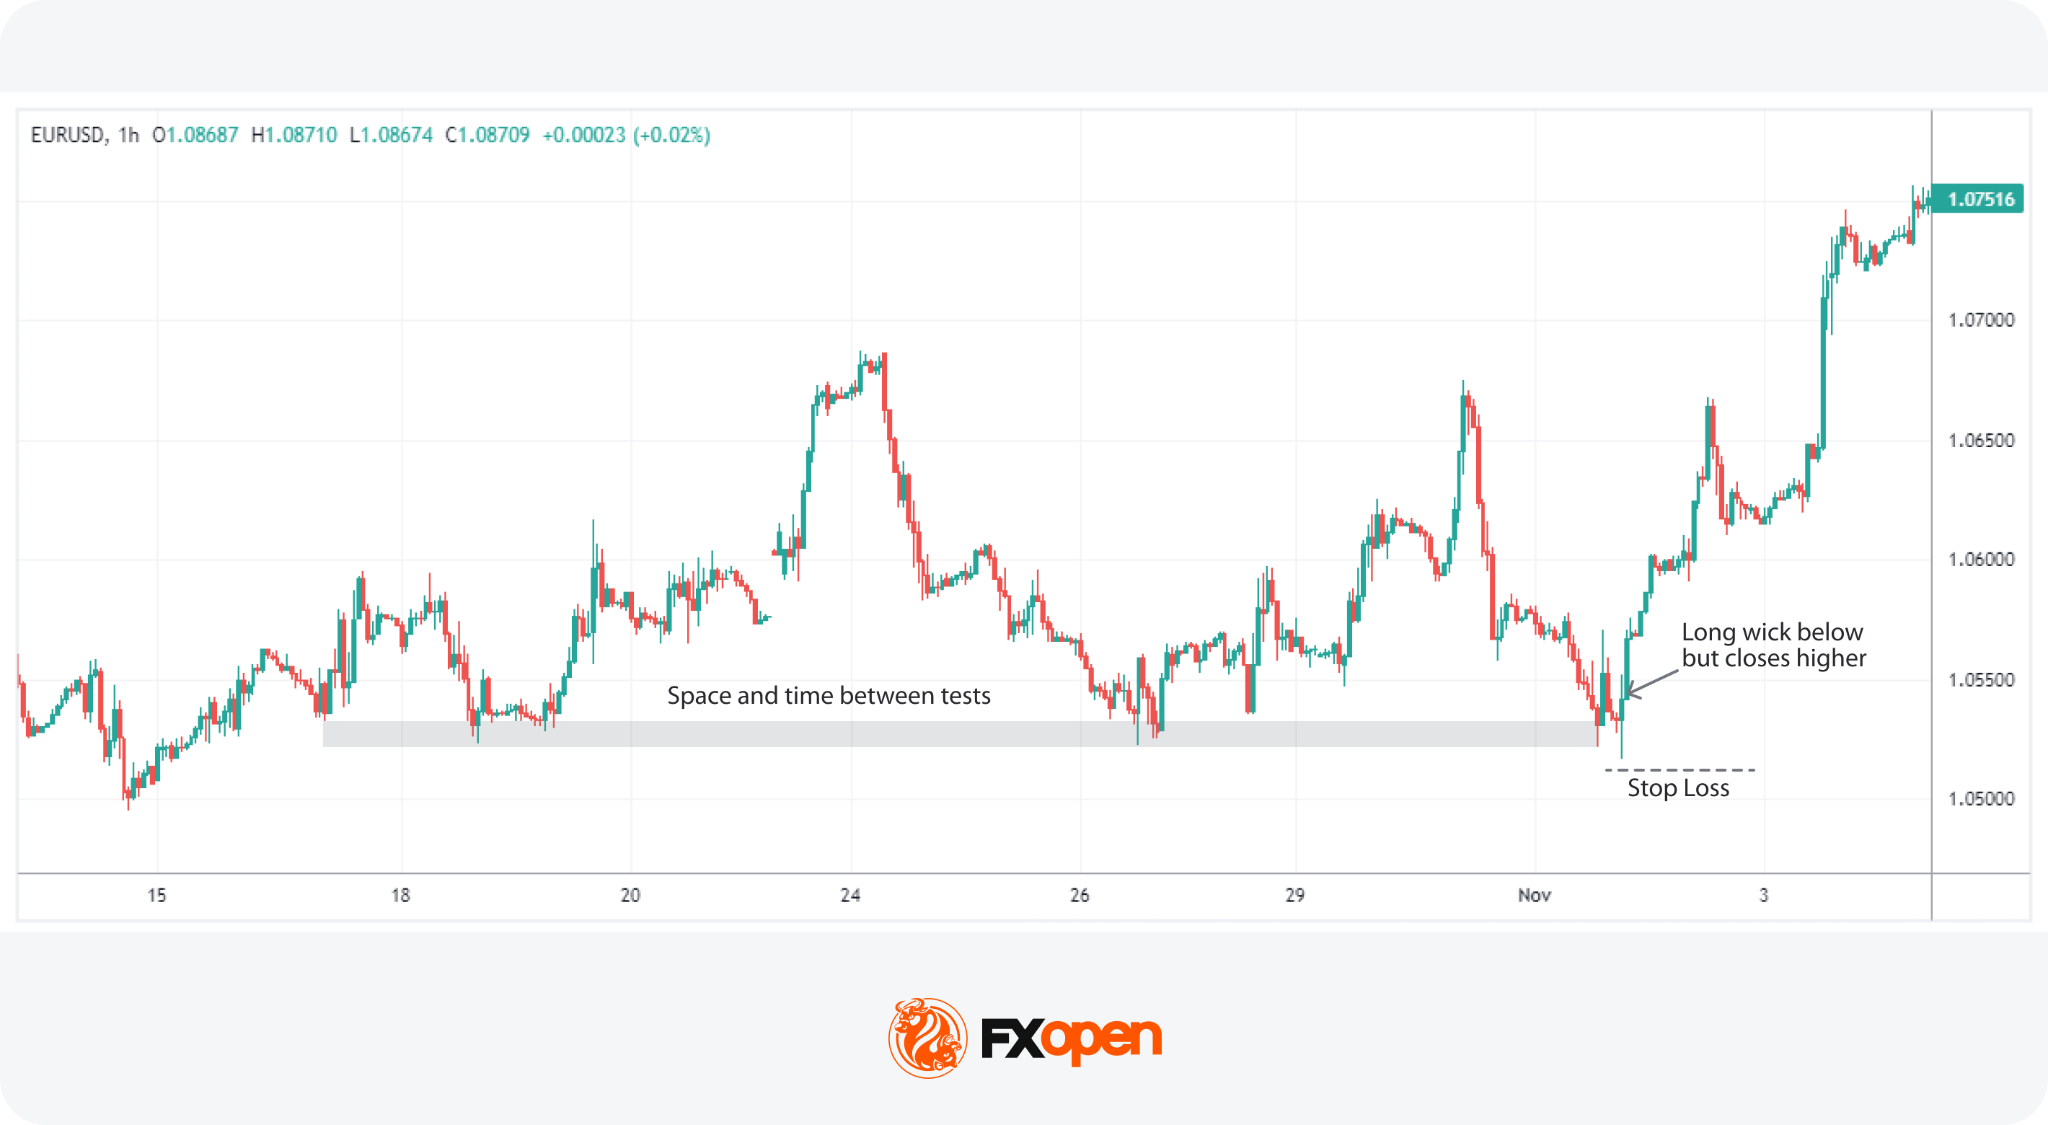
The strategy of focusing on long wicks on candlesticks at significant support or resistance levels leverages the market’s reaction to these critical areas. It’s a technique that thrives on the premise that major horizontal support or resistance, which have been tested multiple times with significant highs or lows, act as strong psychological barriers for price movements.
This method is more popular when there is clear visual space on the chart and considerable time between the tests of these areas, emphasising the significance of these levels.
When price briefly moves beyond support or resistance before quickly reversing, the resulting long wick may indicate rejection of higher or lower prices. Some traders interpret this type of move as a failed breakout, especially when the candle closes back inside the prior range.
On the risk-management side, traders often place stop losses beyond the wick high or low while keeping position size aligned with their overall risk limits.
Entry
- Traders often look for a candle that moves sharply into a major support or resistance area and then reacts away, leaving a long wick. This indicates a strong rejection of the price beyond these areas.
- A movement above or below the previous highs or lows, accompanied by a long bull wick or bear wick, adds confirmation to the trade setup.
Stop Loss
- Traders could set stop losses just beyond the candle’s high or low.
Take Profit
- Traders typically target an opposing support or resistance area for placing take-profit levels, as they expect a bounce from the tested level. However, some traders may opt for a fixed risk/reward ratio instead.
Wick Rejection Near Fibonacci Levels
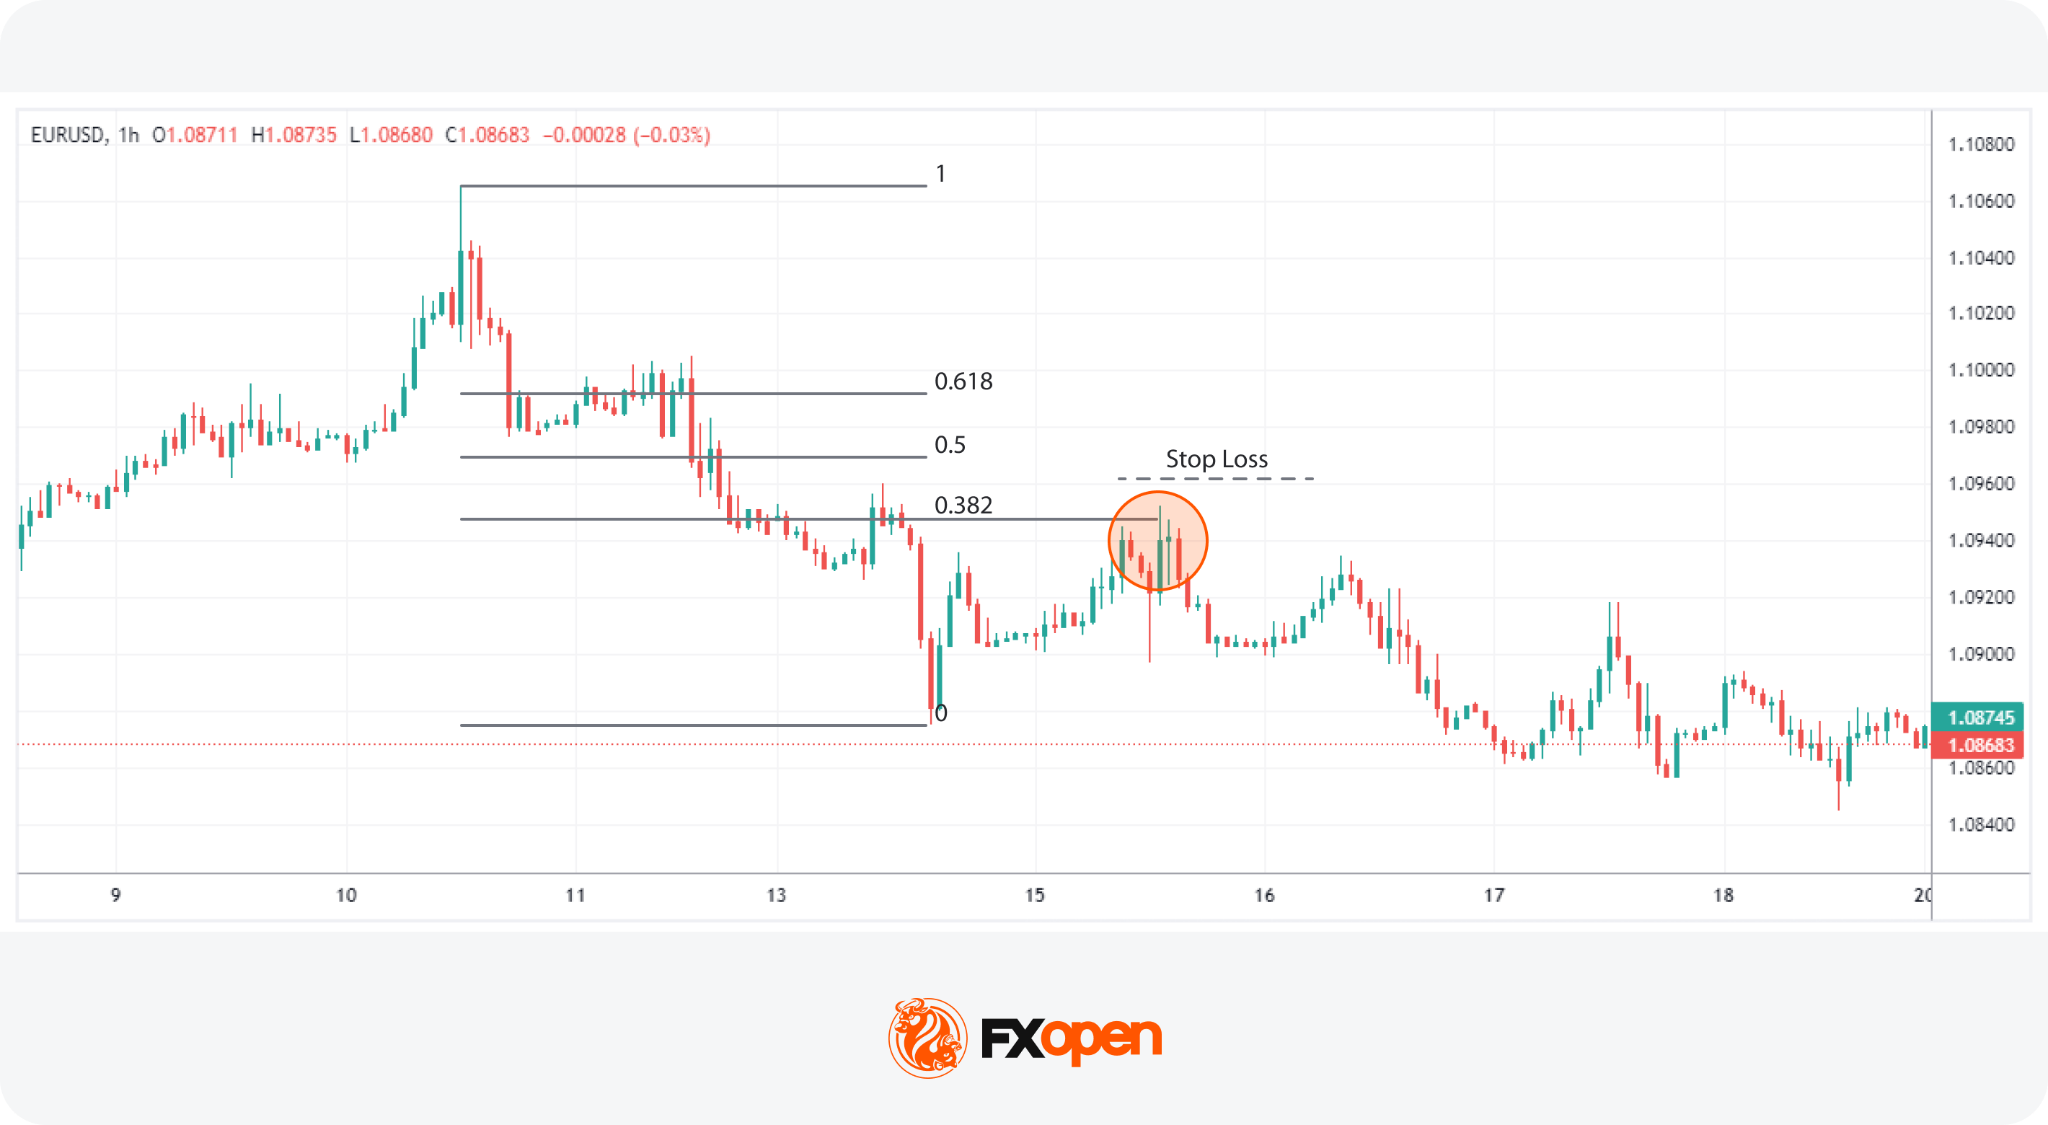
In this strategy, traders use Fibonacci retracements in tandem with candlestick analysis to anticipate trend continuations. The approach starts from a clear trend, with the retracement drawn across the most recent swing.
Fibonacci levels carry more weight when they line up with other technical reference points. Key levels of interest are the 0.382, 0.5, and 0.618 retracement levels, which act as zones of interest rather than precise lines. Traders look for them to overlap with horizontal support or resistance, a prior swing point, or a moving average. A long wick rejecting a Fibonacci level in isolation is generally read with more caution than the same wick at a Fibonacci-plus-structure confluence.
Entry
- Attention is centred on the 0.382, 0.5, and 0.618 Fibonacci retracement levels, awaiting price action that touches these zones.
- The presence of a long wick touching one of these zones reflects a strong rejection of further price movement against the trend, hinting at a potential continuation of the established trend.
- Additional confirmation is sought when these Fibonacci levels coincide with other recognised support or resistance areas, reinforcing the likelihood of a trend continuation.
Stop Loss
- Stop losses are typically positioned just beyond the wick, a nearby swing high/low, or the next Fibonacci retracement level.
Take Profit
- Profit targets might be set at the high or low used to draw the retracement, aiming to capture the full extent of the trend’s movement.
- Alternatively, traders may choose another significant support or resistance level as a profit-taking point based on the prevailing market structure.
Wick Analysis with Volume Confirmation
Candlestick wick analysis often works alongside volume. A wick that prints on noticeably higher volume than the surrounding candles tends to carry more weight than the same wick on thin participation. Relative volume, judged against an average of the prior 20 or 50 periods, is the common way traders frame this read.
Absorption is one behaviour worth watching. When price pushes into a level and the candle prints a long wick on elevated volume, it may suggest that resting orders on the defending side absorbed the move without giving ground. The wick records where buyers or sellers tried to extend the move, and the volume records how much pressure it took to push them back.
Rejection behaviour reads similarly. A long upper wick on heavy volume at resistance may indicate selling interest was meaningful rather than incidental. The same wick on light volume offers less confirmation, and traders typically treat it with more caution.
Traders using volume indicators in forex often supplement them with tools such as Volume Profile or session-based reads.
Common Considerations in Wick Trading
In the world of big wick candle trading, there are some common practices that traders may consider:
- Context: It’s common for traders to analyse wicks within the broader market context to make decisions based not only on one candlestick pattern, but also on other market factors.
- Volume Confirmation: Many traders look for volume confirmation to validate the signals provided by long wicks. A significant volume spike accompanying a considerable wick can indicate strong market interest at certain prices.
- Looking For Confluence: Likewise, seeking areas that coincide with other technical levels can add extra confirmation to a wick-based trade. Fibonacci retracements, support/resistance zones, and moving averages are commonly used.
- Practice Patience: Traders often exercise patience, waiting for the candle to close before making a move. This may help in avoiding false signals that might occur during the candle’s formation.
Avoiding Isolated Candle Analysis
A single wick says far less than the sequence around it. Traders typically zoom out before acting on any wick, checking the prior two or three candles for confirmation that rejection was sustained rather than fleeting.
A long lower wick that prints below support is one signal. The next candle closing back inside the range with a strong body is a second. Without that follow-through, the original wick can be a false alarm, especially during low-volume periods or news-driven spikes. Reading wicks alongside trend, structure, and at least one secondary signal tends to filter out the noise that catches traders acting on a single bar in isolation.
Limitations of Wick Analysis
Wick trading strategy approaches have real limits and traders typically build that into how they use them:
- Low liquidity periods: in thin sessions such as the Asia-Pacific open or late Friday trading, wicks can form on minimal flow. A wick built from a handful of ticks reflects sparse participation more than meaningful rejection.
- News spikes: economic releases and central bank announcements often produce dramatic wicks that have little to do with technical structure. These tend to revert as algorithms unwind initial reactions, so the wick can be misleading as a setup.
- Ranging conditions: in choppy, sideways markets, wicks form constantly at the range extremes and most lack predictive value. The signal-to-noise ratio drops sharply outside trending environments.
- False signals: even in clean conditions, a meaningful share of wick setups fail. Wicks are probabilistic reads on order flow, not certainties.
Wick analysis is usually used as one input in a broader technical framework that also draws on trend identification, structural levels, volume, and risk management. Treating it as a standalone system invites the limitations above to dominate the results.
Summary
While candle wicks may seem like minor visual elements, they often reveal some of the market’s most telling signals. From highlighting rejection zones to exposing failed breakouts, wicks can support traders when building a trading strategy. Many traders use wick analysis inside a broader price action trading framework, alongside trend identification, structural levels, volume, and risk management rather than in isolation.
If you would like to trade with over 1,200 tools and indicators, you can consider opening a forex trading account with FXOpen and gain access to trading in over 700 markets.
FAQ
What Do Long Wicks Mean in Trading?
Long wicks indicate a potential rejection of a given price level. A long upper wick suggests selling pressure after a price hike, while a long lower wick indicates buying support following a drop.
How May Traders Read Candle Wicks?
To read candle wicks, traders examine their length and direction. A long wick signals rejection of prices, especially if it occurs at a support or resistance area. Upper wicks denote selling pressure; lower wicks point to buying interest.
How May Traders Trade Candle Wicks?
Trading candle wicks involves analysing long wicks for potential market reversals. Traders often look for wicks at support or resistance levels as signals to enter or exit trades, using them alongside other indicators for confirmation.
What Is the Candle Wick Trading Strategy?
The candle wick trading strategy utilises the presence of long wicks as indicators for making trading decisions. This approach relies on the idea that wicks signify price rejections and potential shifts in market direction, aiding in identifying entry and exit points.
What Does a Long Upper Wick Indicate?
A long upper wick indicates that buyers pushed price higher during the period but sellers reclaimed control before the close. It typically reflects rejection of higher prices. Near resistance or after an extended rally, it may suggest weakening demand and the potential for a reversal or pause in the trend.
Can Wick Analysis Be Used in Forex Trading?
Yes. Wick analysis is widely applied across forex pairs, particularly at session highs and lows, round-number levels, and major support and resistance zones. Forex traders often combine wick reads with broader price action and risk management rather than treating any single candle as a standalone signal.
What Timeframe Is Commonly Used for Wick Analysis?
Wick analysis works across timeframes, though the read changes with each one. Day traders often watch 5-minute and 15-minute charts, swing traders favour the 1-hour and 4-hour timeframes, and position traders typically focus on daily and weekly candles. Higher timeframes generally produce wicks that carry more weight.
Are Wick Signals Reliable During News Events?
Wick signals during major news events may be weak. Sharp volatility, widened spreads, and algorithmic reactions can produce dramatic wicks that revert quickly. Many traders avoid acting on wicks formed inside news windows and wait for the market to settle before reassessing the technical picture.
This article represents the opinion of the Companies operating under the FXOpen brand only. It is not to be construed as an offer, solicitation, or recommendation with respect to products and services provided by the Companies operating under the FXOpen brand, nor is it to be considered financial advice.

Putting real-world investments onchain, a process called tokenization, is moving out of the testing phase and into everyday business.
Citi’s new report Tokenization 2030: Wall Street On-Chain shared with CoinDesk ahead of Proof of Talk in Paris, shows that the global market for thse digital investments sits at just $17 billion today.
However, Citi expects this market to increase to $5.5 trillion by 2030 in its base forecast. Depending on how fast adoption take place, that could land anywhere from a low end estimate of $2.7 trillion to a bullish forecast of $8.2 trillion, Citi said.
As the report points out, this is a major turning point: “You’re seeing the full weight of American financial power and the global reserve currency moving on change at scale,” Citi says in the report. “When DTCC and the NYSE embed tokenization into capital markets, this marks a tipping point.”
According to Citi, three big shifts are driving this trillions of dollars move.
First, the traditional companies that run the world’s stock markets are building this technology directly into their regular trading systems.
In early May, Wall Street giant Depository Trust & Clearing Corporation (DTCC) announced it would start limited production trades of tokenized securities in July, with a broader launch of its platform set for October. Nasdaq is working on a framework for companies to issue blockchain-based shares with a potential launch as early as 2027. Intercontinental Exchange, which owns the New York Stock Exchange, also has plans for tokenized stocks.
Nasdaq also received regulatory approval to allow certain stocks to be issued and traded in this digital onchain form.
Second, the rise of trusted digital cash is providing the missing piece to make thse trades settle instantly. Standard stablecoins are expected to grow to $1.9 trillion market by 2030, working alongside digital bank deposits to allow assets and cash to swap at the exact same moment. The report expects that the growth of stablecoins alone could create about $1 trillion in new demand for U.S. government bonds, because the companies issuing stablecoins back their digital cash with these real bonds.
Third, the government rules are getting clearer, with a key piece of U.S. digital asset legislation moving forward to a full U.S. Senate vote. On May 14, the Senate Banking Committee managed to end a four-month stall with a 15-9 bipartisan approval by the committee, which advanced the Clarity Act to its next step.
The Citi report notes that the growth they forecast will happen in mainstream public markets, such as U.S. stocks and government bonds, rather than private markets, which are harder to trade and change slowly.
Citi assumes that 10% of the U.S. Treasury bill market and 3% of the U.S. public stock market will be tokenized by 2030. If just 10% of everyday U.S. investors switch to these new digital trading platforms, it would create $2.6 trillion in demand for digital stocks.
On the other side, complex areas like private credit and private equity are each expected to reach a much smaller $100 billion globally by 2030.
The shift will not happen overnight, Citi noted, saying that instead, old and new financial systems will have to run side by side for a while.
The report compares this to how highways adopted electronic toll tags like E-ZPass. Toll roads did not become fully automated in one day. Instead, states built wider roads with parallel lanes for both cash and automated drivers, which added extra cost and confusion before everyone eventually switched over to the fully automated system.
Ultimately, this new setup will give a major advantage to “Structural Orchestrators”. These are the specific big banks and investment firms that control both the real assets and the digital cash rails used to pay for them, allowing them to handle the entire trade inside their own network.

Fundamental Backdrop
The Swiss franc remains influenced by two opposing forces. On the one hand, there is steady demand for safe-haven assets amid tariff-related risks stemming from the United States. On the other, the policy stance of the Swiss National Bank (SNB) continues to play a role: in March, the central bank kept its policy rate at zero and reaffirmed its readiness to intervene in the foreign exchange market to prevent excessive franc appreciation.
The Federal Reserve, for its part, is also taking a cautious approach to policy easing. In January, the Fed paused its rate-cutting cycle, citing persistent inflationary pressures. The divergence in the rhetoric of the two central banks has so far failed to provide either side with a sustained advantage.
Technical Picture
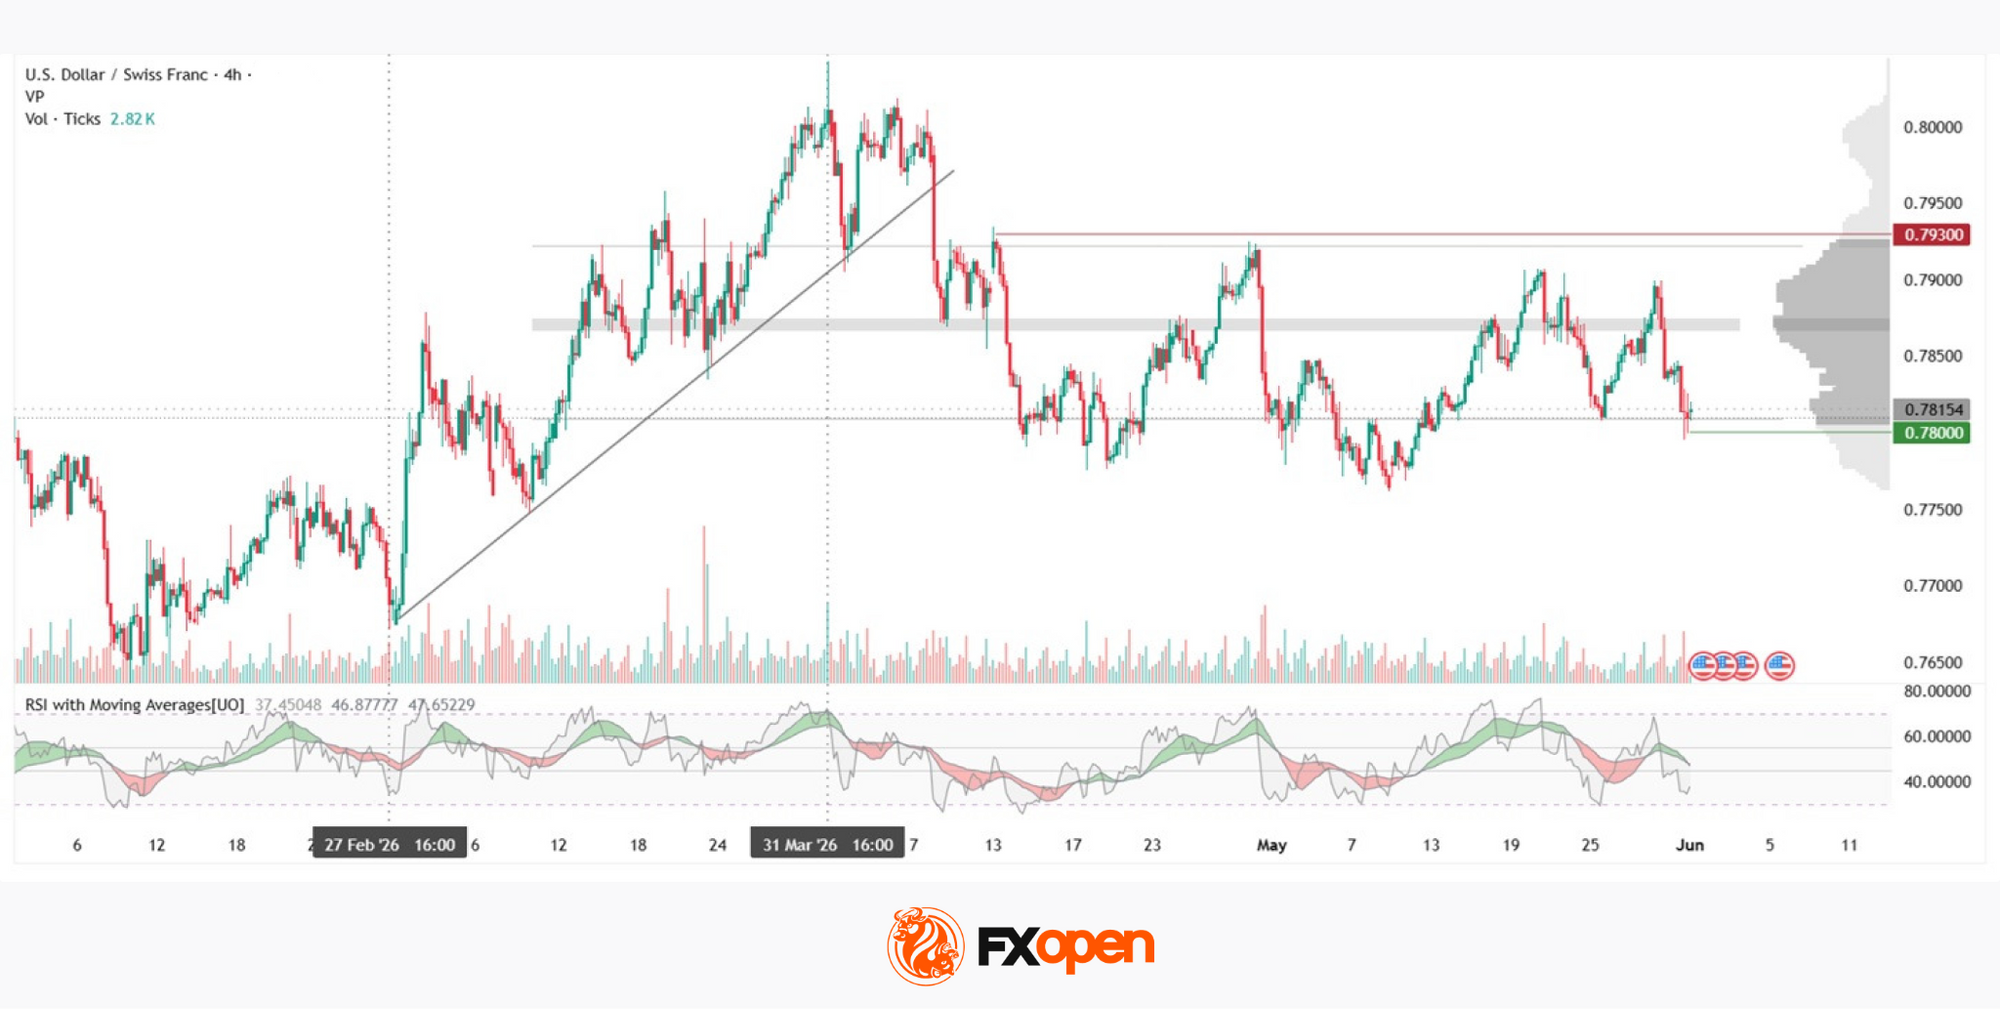
The starting point of the current structure was the 0.7600 area, where USD/CHF formed a local bottom in late January. From 27 February to 31 March, an ascending trendline developed, accompanying the pair’s rise towards the 0.8050 area. In April, the trendline was broken, after which the pair transitioned into a sideways trading phase that remains in place today. The horizontal volume profile formed during this period identifies a point of control in the 0.7865–0.7875 range, where the market spent the greatest amount of time during the period under review.
At present, the price is positioned above the lower boundary of the profile and is testing it from above. The 0.7930 area could attract market participants’ attention should the pair continue to move higher. The 0.7800 region remains a potential reference point if a bearish move develops, as it represents the nearest support zone.
The RSI oscillator and its moving averages currently show readings of 37/46/47. The indicator remains below both moving averages; however, the averages themselves are still positioned in neutral territory, which should also be taken into account.
Key Takeaways
The pair has completed its upward trend and entered a consolidation phase, while price is currently testing the lower boundary of the existing profile. The RSI and its moving averages stand at 37/46/47: the indicator remains below both moving averages, although the averages themselves are still located in neutral territory.
Trade over 50 forex markets 24 hours a day with FXOpen. Take advantage of low commissions, deep liquidity, and spreads from 0.0 pips (additional fees may apply). Open your FXOpen account now or learn more about trading forex with FXOpen.
This article represents the opinion of the Companies operating under the FXOpen brand only. It is not to be construed as an offer, solicitation, or recommendation with respect to products and services provided by the Companies operating under the FXOpen brand, nor is it to be considered financial advice.

Key Takeaways
- The Sui blockchain experienced three critical failures between Thursday and Friday, all stemming from issues in the v1.72 software update.
- Initial outages resulted from a gas fee calculation error related to a newly implemented “address balances” functionality.
- Sui Foundation acknowledged deploying a temporary patch despite knowing it could trigger additional network failures — which subsequently occurred.
- An unrelated malfunction in the blockchain’s randomness generation mechanism caused a third stoppage lasting approximately six hours.
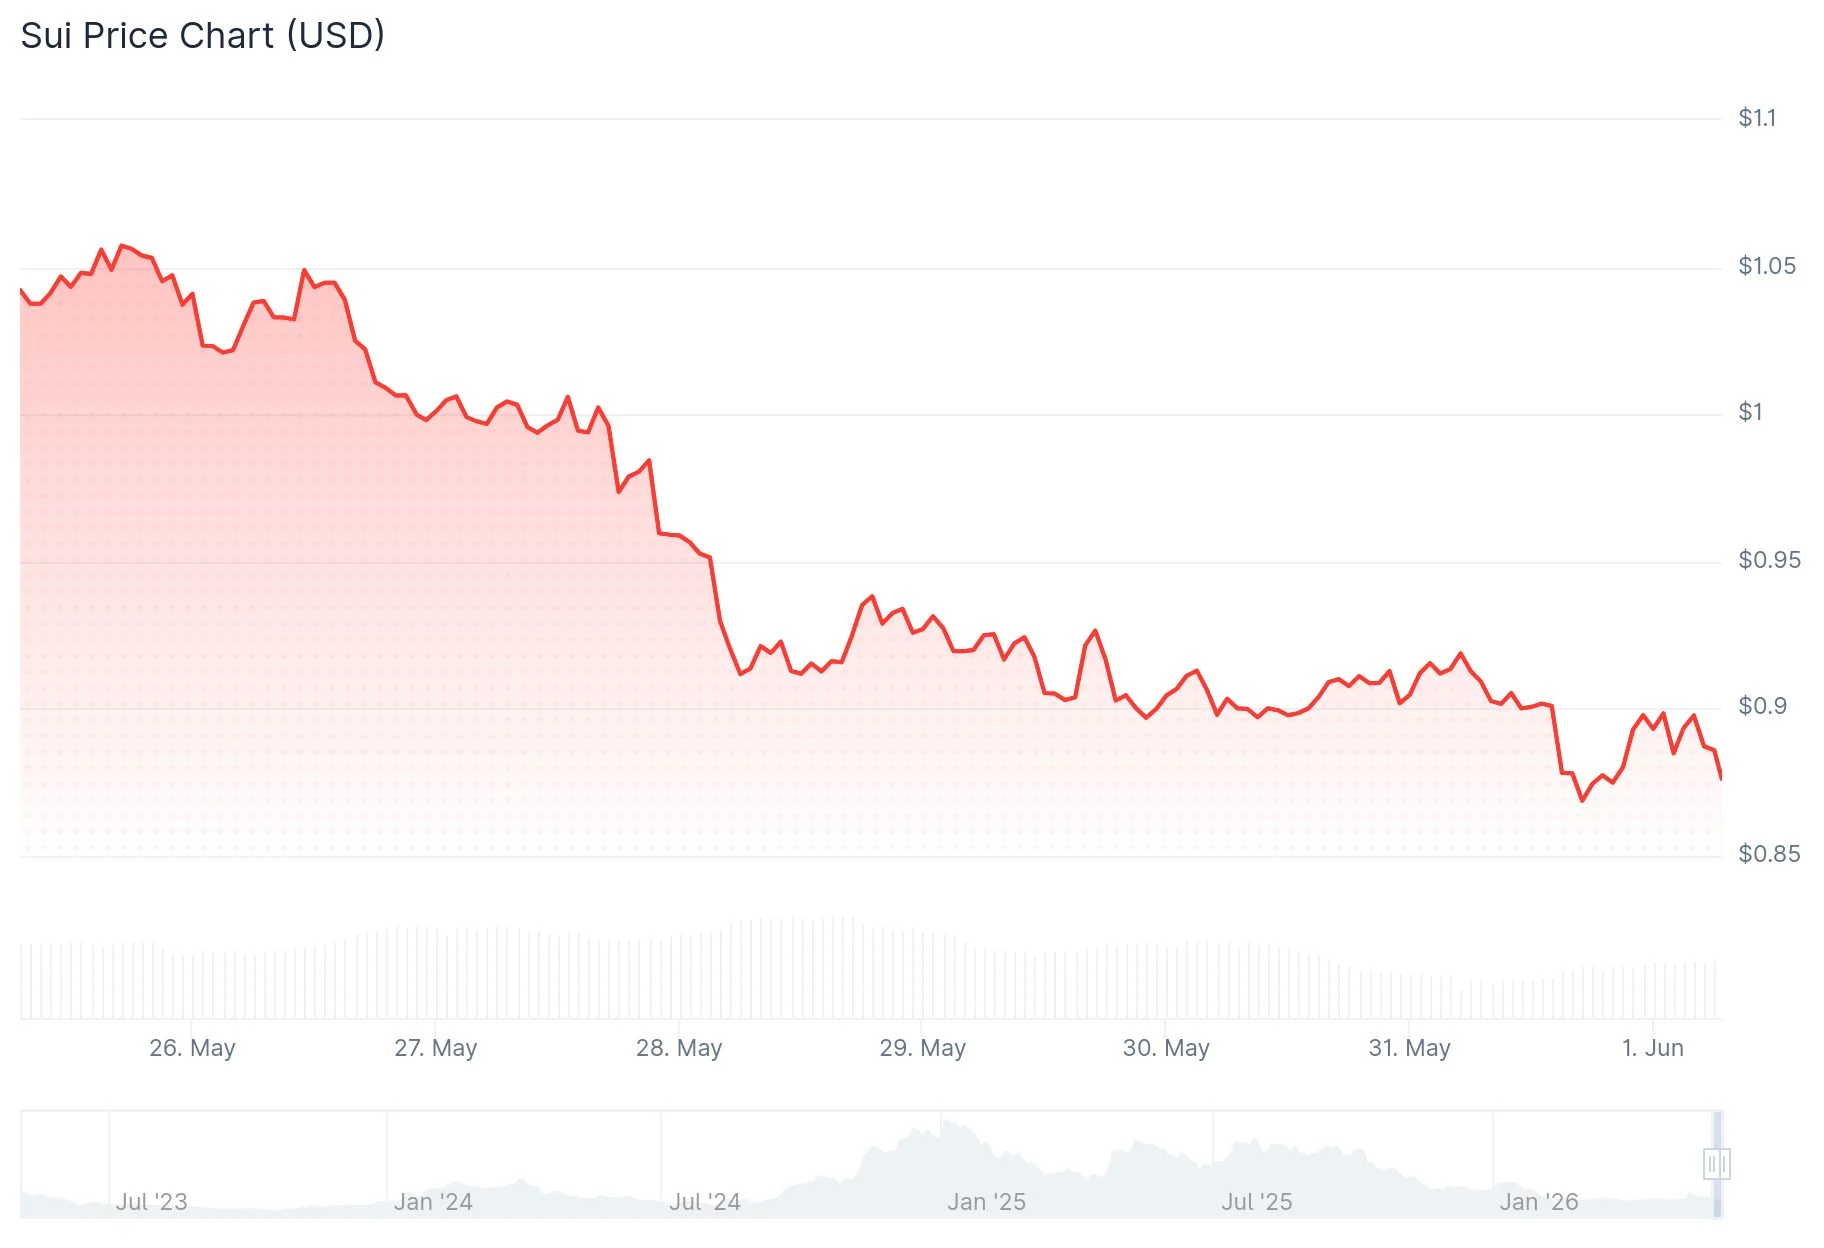
- The SUI token has declined to approximately $0.87, representing a roughly 13% decrease from its $1.04 price point seven days prior.
The Sui blockchain encountered an unprecedented series of network failures last week, experiencing three complete shutdowns within a 48-hour window. This Layer 1 protocol, developed by Mysten Labs, remained non-operational for a cumulative period exceeding 18 hours throughout May 28 and May 29. Each incident traced back to complications arising from the v1.72 software deployment.
The initial network disruption commenced at approximately 10 a.m. Eastern Time on Thursday, persisting until roughly 4:30 p.m. that afternoon. Investigators identified the root cause as a defect in the protocol’s gas fee processing mechanism connected to a recently introduced “address balances” feature. When transactions failed due to insufficient account balances, the system attempted to deduct gas charges from those same depleted funds, creating negative balance entries that ultimately caused validator settlement operations to fail catastrophically.
By early Thursday afternoon, the Sui Foundation had implemented a corrective measure. However, according to their official incident analysis released Sunday, engineering teams were fully aware the emergency patch contained inherent risks that could potentially cause subsequent network instability. They made the calculated decision to proceed with deployment to expedite service restoration.
Conscious Risk Leads to Secondary Network Failure
That strategic choice directly precipitated the second outage. Early Friday morning, around 5 a.m. Eastern Time, the blockchain halted once more when the specific vulnerability engineers had previously identified actually materialized. The identical balance underflow crash occurred because a different error classification had obscured the specific condition the initial patch was engineered to prevent. A comprehensive solution was successfully implemented by approximately 8:30 a.m. Eastern Time.
A third distinct failure struck later that same Friday afternoon, originating from an entirely separate technical issue. As validators rebooted their systems to implement the Friday morning correction, an insufficient number achieved readiness for the distributed key generation protocol that powers the network’s random number generation system. This DKG process automatically disabled itself according to design specifications, but a separate bug prevented the failure state from being properly written to persistent storage. Validators continued cycling through restart procedures without awareness that DKG had already terminated, causing transactions dependent on randomness functionality to accumulate indefinitely while the current epoch remained frozen. The network stayed offline from approximately 4:30 p.m. until 10:20 p.m. Eastern Time.
According to the Sui Foundation, artificial intelligence agents with direct access to validator logging data significantly accelerated diagnostic procedures across all three separate incidents.
Token Value Declines Amid Consecutive Outages
SUI was valued at approximately $0.87 during publication, reflecting about a 13% decline from the $1.04 level recorded seven days earlier. The cryptocurrency’s total market capitalization currently stands at roughly $3.49 billion. The asset reached its historical peak of $5.35 on January 6, 2025, indicating current pricing represents approximately an 84% reduction from that maximum. Throughout the three network stoppages, approximately $1.88 million in SUI leveraged positions faced liquidation, with traders holding long positions absorbing the majority of financial losses.
Cryptocurrency market analyst Crypto Patel observed on X that SUI appears to be exhibiting a stealth accumulation formation with minimal retail participant engagement, implying institutional players may be establishing positions within the $0.60–$0.90 price corridor. The Relative Strength Index currently registers at 34.51, approaching technically oversold conditions. Open interest contracted by 4.17% to $705 million, while trading volume expanded 28% to reach $740 million.
These incidents represent a continuation of Sui’s operational challenges. The blockchain previously experienced a six-hour interruption in January 2026 and suffered a validator malfunction in November 2024. Foundation representatives indicated plans to enhance fault isolation mechanisms so that future software defects affect individual transaction processing rather than triggering complete network-wide halts.


Key Points
- Security expert “0xflorent” successfully freed approximately 1,003 ETH (valued at roughly $2 million) from a 2016 HongCoin ICO smart contract after nine years
- An error in the contract’s refund mechanism prevented investors from withdrawing their ETH when the ICO failed to meet its fundraising target
- The researcher collaborated with HongCoin’s team to leverage an integer overflow flaw in an administrative function to release the locked assets
- 48 initial investors are now able to retrieve their ETH; two participants have already withdrawn 96.5 ETH (approximately $193,000)
- The researcher accepted no compensation — only voluntary “whitehat rewards” from grateful investors
A cybersecurity expert has successfully released approximately 1,003 Ether valued at around $2 million that remained trapped in a 2016 ICO smart contract for almost ten years.
The cryptocurrency belonged to participants in HongCoin, an Ethereum-based token offering marketed as a community-driven investment vehicle. The ICO operated from August 29 through October 28, 2016, but ultimately fell short of its fundraising target.
Following the unsuccessful sale, the smart contract should have automatically returned funds to investors. However, a coding error in the refund mechanism silently prevented this from occurring.
The cybersecurity professional, identified online as “0xflorent” or Florent, detailed the technical problem in a social media post on X. The refund mechanism would decline any token holder whose balance exceeded a global tracking variable. Through years of partial withdrawals, this counter had decreased to 356, effectively limiting total refunds to merely 3.56 ETH — significantly less than what most participants were entitled to receive.
The contract was developed using an outdated version of Solidity, the coding language for Ethereum smart contracts. It lacked safeguards against integer overflow vulnerabilities — a defect where numerical values increase beyond their maximum limit and reset to zero or one. The blockchain industry subsequently addressed this weakness through SafeMath, a protective library.
The Recovery Process
Florent discovered a solution by utilizing the HongCoin team’s administrative function. Executing it with a particular input value reset a participant’s token balance to one, enabling the refund verification to succeed and releasing the ETH.
This wasn’t an independent exploit. The administrative function required authorization from the HongCoin team’s multisignature wallet, necessitating team approval for each transaction. Florent contacted the team via email, validated the solution on a test network, and the team subsequently approved 41 transactions — one for each affected investor. The entire operation required approximately one week.
Among the 48 qualified investors, 41 required the balance adjustment. The remaining seven held sufficiently small amounts to receive direct refunds.
Two participants have already withdrawn a total of 96.5 ETH, worth approximately $193,000. Both voluntarily compensated Florent with whitehat rewards, though no payment was obligatory. “There were no fees, no cut, no commission,” Florent stated to The Block.
Ongoing Recovery Efforts
This isn’t Florent’s inaugural recovery operation. On May 24, he documented liberating 19.33 Ethereum from two different legacy contracts — a defunct 2018 ICO and a Liquality Wallet account whose assets were stuck in expired atomic swaps.
Florent explained that he recently deployed his own Ethereum node and developed a scanning tool to identify contracts holding over 100 ETH. He then systematically reviewed candidates searching for exploitable weaknesses.
He also utilized Claude Code to assist with sorting and categorizing contracts, though he acknowledged the AI platform has limitations when directly analyzing smart contract security flaws.
Florent expressed his hope to see more individuals working to safeguard funds rather than exploit them. “It’s more rewarding morally, and it can also pay well,” he remarked.
Crypto World
Ethereum (ETH) Price: Historical Trends Signal Potential Decline to $1,800 Before Recovery
Key Takeaways
- Ethereum has declined 12.5% over the last 30 days, underperforming the top 5 cryptocurrencies
- Historical data shows June has brought negative returns for ETH in 7 out of the past 10 years
- ETH faces difficulty maintaining the $2,000 level, with $1,800 identified as critical support
- Futures open interest reached an unprecedented peak of 15.98 million ETH on May 27
- Technical analyst Ali Charts identifies $1,825 as a strategic entry zone with targets at $2,073 and $2,360
Ethereum has experienced significant downward pressure recently. Over the past month, ETH has shed 12.5% of its value, positioning it as the weakest performer among the five largest cryptocurrencies by market capitalization.

As competing assets such as BNB and Hyperliquid capture market interest through fresh ETF product launches in the United States, Ethereum has found itself lagging behind.
Currently, the asset trades marginally under the $2,010 mark, positioned beneath the 100-hour Simple Moving Average. Technical charts reveal that a bullish trend line previously supporting the price at $2,015 has been compromised on the hourly timeframe.
A recent intraday low touched $1,965 before buyers attempted a modest bounce. Nevertheless, selling pressure reasserted itself above $2,020, keeping bearish momentum intact.
The Relative Strength Index on the daily chart has declined to 32, approaching oversold conditions without fully entering that territory. Should the price definitively breach $2,000, additional downside could materialize.
Historical Trends Suggest Further Weakness
Seasonal analysis presents a concerning outlook for Ethereum this month. Data from CoinGlass reveals that June has concluded negatively for ETH in 7 of the previous 10 years. These declines have varied between 1.5% and 45%.
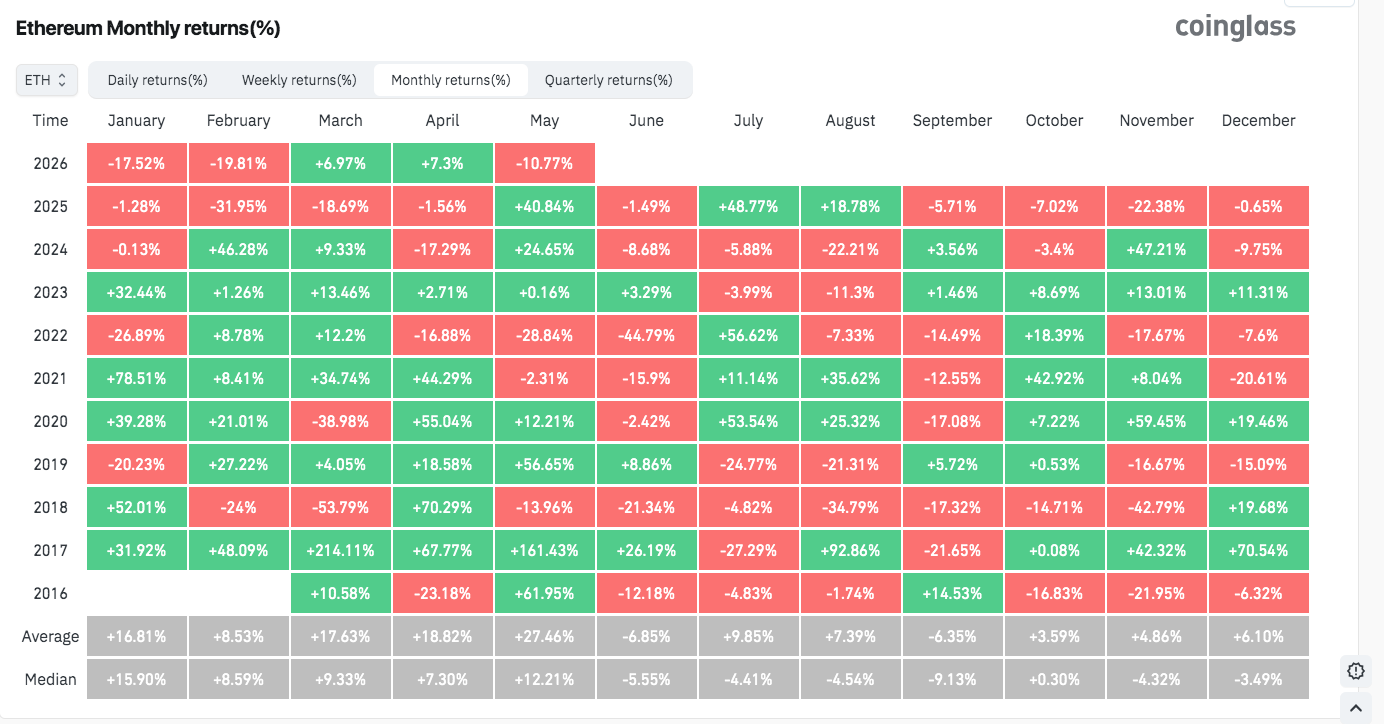
Given these historical precedents, a descent toward $1,800 appears increasingly plausible should the $2,000 support fail to hold.
Critical downside levels include $1,965 as the immediate support, followed by $1,920 and $1,850. The primary demand zone is located around $1,780.
On social platform X, analyst Ali Charts observed that ETH is nearing the lower boundary of its prevailing channel structure around $1,825. According to his assessment, this level presents an attractive risk-reward opportunity for entry, with projected upside targets at $2,073 and $2,360, contingent upon maintaining above $1,750 on daily closing basis.
Futures Activity Reaches Unprecedented Levels
Despite declining prices, activity in ETH futures markets surged to an all-time record. Open interest peaked at 15.98 million ETH on May 27, as reported by CoinGlass.
When calculated in ETH rather than dollar value, this metric eliminates price fluctuation distortions. The elevated reading indicates that market participants are actively establishing positions in anticipation of significant price movement.
Additionally, the weekly RSI has fallen beneath the 30 threshold. Historical analysis shows that the previous three occasions when this occurred preceded substantial price appreciation over the subsequent 6 to 12 months.
For bullish sentiment to regain dominance in the near term, Ethereum must reclaim the $2,050 resistance level. Successfully surpassing that barrier could trigger advances toward $2,085, followed by $2,120, and potentially extending to $2,150.
Presently, ETH continues trading beneath $2,010, with immediate focus centered on whether the $1,965 support level will hold against persistent selling pressure.
Key Points
- Cardano Foundation withdraws plans for 2026 summit following unsuccessful treasury funding vote that missed supermajority requirement
- Modified funding request for 7.8 million ADA (approximately $2 million) achieved 65.21% approval, falling 1.46% below the mandatory 66.67% threshold
- Initial funding proposal sought 14 million ADA (roughly $3.66 million) but faced rejection in May, prompting a reduced resubmission
- EMURGO’s independent TOKEN2049 Singapore conference proposal successfully passed, ensuring Cardano representation at the October gathering
- The outcome highlights growing resistance among Cardano’s delegated representatives toward treasury expenditures by founding entities
The Cardano Foundation has officially withdrawn its 2026 annual summit following a governance vote that came agonizingly close but ultimately failed to authorize necessary treasury funding.
Scheduled for October 5-6 in Singapore, the summit required 7.8 million Cardano tokens—valued at approximately $2 million—to proceed. The voting period concluded on Friday, May 29.
Approval Falls Fractionally Below Supermajority
Cardano’s governance framework mandates that treasury fund releases achieve a two-thirds supermajority from delegated representative (DRep) stake. The proposal garnered 65.21% backing—missing the mark by a mere 1.46 percentage points.
When examining individual votes, 135 delegates supported the measure, 61 opposed it, and 24 chose to abstain. Despite receiving Constitutional Committee endorsement, the proposal couldn’t overcome the network’s stringent voting requirements.
Following the vote’s conclusion, the Cardano Foundation shared on X: “Governance requires not only participation, but also a commitment to accept collective decisions. The Cardano community has spoken and we respect the outcome.”
The organization confirmed it would immediately begin discontinuing summit preparations.
Second Rejection Following Budget Reduction
This marked the proposal’s second unsuccessful attempt. The original May submission requested 14 million ADA—worth approximately $3.66 million—and combined summit funding with an EMURGO-led TOKEN2049 sponsorship. That consolidated proposal secured just 10% DRep backing.
Responding to the rejection, the foundation separated both events, reduced the budget by over 20%, and incorporated audited financial management, milestone-based payment releases, and an independent oversight committee.
Cardano creator Charles Hoskinson and foundation CEO Frederik Gregaard both publicly campaigned for DReps to support the modified proposal in the final hours before voting ended. Notably, the foundation refrained from casting votes on its own request, stating it wanted to avoid influencing the decision.
The separation strategy yielded one positive outcome. EMURGO’s standalone TOKEN2049 proposal received approval independently, guaranteeing Cardano participation at the Singapore cryptocurrency conference on October 7-8. The foundation supported EMURGO’s proposal.
Hoskinson has indicated he’s considering expanding the TOKEN2049 booth presence and potentially organizing a smaller embedded MiniSummit alongside it.
Escalating Treasury Spending Disputes Within Cardano Ecosystem
This unsuccessful vote represents a broader 2026 trend. Cardano’s delegated representatives have consistently rejected multiple treasury requests associated with Hoskinson, EMURGO, and Input Output Global, including reduced funding allocations connected to the Leios mainnet advancement.
Cardano’s token maintains an $8.8 billion market capitalization. The network currently holds under $129 million in total value locked, positioning it 28th among blockchain platforms.
Throughout 2026, the network has produced $356,400 in fees, compared with $8.35 million across the entire 2022 calendar year.
As of Sunday, Cardano’s token traded near $0.233, reflecting approximately 5% decline over the preceding month.
Man charged after Downpatrick attack on police officer as two others arrested
Morgan Stanley initiates HawkEye 360 stock at overweight on SIGINT demand

Wintermute Adds Liquidity to Rapidly Expanding Prediction Markets


-

 NewsBeat5 days ago
Israel says it has killed new Hamas military leader in Gaza City airstrikes
-

 Tech5 days ago
NASA taps Blue Origin to deliver lunar rovers for Moon Base initiative
-

 Politics7 days ago
Bridgerton Season 5: Cast, Release Date And Everything We Know So Far
-

 Sports6 days ago
2026 NBA Finals schedule, odds: Knicks await Thunder or Spurs after winning East
-

 News Videos5 days ago
XRP *JUST* SUCCEEDED!!!! CLARITY ACT EXPOSED!!! (SHE EXPOSED IT)
-

 News Videos3 days ago
This is BROKEN! INSANE 5x MONEY CAR WASH WEEK! The NEW GTA Online UPDATE Today! (GTA5 New Update)
-
Crypto World5 days ago
Micron Crosses $1 Trillion Market Cap as AI Demand Reshapes Memory Sector
-
 NewsBeat7 days ago
Hottest May day ever as London hits 34.8C in 2C leap from previous records
-

 Business5 days ago
Selena Gomez Reportedly Upset Over Benny Blanco’s Comments on Her ‘Terrible’ Diet
-
 Tech6 days ago
China assigns ID codes to 28,000+ humanoid robots
-

 Business7 days ago
BTS Sells Out Four Las Vegas Shows at Allegiant Stadium for ARIRANG World Tour
-

 Business6 days ago
Nikkei 225 Surges Past 65,000 for First Time as Iran Peace Hopes Fuel Record Rally
-

 Tech7 days ago
Microsoft’s quiet Claude Code retreat and the real cost of enterprise AI
-

 Tech3 days ago
Waymo dominates autonomous vehicle registrations as Tesla trails behind
-
 Entertainment6 days ago
‘Breaking Bad’ Star’s Easy-to-Binge 6-Part Crime Series Spin-Off Is Finally Heading to Free Streaming
-

 NewsBeat7 days ago
Crowds find riverside shade in York as temperatures soar
-
Tech5 days ago
The Samsung pay deal is the moment Korean unions changed register
-

 Tech7 days ago
Westone Audio and Etymotic Acquired by Fidelity Collective in Major IEM Market Move
-

 Tech5 days ago
Millions of AI agents imperiled by critical vulnerability in open source package
-

 Entertainment6 days ago
Days of our Lives 2-Week Spoilers May 25-June 5: Gwen Rages, Abe Confesses & 2 Tragic Anniversaries!
You must be logged in to post a comment Login