
Crypto World
CryptoQuant Places Bitcoin Bear Market Bottom at $55,000 as Key Indicators Show Extended Correction Ahead
TLDR:
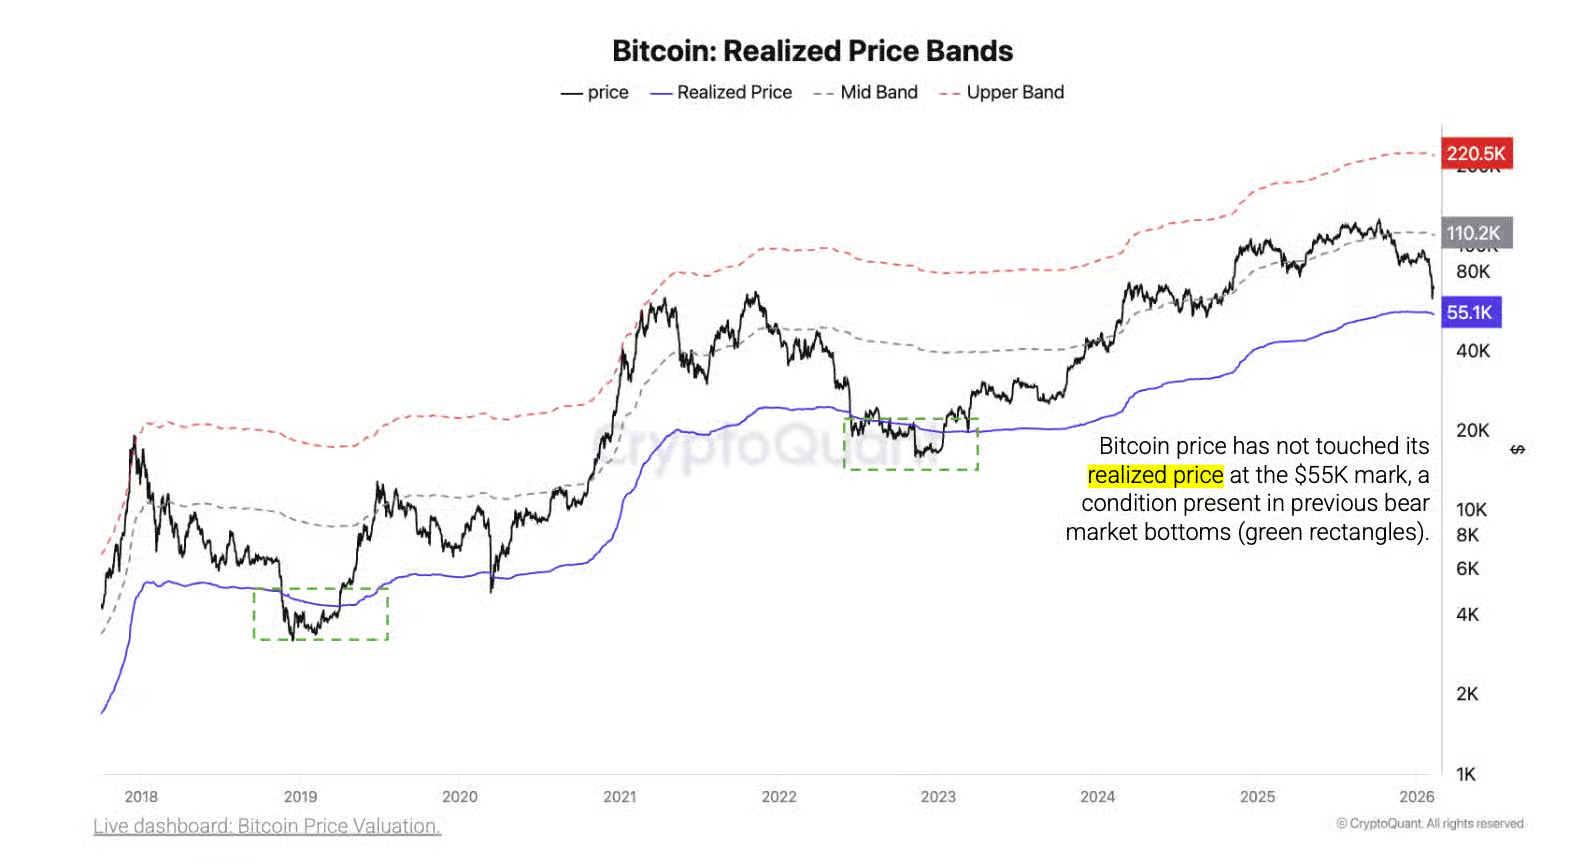
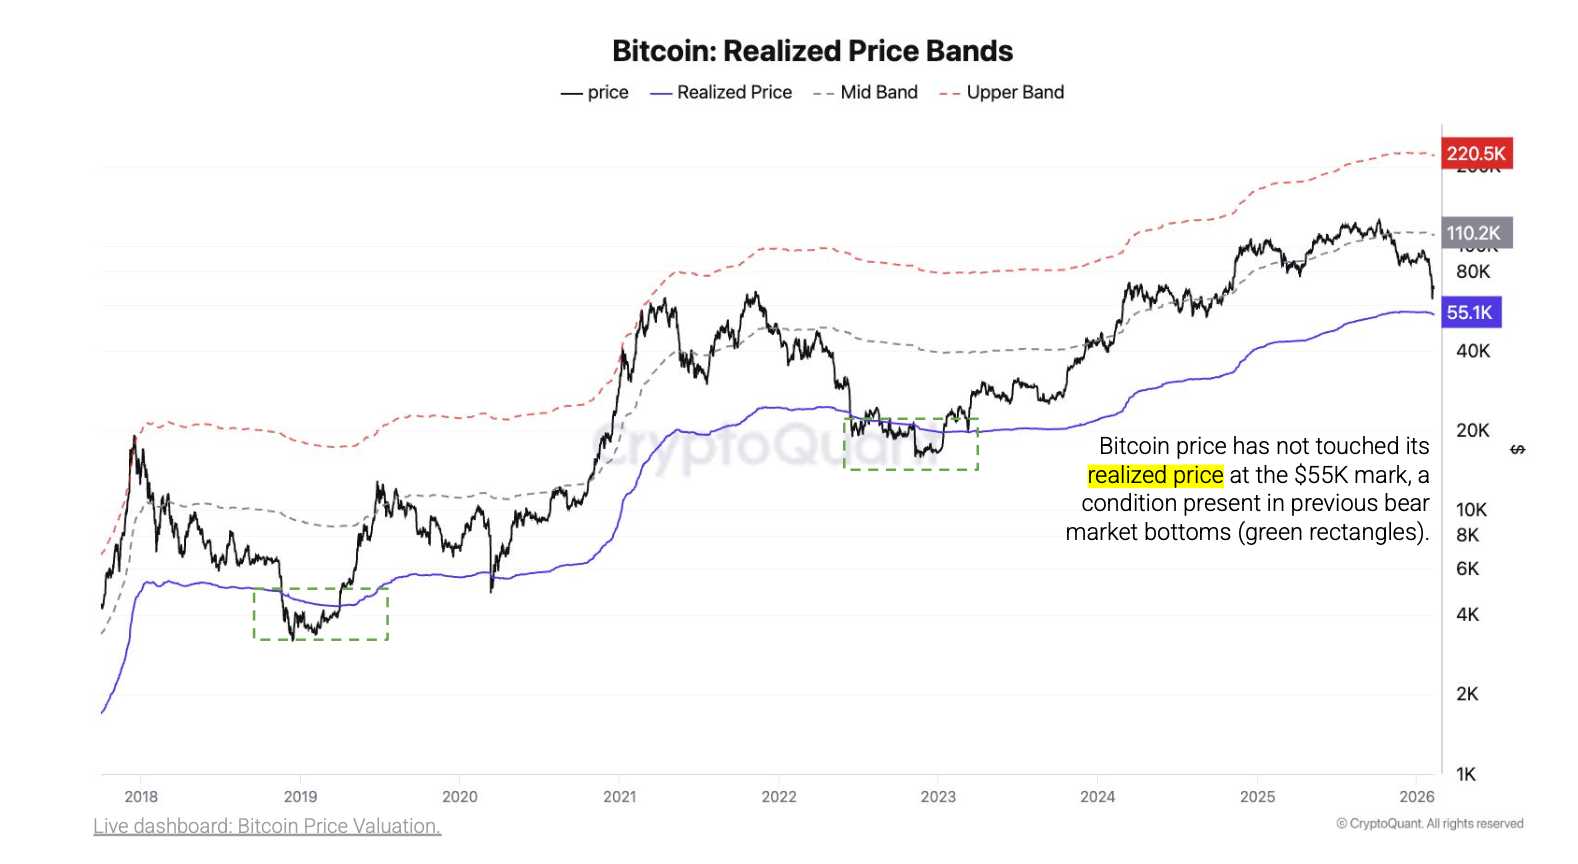
- Bitcoin trades 25% above its realized price of $55,000, which historically marks bear market bottoms
- February 5 sell-off triggered $5.4 billion in daily losses, the largest since March 2023’s $5.8 billion event
- Monthly realized losses at 0.3 million BTC remain far below 2022 bear market bottom of 1.1 million BTC
- Long-term holders selling near breakeven versus 30-40% losses typical at previous bear market cycle lows
Bitcoin’s bear market floor sits around $55,000, according to blockchain analytics platform CryptoQuant. The firm’s latest assessment suggests the cryptocurrency remains more than 25% above this critical support level.
CryptoQuant analysts note that bear market bottoms require several months to establish rather than forming through sudden capitulation events.
This analysis comes as Bitcoin trades significantly higher than key historical support zones that marked previous cycle lows.
Realized Price Indicates Extended Bottoming Process
The realized price metric serves as CryptoQuant’s primary indicator for determining Bitcoin’s potential bottom. This measure calculates the average price at which all coins last moved on the blockchain.
Historical data shows this metric provided strong support during past bear markets. Current trading prices remain elevated compared to this threshold, suggesting additional downside potential exists.
Previous bear cycles demonstrated distinct patterns when Bitcoin approached these levels. During the 2018 downturn, prices dropped 30% below the realized price before stabilizing.
The FTX collapse in 2022 pushed Bitcoin 24% beneath this metric. After reaching these depths, the cryptocurrency spent between four and six months building a foundation before recovery began.
Recent market volatility has not yet pushed Bitcoin into the extreme zones that characterize true bottoms. On February 5, the asset experienced a 14% decline to $62,000, triggering $5.4 billion in realized losses.
This marked the largest single-day loss realization since March 2023, when holders crystallized $5.8 billion in losses. The figure also exceeded the $4.3 billion recorded shortly after the FTX exchange collapsed.
Despite these substantial losses, CryptoQuant maintains that a structural bottom has not materialized. Monthly cumulative realized losses currently stand at 0.3 million BTC, well below the 1.1 million BTC observed at the end of the 2022 bear market. This disparity suggests selling pressure has not reached the intensity associated with cycle lows.
Source: Cryptoquant
Multiple Indicators Show Market Remains Above Capitulation Levels
The MVRV ratio, which compares market value to realized value, has not entered extreme undervaluation territory. This metric historically signals bear market bottoms when reaching deeply depressed levels.
Current readings indicate Bitcoin trades above the ranges that marked previous cycle nadirs. Similarly, the Net Unrealized Profit and Loss metric has not declined to the 20% unrealized loss threshold observed at past bottoms.
Long-term holder behavior provides additional evidence that full capitulation has not occurred. These investors currently sell positions near breakeven prices.
During previous bear market conclusions, long-term holders typically absorbed losses between 30% and 40% before markets reversed. This behavioral difference suggests conviction remains higher than at historical turning points.
Approximately 55% of Bitcoin’s circulating supply remains profitable at current prices. This contrasts with the 45% to 50% range typically observed at cycle lows.
The elevated proportion of profitable holdings indicates many investors entered positions at lower prices and maintain paper gains. Bear market bottoms usually feature a higher percentage of underwater positions across the holder base.
CryptoQuant’s Bull-Bear Market Cycle Indicator remains in the Bear Phase rather than advancing to the Extreme Bear Phase. The latter designation historically marks the beginning of extended bottoming periods.
These extreme phases typically persist for several months, reinforcing the firm’s assessment that bear markets require time to resolve.
Standard Chartered recently adjusted its outlook, projecting Bitcoin could test $50,000 before recovering later this year.


Onchain investigator ZachXBT accused Circle of failing to act while millions in stolen USDC moved freely through its own cross-chain bridge during the $285 million Drift Protocol exploit.
The criticism followed the April 1 attack on the Solana-based decentralized exchange, which ranks as the largest DeFi exploit of 2026 so far.
Circle Faces Backlash Over CCTP Inaction
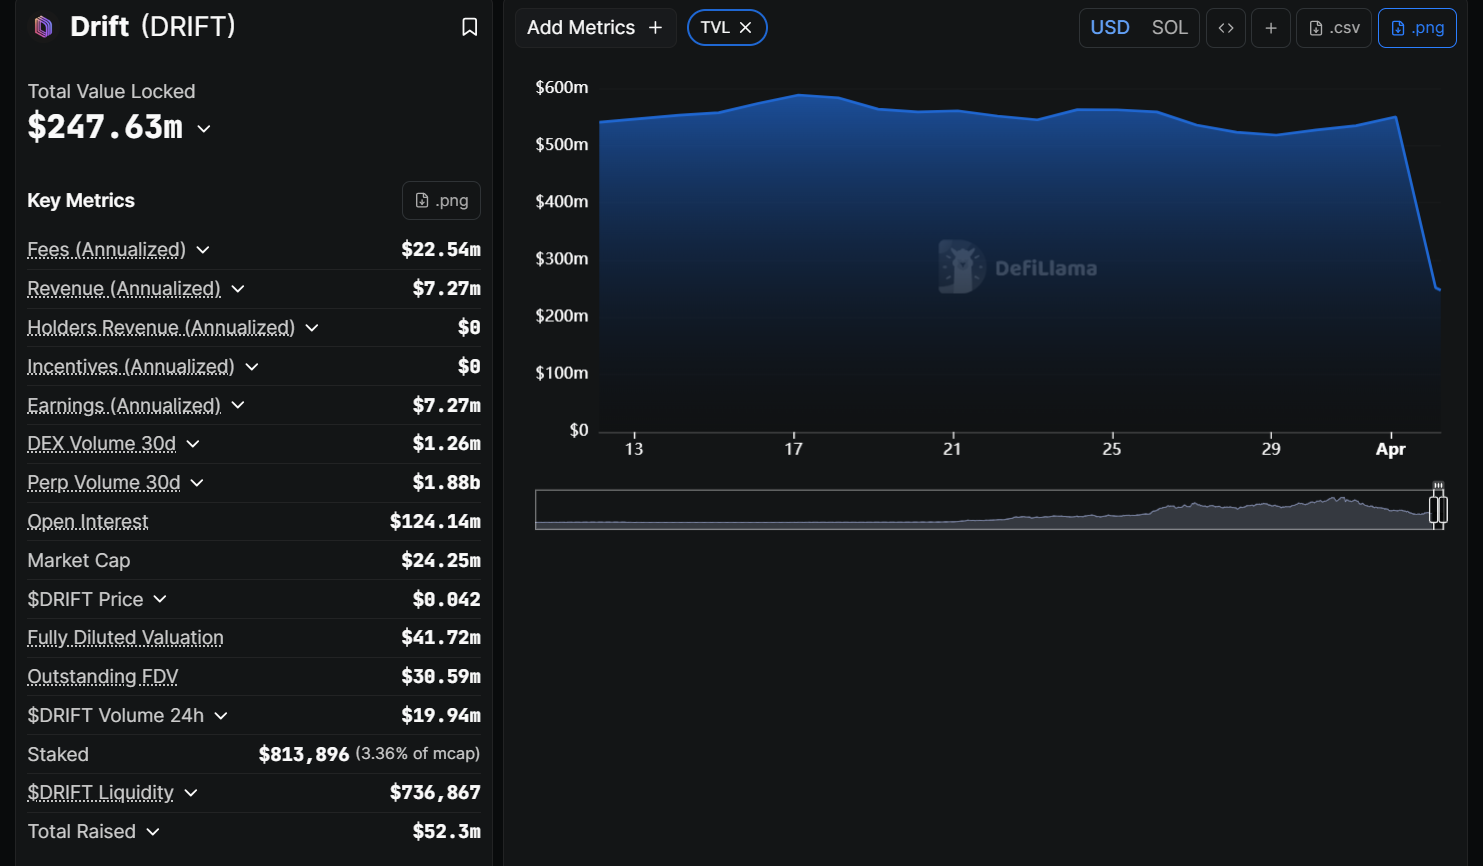
Drift Protocol, a perpetual futures platform on Solana (SOL), suffered a massive vault drain on April 1. Security firm PeckShield and blockchain analytics platform Arkham Intelligence flagged roughly $285 million in outflows from Drift’s main vault to attacker-controlled wallets.
The attacker moved stolen assets, heavily involving USDC, across multiple wallets before bridging them from Solana to Ethereum using Circle’s Cross-Chain Transfer Protocol (CCTP).
ZachXBT pointed out the transfers occurred during U.S. business hours with no intervention.
Circle was asleep while many millions of USDC were swapped via CCTP from Solana to Ethereum for hours from the 9-figure Drift hack during US hours,” the blockchain investigator stated.
Security researcher Specter echoed those concerns. He noted that the attacker held USDC across wallets for 1 to 3 hours before swapping and deliberately avoided converting to Tether (USDT) during the bridging process, suggesting confidence that Circle would not freeze the funds.
A Pattern of Contradictory Responses
The timing intensified frustration. Just days before the Drift exploit, Circle froze the USDC balances of 16 unrelated business hot wallets on March 23, as part of a sealed U.S. civil case.
That action disrupted operations for exchanges, casinos, and payment processors.
ZachXBT previously called that freeze potentially the most incompetent he had seen in over five years. He argued that, based on on-chain analysis, the wallets engaged in legitimate activity.
Circle later unfroze one wallet linked to Goated.com on March 26, but most remained locked.
The contrast is stark. Circle acted aggressively on a civil matter affecting legitimate businesses. Yet during a confirmed nine-figure exploit, it took no steps to freeze stolen funds transiting its own infrastructure.
ZachXBT also tied this behavior to Circle’s proposed optional privacy features on its upcoming Arc blockchain. He suggested those features could reduce compliance accountability further by limiting who can view transactions.
What Comes Next for Circle and Drift
On the Ethereum side, stolen assets were swapped for roughly 129,000 ETH. Drift’s total value locked collapsed from approximately $550 million to $247 million, and its native DRIFT token fell nearly 28%.
Circle has not publicly responded to the criticism. The incident has reignited debate over whether centralized stablecoin issuers can justify their freeze authority if they apply it inconsistently.
The post ZachXBT Slams Circle for Letting Millions in Stolen USDC Flow Freely After Drift Hack appeared first on BeInCrypto.


The U.S. Department of Labor released a proposed rule Monday that would open 401(k) retirement accounts to cryptocurrencies and other alternative assets – a direct implementation of President Trump’s August executive order and a structural shift that puts up to $12 trillion in retirement capital within reach of digital asset markets for the first time under a formal regulatory framework.
The proposal does not explicitly approve crypto for retirement plans. What it does is create a safe harbor for ERISA-governed plan managers who choose to include digital assets, provided they follow a defined fiduciary process – removing the single biggest legal deterrent that kept virtually every 401(k) administrator on the sidelines until now.
- Market size: Up to $12 trillion in 401(k) assets could gain access to crypto and other alternatives under the proposed rule, against a $48 trillion total U.S. retirement market.
- Safe harbor structure: Plan managers must evaluate risk/return, fees, liquidity, valuation, and complexity – but face no explicit ban or approval of specific assets.
- Timeline: A 60-day public comment period follows Federal Register publication; finalization expected within months, with Indiana’s state-level crypto mandate taking effect July 1, 2027.
- Regulatory origin: OIRA cleared the proposal March 24, 2026, marking it “economically significant” – the highest regulatory classification, signaling broad expected market impact.
Discover: Top Crypto Presales to Watch Before They Launch
How the DOL Proposal Actually Unlocks 401(k) Capital for Crypto
The mechanism is more precise than the headline suggests, and that precision matters enormously for how fast capital actually moves. Under ERISA, plan fiduciaries have always had the legal authority to consider alternative assets – the Labor Department acknowledged this directly in its statement.
The barrier was not statutory prohibition but regulatory ambiguity: a 2022 Biden-era compliance release urged plan managers to apply “extreme caution” to crypto, effectively signaling that inclusion would attract enforcement scrutiny. The DOL rescinded that guidance in May 2025, clearing the first obstacle.
The new proposal completes the regulatory architecture.
First, it defines digital assets formally as “a new form of investing that includes a wide variety of assets that can be stored and transmitted digitally, including cryptocurrencies such as bitcoin and other tokens” – giving plan administrators a documented regulatory definition to anchor their fiduciary analysis.
Second, it establishes a uniform evaluation framework requiring assessment of performance history, fee structures, liquidity profiles, valuation methodologies, and complexity disclosures.
Third, it extends ERISA’s existing fiduciary standard – care, skill, prudence, and diligence – explicitly to alternative asset selection, meaning a manager who follows the process has a defensible legal position even if the asset underperforms.
Deputy Secretary of Labor Keith Sonderling framed the shift directly: “Our rule clearly spells out that managers must evaluate any and all potential product offerings by following a prudent process.”
That framing matters because it removes the asymmetric risk that previously defined the decision – where inclusion created legal exposure and exclusion did not. Treasury Secretary Scott Bessent described the proposal as “an initial step in implementing the President’s Executive Order in a safe and smart manner, broadening access to additional retirement plan options for millions of Americans.”
The most important variable now is not regulatory intent – it is whether the comment period produces material revisions that narrow the asset definition or tighten the liquidity requirements enough to functionally exclude most crypto products.
Discover: Best Crypto Exchanges for Active Traders in 2026
The post US Labor Department Proposes Opening 401(k) Plans to Crypto appeared first on Cryptonews.
Crypto’s biggest liquidation event this week wasn’t about crypto.
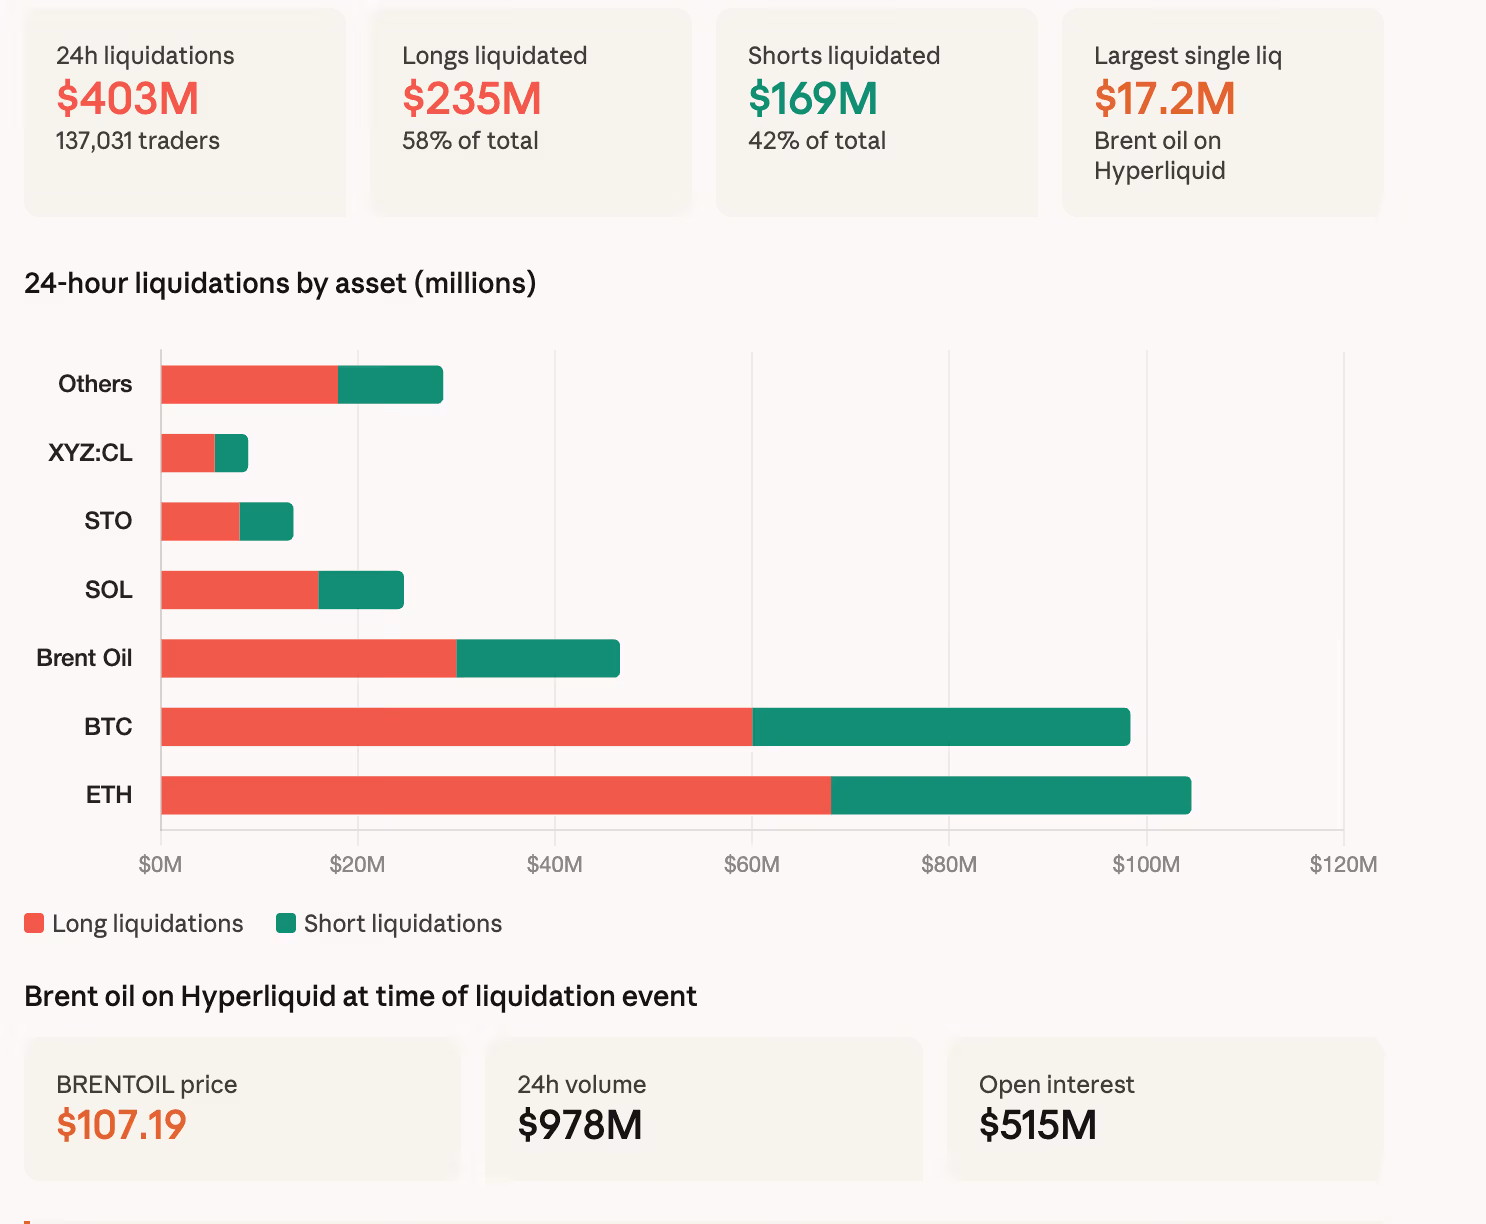
Tokenized Brent oil futures on Hyperliquid accounted for $46.6 million of the $403 million in total liquidations over the past 24 hours, according to CoinGlass data, making oil the third-largest liquidated asset behind ether at $104.5 million and bitcoin at $98.3 million. Solana came in fourth at roughly $24.7 million.
The single largest liquidation across all assets was a $17.17 million Brent oil position on Hyperliquid, not a bitcoin or ether trade. That is the second time in under 30 days that oil has produced the largest individual liquidation on a crypto venue.

The BRENTOIL-USDC contract on Hyperliquid traded at $107.19, up roughly 2% on the day, with $977 million in 24-hour volume and $515 million in open interest. For context, that open interest figure is larger than many mid-cap crypto tokens’ entire market capitalization.

The liquidations were triggered by Trump’s national address, which promised to hit Iran “extremely hard” rather than offering the de-escalation that had fueled a two-day rally. Brent crude jumped 5% to above $106 on traditional markets.
Traders who had positioned for a ceasefire, particularly those long crypto and short oil, got hit from both sides.
Of the $403 million in total liquidations across 137,031 traders, longs took the heavier hit at $234.6 million versus $168.7 million in shorts. That ratio reflects the broad selloff in risk assets after the speech reversed Tuesday’s optimism. The 4-hour window around the address saw $153.7 million liquidated, with $130.8 million from longs.
Hyperliquid’s tokenized commodity contracts, which give traders 24/7 access to oil, gold, and other macro assets with crypto-native leverage, are absorbing an outsized share of geopolitical volatility.
Tokenized oil has now been among the top five liquidated assets on at least three separate occasions since the war began, a dynamic that did not exist before Hyperliquid listed the contracts.

Ethereum price rose nearly 7% on drawing closer to the $2,200 psychological resistance level after reports suggested that the U.S.-Iran war could end soon.
Summary
- Ethereum price rose nearly 7% to $2,153, rebounding from recent losses.
- Risk sentiment improved after signals of a possible ceasefire between Iran and the U.S.
- A cup and handle pattern has formed on the daily chart.
According to data from crypto.news, Ethereum (ETH) price rose to a six-day high of $2,153 on Wednesday, April 1.
The recovery followed after the leading altcoin fell nearly 16% from its monthly high of $2,360 to $1,972 earlier on Monday. The drop occurred amid growing uneasiness in the market due to the back-and-forth attacks between the U.S. and Iran. A ripple effect of it was the blockade at the Strait of Hormuz, a key maritime corridor that has pushed oil prices to record highs.
Ethereum price rebounded following reports that Iran’s president is willing to end the war with the U.S. and Israel if certain conditions are met.
While details of the demands are still not clear at the time of writing, they have previously called for more control in the Strait of Hormuz region, compensation for wartime damages on the nation, allowing it to continue its nuclear energy program, and a guarantee that the U.S. will not launch another attack on the country.
The U.S., for its part, has also signaled a potential ceasefire with Iran, even if the Strait of Hormuz remains closed, although Gulf countries like Saudi Arabia and the UAE have urged the U.S. to continue the war until the blockade is cleared.
Later today, U.S. President Donald Trump is set to give a speech where he will share major updates on Iran relations.
Notably, the impact of a potential resolution was already felt on energy markets as WTI oil prices dropped nearly 5% shortly following the report. Simultaneously, the crypto market surged along with U.S. equities such as the S&P 500.
Signs of de-escalation have offered Ethereum traders some short-term relief, easing the bearish pressure that emerged after Google’s quantum computing research raised concerns that Ethereum’s encryption could eventually be compromised.
On the daily chart, Ethereum price has formed a cup and handle pattern, a popular bullish continuation pattern in technical analysis. ETH price has recently broken out of the handle pattern, a sign that the upward trend is resuming.
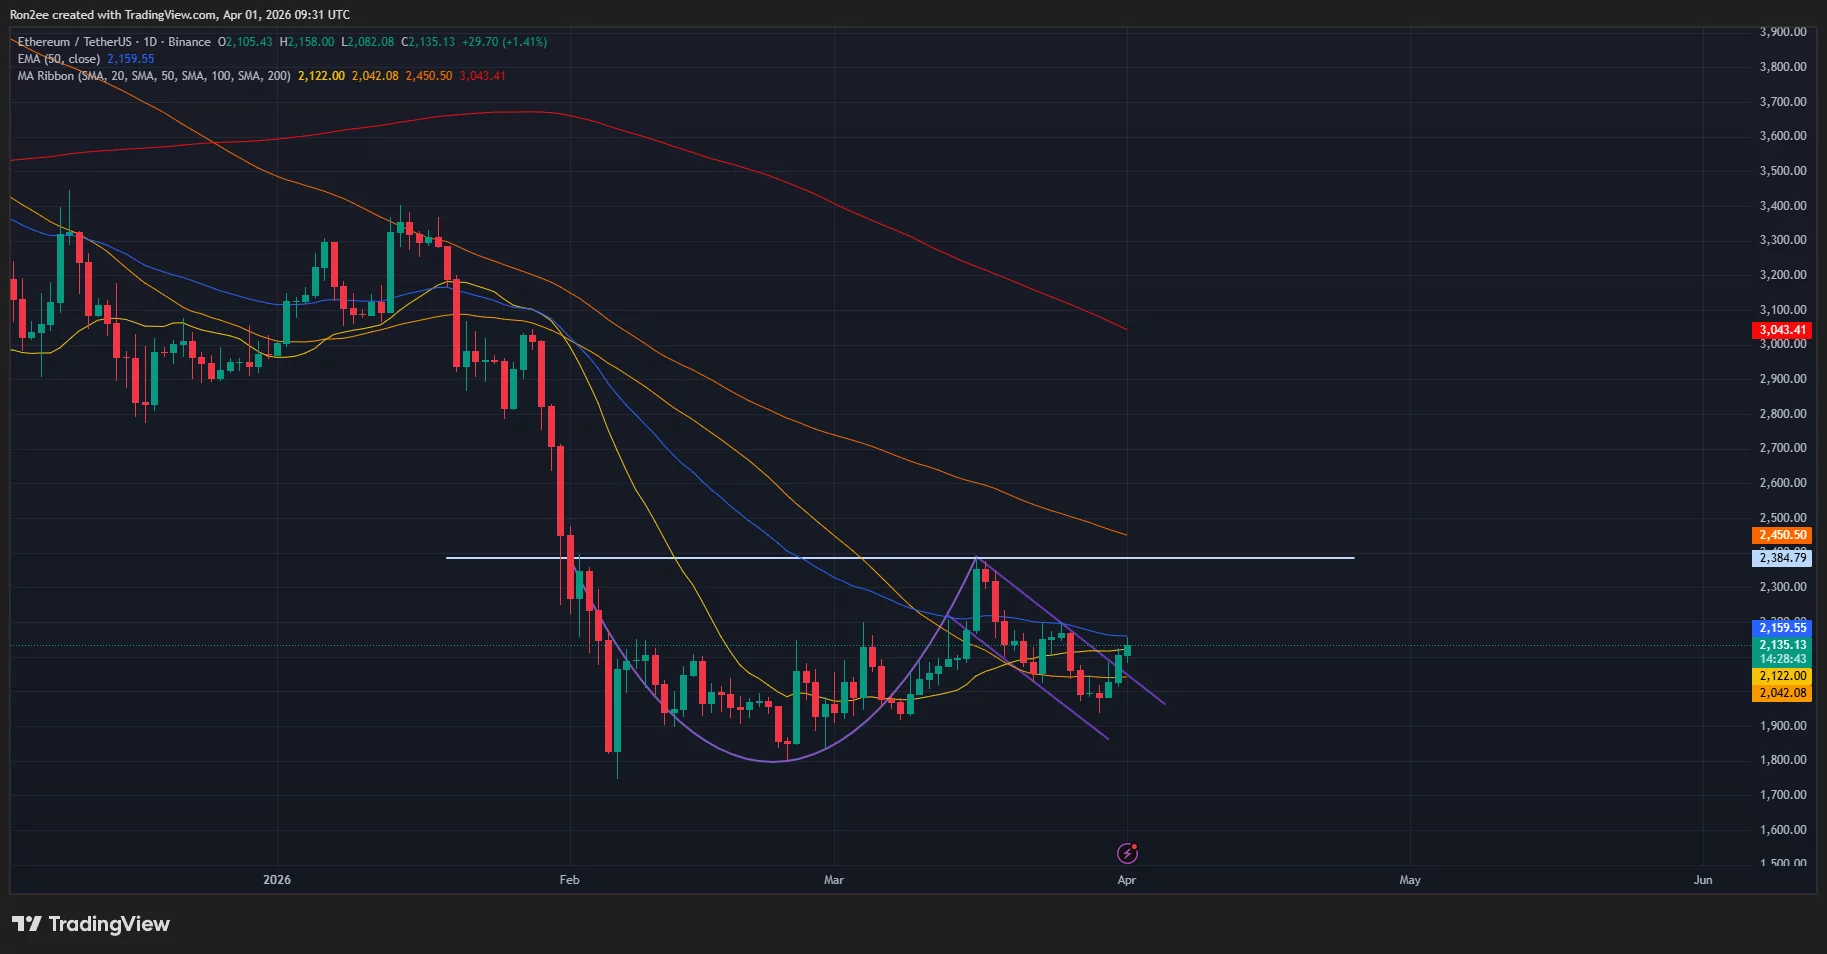
Technical indicators suggest bulls have the upper hand at the moment. Notably, the 20-day SMA has crossed above the 50-day SMA, with Ethereum price eyeing the 50-day EMA next at $2,160. Additionally, the supertrend has flashed green, indicating a buy signal.
Hence, the next immediate resistance level that traders would be keeping an eye on lies at $2,200, a level where previous selling pressure has historically intensified.
A break above this level could spur Ethereum towards the neckline of the cup and handle pattern at $2,384, with the next major target at $2,450, which coincides with the 100-day SMA.
Disclosure: This article does not represent investment advice. The content and materials featured on this page are for educational purposes only.
Crypto World
Attention bitcoin traders. These indicators matter more than what Trump says about Iran


The past four weeks have been brutal for bitcoin traders as prices keep chasing comments by President Donald Trump, who can’t make up his mind about Iran.
One day, he talks peace and BTC and risk assets go up while oil drops, the next day he talks hawkish again, sending BTC down and oil up. Meanwhile, Iran declares the Strait of Hormuz is “closed forever,” and analysts throw out wildly bullish and bearish oil targets. It’s nearly impossible to navigate this choppy environment.
Traders may be better off focusing on the following real indicators that actually matter. These, unfortunately, do not paint a positive picture for risk assets, including bitcoin.
The mid-April SPR cliff
The fate of the global economy and risk assets could hinge on the next couple of weeks as a managed oil disruption threatens to become an unmanaged one.
After the Iran war began on Feb. 28, tanker traffic through the pivotal Strait of Hormuz, which handles roughly 20% of the world’s seaborne oil trade, all but collapsed. In response, the International Energy Agency’s 32 member nations agreed to the largest coordinated strategic stock release in its 50‑year history – about 400 million barrels, later raised to 426 million as more countries pitched in.
Those emergency barrels have been offsetting a supply shortfall of roughly 4.5 to 5 million barrels per day, the gap created by the near‑shutdown of Hormuz flows.
But now those reserves are expected to hit the wall in the next couple of weeks, in which case, that manageable deficit could double to roughly 10 to 11 million barrels per day – the projected deficit due to reserve depletion and disruption of normal flows.
The House of Saud described it as “a shock of unprecedented scale with no obvious buffer left to absorb it.”
So it doesn’t matter whether Trump continues the war against Iran or stops. If oil supplies aren’t materially restored within the next two weeks, we could see massive risk aversion across both crypto and traditional financial markets.
Ship insurance premiums through Hormuz
A ship insurance premium is the payment a shipowner makes to an insurance company to protect against financial losses that could happen while operating the ship.
Insurance costs for navigating the Strait of Hormuz have increased significantly, with reports indicating rates jumping from less than 1% of ship’s value before the war to as high as 7.5% per trip. This means that a $100 million ship now has to pay around $2- $3 million in insurance, versus $250,000 before the conflict.
When premiums drop below 2%, that’s the clearest sign the route is genuinely safer, and it’s time to take risk in markets again. No press conference, briefing, or Truth Social post from Trump can replicate the certainty embedded in those prices.
Tanker traffic
Trump has at times suggested that passage through the Strait of Hormuz can be secured, but so far, there is no clear evidence that tanker traffic has returned to anything like normal volumes.
In fact, only 21 tankers have transited Hormuz since the war began, compared with more than 100 ships daily before the conflict, according to S&P Global Market Intelligence.
A sustainable rally in risk assets requires this number to pick up materially; until then, Trump’s attempts to calm markets are likely to be short-lived.
Crypto World
Dogecoin Price Stalls at $0.092 as Qubic Mining Goes Live While Pepeto Presale Fills Past $8 Million Before Listing

The dogecoin price sits at $0.092 with Qubic launching its DOGE mining mainnet on April 1, but money flow reads exactly zero. Three presale names keep dominating the conversation, and Pepeto is the first meme exchange with zero fee trading and contract screening backed by the cofounder’s track record of $11 billion. DOGE turned small entries into fortunes with zero products behind it.
More tools behind Pepeto logically reaches more than what zero tools reached, and the debate about which entry leads this cycle is already settled by the $8 million that flowed in during fear.
Qubic launched its Dogecoin mining mainnet on April 1, adding a new demand catalyst for DOGE, but money flow reads exactly zero, signaling no clear buying or selling pressure, according to BeInCrypto. DOGE sits inside a descending channel with the upper trendline converging toward $0.099.
CoinPedia confirmed the dogecoin price is also shaped by the total memecoin market cap dropping from $50 billion to $33 billion since January, with speculative assets hit hardest in this risk off environment.
Where the First Meme Exchange Outperforms While the Dogecoin Price Waits
Why Pepeto Is the First Meme Exchange With Zero Fee Trading and a Proven Track Record
Pepeto is the first meme exchange with zero fee trading and contract screening, combining the cofounder’s track record of building $11 billion with the exchange revenue and cross chain volume that pure meme coins cannot generate. The presale has raised more than $8 million at $0.000000186, and whales keep entering because the Binance listing converts presale positions into the returns the dogecoin price takes months to approach.
Just this cycle, one category of investor keeps outperforming: the ones who entered presales with real products during fear. PepetoSwap handles trades at zero cost across Ethereum, BNB Chain, and Solana. The risk scorer checks every contract.
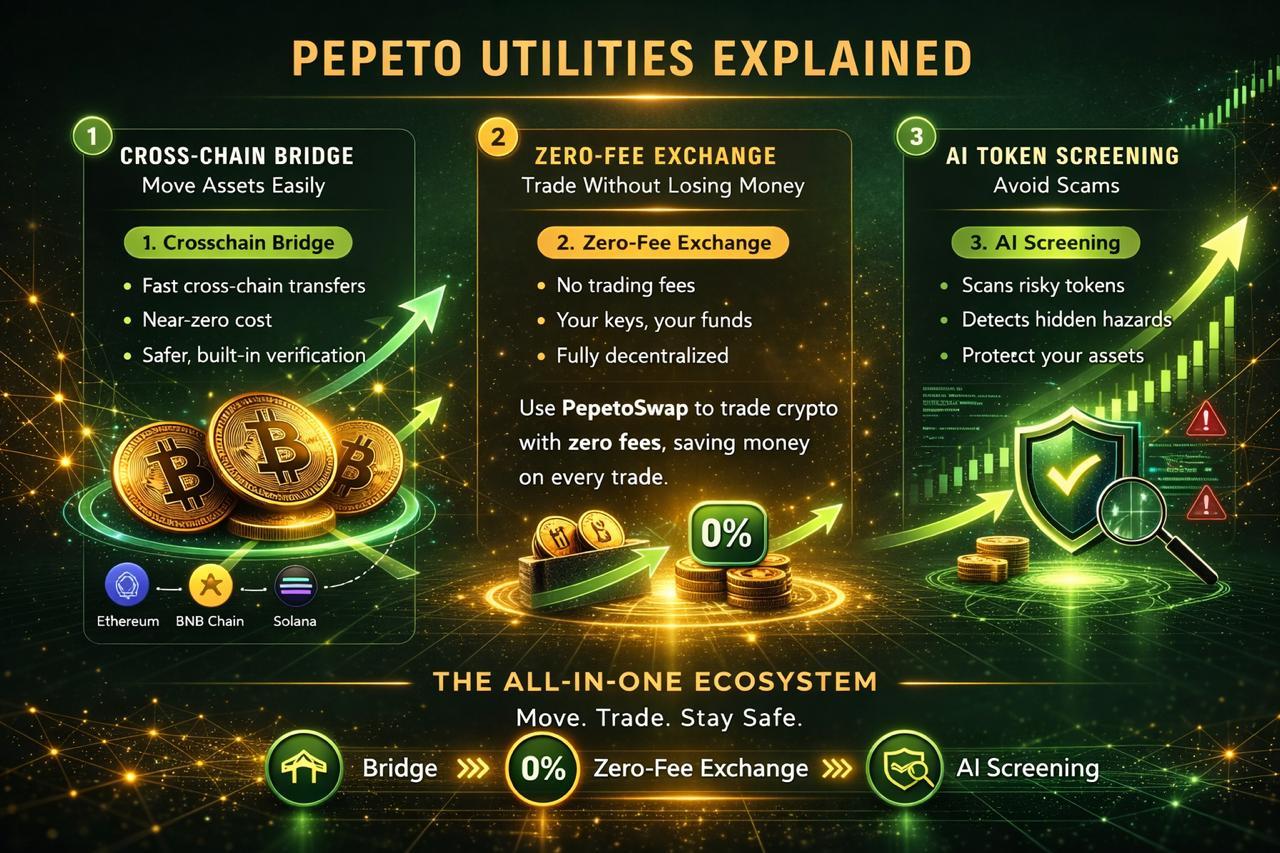
A former Binance expert structured the listing, and a SolidProof audit verified the code is clean. Holders earn 189% APY through staking, and the 420 trillion supply matches what took PEPE to $11 billion.
DOGE turned small entries into fortunes with zero products behind it. More tools behind Pepeto logically reaches more than what zero tools reached. Analysts project 100x from presale to Binance listing, and the debate about which entry leads this cycle is settled by the capital that flowed in while DOGE flatlined.
Dogecoin Price Prediction: Targets, Levels, and Mining Impact for 2026
DOGE trades at $0.092 on April 1 according to CoinMarketCap, holding above the 0.618 Fibonacci level at $0.088 inside a descending channel. Qubic’s mining mainnet is the first demand catalyst in months, but the total memecoin market cap fell from $50 billion to $33 billion since January.
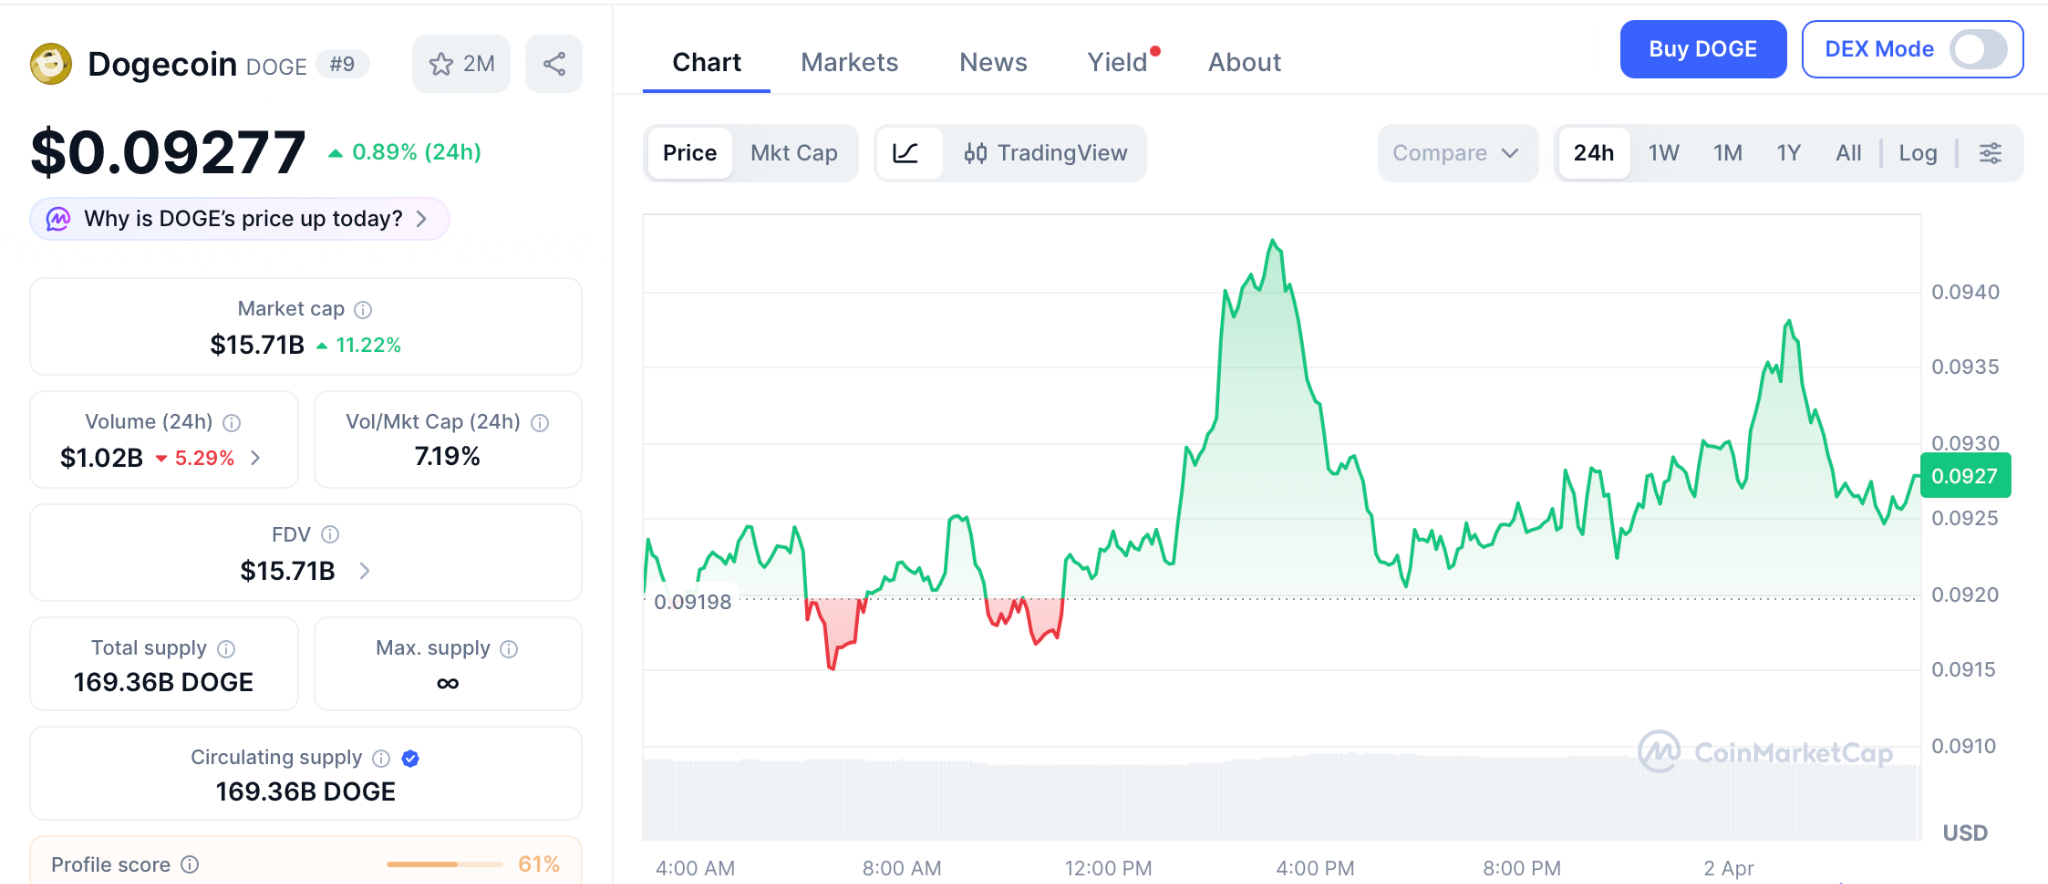
A break above $0.099 could push DOGE toward $0.12 to $0.15 resistance. Support at $0.088 must hold or the dogecoin price risks sliding to $0.07. Analyst year end targets range from $0.15 to $0.30 depending on whether meme rotation returns.
From $0.092, reaching $0.30 gives 230% over months, returns that depend on timing nobody can predict while the presale compresses 100x into one listing.
The Dogecoin Price Debate Is Settled by the Capital That Already Entered Pepeto
DOGE turned small entries into fortunes with zero products. More tools behind Pepeto logically reaches more, and $8 million during fear already settled the debate about which entry leads. The Pepeto official website shows stages filling faster each round.
Entering this presale while DOGE stalls and the Binance listing approaches is how the math that zero products proved gets multiplied by real exchange tools, and letting it pass while DOGE waits for meme rotation could be the one missed position where working products outperform everything that depends on sentiment alone.
Visit Pepeto before this presale stage closes and the Binance listing opens at a price nobody inside today will ever pay.
Click To Visit Pepeto Website To Enter The Presale

FAQs
What is the dogecoin price on April 1 2026?
DOGE trades at $0.092 with Qubic mining live and money flow at zero. Analyst year end targets range from $0.15 to $0.30 depending on meme rotation.
How does the dogecoin price affect presale entries?
Meme coins stalling creates rotation into presales. The Pepeto official website shows capital entering during fear before the Binance listing arrives.
Is Pepeto a better entry than DOGE right now?
DOGE targets 230% over months. Pepeto targets 100x to a confirmed listing with a full exchange platform and the proven track record of the PEPE cofounder.
Disclaimer: This is a Press Release provided by a third party who is responsible for the content. Please conduct your own research before taking any action based on the content.


Artificial intelligence is already reshaping industries such as finance, software, design, education and media. Music is now rapidly joining that list, as AI-assisted tools make it possible to move from concept to release in a fraction of the time and cost required by traditional production models.
A new independent experiment is now testing exactly that. The project centers on Lunayah, a virtual artist created as part of a real-world music test, and its debut single “Money Magnet”, a pop-dance track designed to blend catchy, repeatable music with mindset-driven lyrical themes.
The experiment was initiated by Vincenzo Stefanini, entrepreneur, investor and founder of Web3 Digital, a Dubai-based agency operating across digital, AI and Web3-related sectors. While Stefanini does not come from a traditional music production background, he saw AI-assisted music creation as an opportunity to test a broader idea: whether music can evolve from pure entertainment into a practical tool for repetition, emotional conditioning and affirmation-driven listening.
From Affirmations to Music
The concept behind “Money Magnet” is simple but notable. Traditional affirmations are often spoken, repeated or written as part of personal development practices. This project takes a different route by turning those repetitive positive messages into a melodic, commercial pop-dance format that is easier to replay, remember and internalize.
Instead of asking listeners to read affirmations daily, the experiment asks a different question: what happens when those same ideas are embedded into a song structure with rhythm, melody and emotional energy?
That is the central thesis behind “Money Magnet,” which explores themes of abundance, financial well-being and positive mental reinforcement without positioning itself as financial advice or a literal promise. The aim is to create music that is enjoyable first, but also intentionally structured to stay in the mind.
AI as Accelerator, Not Replacement
One of the strongest takeaways from the project is not just the song itself, but the production model behind it. What would previously have required a studio, vocalists, producers, engineers and a significantly longer timeline was instead prototyped, refined and prepared for release in just a few days with the support of AI-assisted creative tools.
That does not mean the process was fully automated or idea-free. The original concept, direction, lyrical intent, stylistic choices, branding, launch strategy and final selection decisions remained human-led. AI functioned as an accelerator, helping translate creative direction into a finished musical product far more quickly than in a conventional setup.
For founders, creators, agencies and independent brands, this may be the more important story. The barrier to producing high-quality commercial music is falling. That opens the door not only to new artists, but to a wider range of experiments, formats and business models.
A New Creative Format
While “Money Magnet” is the first release, the project is being treated as a repeatable framework rather than a one-off track. Future songs may expand beyond financial themes into other areas commonly associated with personal development and emotional focus, including health, self-confidence, love, peace of mind and motivation.
That makes the release relevant beyond the music industry itself. It also points to the growing convergence of AI, branding, audio content, personal development and direct-to-consumer digital products.
In practical terms, the same underlying workflow could be adapted for artists, creators, events, milestone celebrations, personalized songs, branded campaigns and other custom audio experiences. That alone makes the launch of “Money Magnet” more than just another independent release.
Built in Dubai, Released Worldwide
The project was developed from Dubai, a city increasingly associated with entrepreneurship, speed, experimentation and digital-first business models. In a broader environment marked by global uncertainty and rapid technological change, the release reflects a different response: building, testing and shipping rather than waiting for ideal conditions.
“Money Magnet” is being distributed across more than 25 streaming platforms, including Spotify, Apple Music, YouTube Music, Amazon Music and other major services via its global release infrastructure.
The track and project hub are available at lunayah.com, while the direct release page can be accessed at this link.
Why It Matters
AI-generated content is no longer a niche topic. The real question is not whether it can be used, but how it should be used and what kinds of new formats it can unlock. “Money Magnet” may not answer all of those questions, but it offers a practical and public example of what the next phase of music creation could look like: faster, leaner, more experimental and increasingly accessible to non-traditional creators.
Whether this evolves into a larger music brand, a new category of personalized songs, or a service model for creators and businesses, the release marks a notable shift. It shows that music creation is no longer limited to those already inside the music industry.
Listen to the track and follow the project at https://lunayah.com/.

Bitcoin has slid roughly 50% this market cycle, a markedly milder pullback than in prior cycles, according to Fidelity Digital Assets. The firm’s researchers note that post-peak declines have historically ranged from 80% to 90%, but this cycle has seen a substantially smaller drawdown.
Fidelity’s data suggest a pattern of diminishing returns when looking at price performance from the previous all-time high, a sign of a maturing market. “Each cycle has been less dramatic to the upside than the previous,” Fidelity analyst Zack Wainwright said, adding that downside risk has been less pronounced in 2026 as well.
From a price perspective, Bitcoin touched a cycle low just above $60,000 on Feb. 6, representing a drop of about 52% from the Oct. 6 all-time high near $126,000, according to TradingView. It has since traded at roughly a 46% retreat from its peak six months earlier. For context, the prior cycle featured a much deeper decline—about 77%—from the 2021 high near $69,000 to a bear-market low just below $16,000 in November 2022.
Key takeaways
- Fidelity Digital Assets’ assessment: this cycle’s drawdown (~50%) is substantially smaller than the historical 80–90% range, signaling a maturing market with potentially reduced volatility.
- Current price action: cycle low around $60k on Feb. 6, with ~52% fall from the all-time high of ~$126k and ~46% below the six-month peak.
- Historical comparison: the previous bear phase saw a sharper 77% decline to a sub-$16k trough in late 2022, underscoring a notable shift in cycle severity.
- Halving cadence and bottom timing: Alphractal founder Joao Wedson highlighted a decaying pattern where the top occurred 534 days after the last halving, implying a bottom could fall between 912 and 922 days after halving—pointing to late September or early October 2026, though this remains a cycle-based projection.
- Technical watchlist: Bitcoin remains below the 50-day and 200-day exponential moving averages, with the 200-week EMA hovering around $68,000 and acting as a historical support level during downturns.
A shallower cycle, a maturing market
Fidelity’s framework suggests that the current cycle’s more gradual drawdown and compressed upside signal a shift in market dynamics. The research implies growing institutional interest and a broader base of participants that can absorb volatility without triggering extreme selloffs. In discussing the implications, Nick Ruck, director of LVRG Research, described the development as a move toward a more stable Bitcoin—one that could pave the way for deeper adoption beyond speculative trading.
“This shift signals that Bitcoin is changing from a speculative asset toward a more stable store of value, potentially paving the way for greater adoption in the future.”
Where the chart stands and what traders are watching
Despite the shallower drawdown, Bitcoin’s price action remains cautious. The asset has been trading in a zone where traditional trend indicators—such as moving averages—still show a wrestle between momentum and consolidation. The 50-day and 200-day exponential moving averages remain as benchmarks to gauge short- and mid-term momentum, while the 200-week EMA near $68,000 has historically provided a floor during extended downturns. This confluence of levels is a focal point for traders assessing whether a new leg higher can begin or if price action will retest prior support.
Halvings, cycles, and future pacing
Wedson’s observation about the halving cycle adds a nuanced layer to the discussion. He noted that Bitcoin’s peak arrived 534 days after the last halving—a shorter interval than in the previous cycle—highlighting a “decaying pattern” across cycles. If the bottom timing aligns with his projection that bottoms may occur roughly 912 to 922 days after halving, the window would imply a potential low in late September or early October 2026. While such timing draws from historical cycle dynamics, it remains a probabilistic forecast rather than a guarantee, underscoring the uncertainty that still surrounds Bitcoin’s macro path.
That framing reinforces a broader narrative: as cycles compress and volatility bottoms, investors may rely more on structural drivers—institutional participation, macro policy, and on-chain activity—to gauge the sustainability of a new regime for Bitcoin as an asset class.
Looking ahead, market participants will be closely watching whether Bitcoin can reclaim the shorter-term moving averages and whether the observed shallower drawdown persists as macro conditions evolve. The coming months could illuminate whether the market’s maturation translates into steadier pricing, greater institutional involvement, and clearer adoption milestones—or whether fresh shocks reintroduce the volatility that defined earlier cycles.

Venture capital firm Paradigm is reportedly developing a prediction markets trading terminal aimed at professional traders and market makers, according to Fortune.
Paradigm partner Arjun Balaji is spearheading the effort, which sources say has been underway since the late 2025.
The venture capital firm has been one of the most active backers of Kalshi, a leading prediction market platform. The firm participated in three successive funding rounds for Kalshi in 2025.
The prediction market platform recently raised more than $1 billion in a new round, pushing its valuation to $22 billion.
“Matt Huang, the venture firm’s cofounder and managing partner, is on the startup’s board of directors. Paradigm’s development of a prediction markets trading terminal isn’t competitive with Kalshi’s platform, said a source,” the report read.
Follow us on X to get the latest news as it happens
Beyond the terminal, sources suggest that Paradigm has considered establishing an internal market-making desk. A separate source said the firm has also engaged researchers to explore the feasibility of creating prediction market indexes.
Meanwhile, Paradigm has started to collect prediction market data into a public dashboard.
A Sector Gaining Institutional and Retail Momentum
Paradigm’s infrastructure push arrives at a time of rapid growth. Prediction market transactions surpassed a record high of 207 million in March, according to Dune data.
Monthly notional volume reached roughly $25.7 billion, up from $1.2 billion in early 2025. Meanwhile, major exchanges are also moving into the space. Binance is beta-testing an in-app prediction market feature inside its Wallet app.
Coinbase unveiled its prediction market offering through a partnership with Kalshi in January. Moreover, Crypto.com launched a standalone platform called OG.
Subscribe to our YouTube channel to watch leaders and journalists provide expert insights
The post Paradigm Targets Pro Traders and Market Makers in Latest Prediction Markets Push appeared first on BeInCrypto.
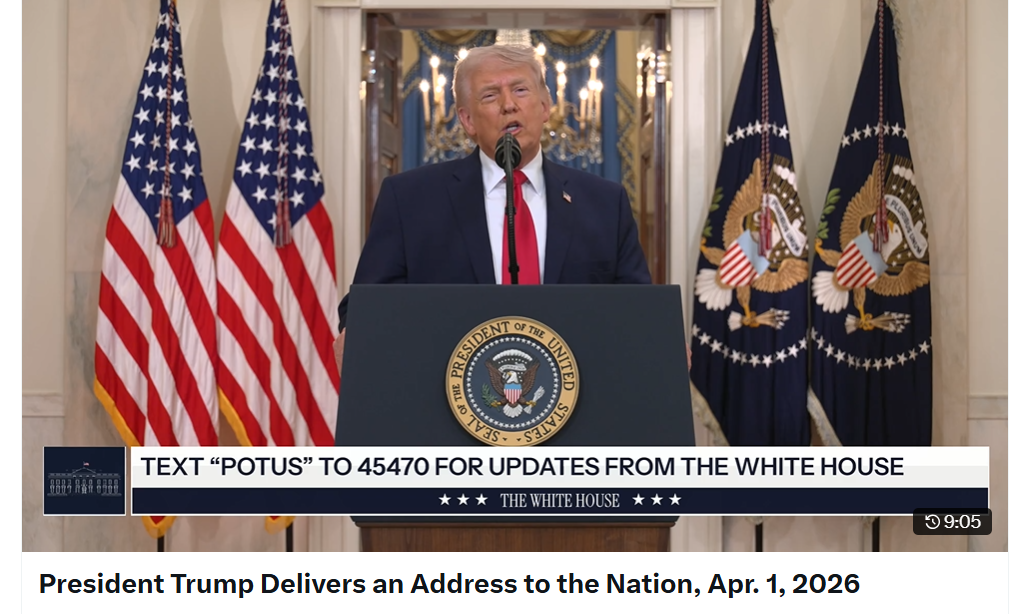
Crude oil rose to over $100 a barrel while Bitcoin fell 2% after a national address by US President Donald Trump on the conflict in Iran, where he vowed to hit Iran “extremely hard” over the next few weeks.
Speaking at the White House on Wednesday during an address to the nation, Trump said the US military is “very close” to finishing “Operation Epic Fury,” claiming to have wiped out Iran’s nuclear and naval capabilities while also significantly hampering its drones, missiles and weapon factories.
“I can say tonight that we are on track to complete all of America’s military objectives shortly. Very shortly, we are going to hit them extremely hard over the next 2 to 3 weeks.”
Stocks, crude oil, and crypto prices have been impacted by conflict in the Middle East over the last few months. Oil prices eased on Tuesday after Trump said the war would be wrapping up in the next few weeks, though his latest speech has seen it rise again.
At the time of writing, the price of crude oil has spiked back above $100 per barrel to $103.59. Meanwhile, Bitcoin dipped by around 1% over the course of the speech and has since fallen further to $66,904, down 2% since the start of the speech.
However, Trump also said discussions are ongoing. Both sides have made key demands for ending the conflict, with the US pushing for Iran to dismantle its nuclear programs, open up commercial shipping channels and stop regional support for proxy groups.
Iran wants a permanent end to the war, compensation for damages and an end to US military presence in the region, among other demands.
“The new group is less radical and much more reasonable. Yet, if during this period of time no deal is made, we have our eyes on key targets.”

Trump says oil blockade will end soon
Conflict in the Middle East intensified in February after the US and Israel launched strikes against Iran. This ultimately saw Iran respond by leading a blockade of the Strait of Hormuz in a bid to cut oil supply on one of the world’s busiest shipping channels.
Related: Who is Kevin Warsh? Trump’s Fed pick wants ‘regime change’ at central bank
The president claimed that the stock market will pick back up soon as the conflict begins to wind down, while gas prices will drop as he argued that Iran will remove the blockade “naturally” so that it can start rebuilding the economy.
“And in any event, when this conflict is over, the strait will open up naturally. It’ll just open up naturally. They’re going to want to be able to sell oil because that’s all they have to try and rebuild. It will resume flowing and the gas prices will rapidly come back down. Stock prices will rapidly go back up,” he said.

Analysis: Offshore profits push as productivity pales
ZachXBT Slams Circle for Letting Millions in Stolen USDC Flow Freely After Drift Hack

Rams WR Puka Nacua enters rehab amid assault and battery accusation: report

Smart energy pays enters the US market, targeting scalable financial infrastructure

Why Israel is blocking foreign journalists from entering

Bitcoin: We’re Entering The Most Dangerous Phase

New Financial Year, New Rules: New Financial Year Changes | New Income Tax Rules 2026 | BIG TV

How to Build Finance Dashboards with Claude in Minutes (Full Tutorial)

Financial Times: Hegseth’s broker looked to make multimillion-dollar defense investment before war
-

 Business6 days ago
Instagram, YouTube Found Responsible for Teen’s Mental Health Struggle in Historic Ruling
-
 Tech7 days ago
Intercom’s new post-trained Fin Apex 1.0 beats GPT-5.4 and Claude Sonnet 4.6 at customer service resolutions
-

 NewsBeat5 days ago
The Story hosts event on Durham’s historic registers
-

 Sports5 days ago
Sweet Sixteen Game Thread: Tide vs Michigan
-
Entertainment3 days ago
Fans slam 'heartbreaking' Barbie Dream Fest convention debacle with 'cardboard cutout' experience
-
 Entertainment4 days ago
Lana Del Rey Celebrates Her Husband’s 51st Birthday In New Post
-
Crypto World2 days ago
Dems press CFTC, ethics board on prediction-market insider trades
-

 Tech3 days ago
The Pixel 10a doesn’t have a camera bump, and it’s great
-

 Crypto World9 hours ago
Gold Price Prediction: Worst Month in 17 Years fo Save Haven Rock
-

 Sports2 days ago
Tallest college basketball player ever, standing at 7-foot-9, entering transfer portal
-

 Tech2 days ago
EE TV is using AI to help you find something to watch
-

 Tech3 days ago
Apple will hide your email address from apps and websites, but not cops
-

 Tech2 days ago
Flipsnack and the shift toward motion-first business content with living visuals
-

 Tech2 days ago
How to back up your iPhone & iPad to your Mac before something goes wrong
-

 Fashion7 days ago
En Vogue in Brown Leather and Tailored Neutrals by Atelier Savoir, Styled by J Bolin
-

 Politics2 days ago
Should Trump Be Scared Strait?
-

 Crypto World2 days ago
U.S. rule change may open trillions in 401(k) funds to crypto
-

 Fashion7 days ago
What Are Your Favorite T-Shirts for the Weekend?
-

 Fashion6 days ago
Weekly News Update, 3.27.26 – Corporette.com
-

 Fashion4 days ago
Amazon Sundays: Soft Spring Layers
You must be logged in to post a comment Login