
Crypto World
Ethereum Price Just Bounced Off a Multi-Year Trendline That Called Every Bear Market Bottom Since 2019: Is a 3x Rally Coming?

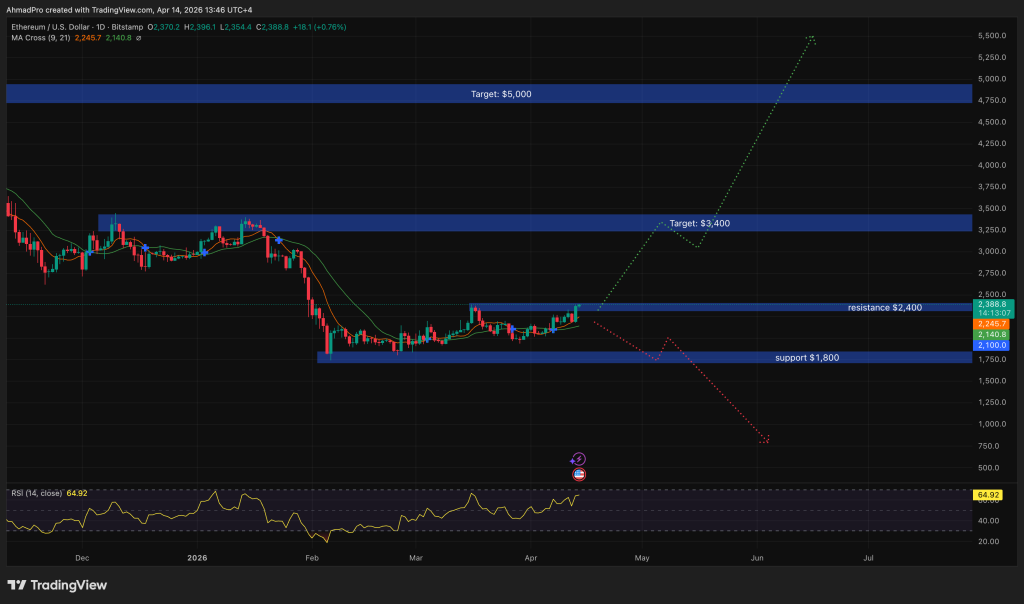
Ethereum price is trading at $2,355 in April 2026, up 8.09% on the monthly chart after the $2,000 monthly low was tested and held a multi-year ascending support trendline connecting every major ETH bear market bottom since 2019.
The bounce is in progress. What traders are now watching is whether it has structural legs or simply marks a temporary reprieve before the next leg lower.

Ethereum Price Prediction: Multi-Year Trendline Holds, But Can ETH Reclaim Its SMAs?
The ascending support trendline on ETH’s monthly chart is not a recent construction. It connects the 2019 base, the 2020 pre-rally accumulation zone, and the 2022 cycle bottom, making it the deepest and most tested structural floor in Ethereum’s price history.
The April monthly candle printed a long lower wick at that trendline, a candlestick structure that signals demand absorption at scale. Price has since recovered to the $2,400 area, forming a positive monthly body above the line.
The monthly MACD (12,26,9) adds the critical secondary signal. The MACD line sits at -29.45 and the signal line at, 159.35, producing a histogram reading of positive 129.89, the first positive monthly histogram since Ethereum’s descent accelerated from its August 2025 high near $4,800.
Both lines remain in negative territory, meaning the macro trend has not reversed. But a histogram turning positive at a multi-year trendline test is historically consistent with momentum inflecting before price does on the longer timeframe. The chart is mending. It hasn’t healed.
On the upside, two SMAs define the recovery corridor. The SMA 50 at $2,440.86 is the immediate resistance and the first target that would shift the moving average ribbon from fully bearish.
The SMA 20 at $2,857.71 is the extended objective, a return to where both SMAs converged before the 2025 breakdown. This broader technical structure in Ethereum long-term price chart has historically preceded significant recoveries when macro momentum aligns with structural support.
The buy walls flanking the $2,000–$2,100 zone are supported by on-chain data.
CryptoQuant contributor Arab Chain reported that whales withdrew over 120,000 ETH from centralized exchanges in early March, the largest single outflow since October 2025, a pattern consistent with accumulation near structural support rather than distribution.
Exchange reserves hit multi-month lows as that supply moved off-platform, compressing available sell-side liquidity precisely where the trendline sits.
Perpetual futures showed a slightly positive funding rate as of April 12, indicating measured but persistent long-side demand. The Ethereum Foundation staked 45,000 ETH on April 5, targeting a total of 70,000 ETH, generating an estimated $3.9 to $5.4 million annually in yield while removing immediate circulating sell pressure.
Crypto analyst Leshka posted on X that ETH “will 3x-4x in the next six months,” citing the developing supply squeeze as evidence of a structural base forming – a view that gains more grounding with the monthly MACD now confirming improving momentum.
Ethereum’s Glamsterdam upgrade, scheduled for H1 2026, adds a forward catalyst: targeting a significant gas limit increase, parallel transaction execution, and enshrined proposer-builder separation that is expected to materially reduce Layer-2 costs.
Invalidation is unambiguous. A monthly close below $2,017.09 breaks the trendline outright and shifts the macro structure bearish, with $1,500 the next level of consequence.
Discover: Macro context shaping crypto technical setups right now
Liquidchain Targets Early-Mover Upside as Ethereum Tests Key Levels
ETH’s recovery potential is real – a move from $2,255 to the SMA 20 at $2,857 represents roughly 27% upside from current levels. For a large-cap asset with a market cap measured in hundreds of billions, that’s a meaningful return. The mathematical ceiling, however, is what it is.
Traders seeking asymmetric exposure at this stage of the cycle are increasingly looking at early-stage infrastructure projects positioned around Ethereum’s scaling roadmap.
Liquidchain (LQC) is one project drawing attention in this context, a Layer-3 execution environment designed to aggregate liquidity across Ethereum and its rollup ecosystem, with a technical architecture specifically targeting the throughput bottlenecks that Glamsterdam addresses at the base layer.
The presale has raised over $660K at a current token price of $0.0147, with staking rewards available to early participants.
The project’s core differentiator is its unified liquidity routing across fragmented L2 environments, a structural problem that grows in relevance as Ethereum’s rollup ecosystem expands post-Glamsterdam. Presale investments carry real risk, and this is an early-stage L3 infrastructure project with meaningful execution uncertainty. DYOR applies unconditionally.
Explore the Liquidchain presale here
The post Ethereum Price Just Bounced Off a Multi-Year Trendline That Called Every Bear Market Bottom Since 2019: Is a 3x Rally Coming? appeared first on Cryptonews.


The curated art platform says its infrastructure has already been spun down with no plans to come back online.
Foundation, the Ethereum-based NFT marketplace, is shutting down for good after a failed acquisition by digital art display company BlackDove.
Founder Kayvon Tehranian announced the closure in a post on X, explaining that a deal to sell the platform to a buyer “who intended to continue its operations” fell through, and the company does not believe another buyer is worth pursuing.
“Our goal in pursuing a sale was always to see Foundation live on,” Tehranian wrote. “That’s no longer possible. As part of our wind-down process, our infrastructure has already been spun down, and we’re not in a position to bring the platform back online.”
The announcement marks the final chapter in a drawn-out unraveling that began in January, when Tehranian transferred ownership of Foundation to BlackDove. At the time, he framed the move as a transition to a leadership committed to the platform’s long-term future, noting that Foundation had facilitated roughly $230 million in primary sales since its launch and had hosted landmark auctions for artists like Jen Stark, James Jean, and Edward Snowden.
But BlackDove’s involvement was short-lived. The company later said full due diligence was only completed after the operational handover, and BlackDove ultimately concluded that building its own proprietary marketplace was a more viable path.
Foundation’s closure adds to a growing list of NFT platform shutdowns that have accelerated since 2024. MakersPlace, KnownOrigin, RTFKT, Nifty Gateway, and X2Y2 have all wound down operations as monthly NFT trading volumes collapsed from $2.9 billion at the 2021 peak to just $23.8 million by early 2025. Surviving platforms like OpenSea have pivoted aggressively toward fungible token trading to stay afloat.
The shutdown also raises familiar questions about the permanence of NFT media hosted on centralized infrastructure, an issue The Defiant raised as early as 2021. Tehranian said Foundation plans to continue pinning IPFS-hosted media and metadata for another year, but urged the community to take responsibility for personally pinning assets they care about. Users with NFTs listed on Foundation’s marketplace smart contract will need to unlist and retrieve them.
This article was written with the assistance of AI workflows. All our stories are curated, edited and fact-checked by a human.

The US House of Representatives rejected a War Powers Resolution on Iran by a 213-214 vote today, preserving President Donald Trump’s authority to continue military operations.
The narrow defeat came as Trump simultaneously announced a 10-day ceasefire between Israel and Lebanon, positioning himself as a peacemaker even as Congress debated constraints on his war powers.
War Powers Vote Falls One Short
Rep. Gregory Meeks (D-NY) introduced H.Con.Res. 40 to force the withdrawal of US Armed Forces from hostilities with Iran without explicit congressional authorization. The measure failed along largely partisan lines.
Rep. Jared Golden (D-ME) was the lone Democrat to vote against the resolution, siding with Republicans. Meanwhile, Rep. Thomas Massie (R-KY), a frequent critic of expansive executive war powers, crossed party lines to support it. Rep. Warren Davidson (R-OH) voted “present.”
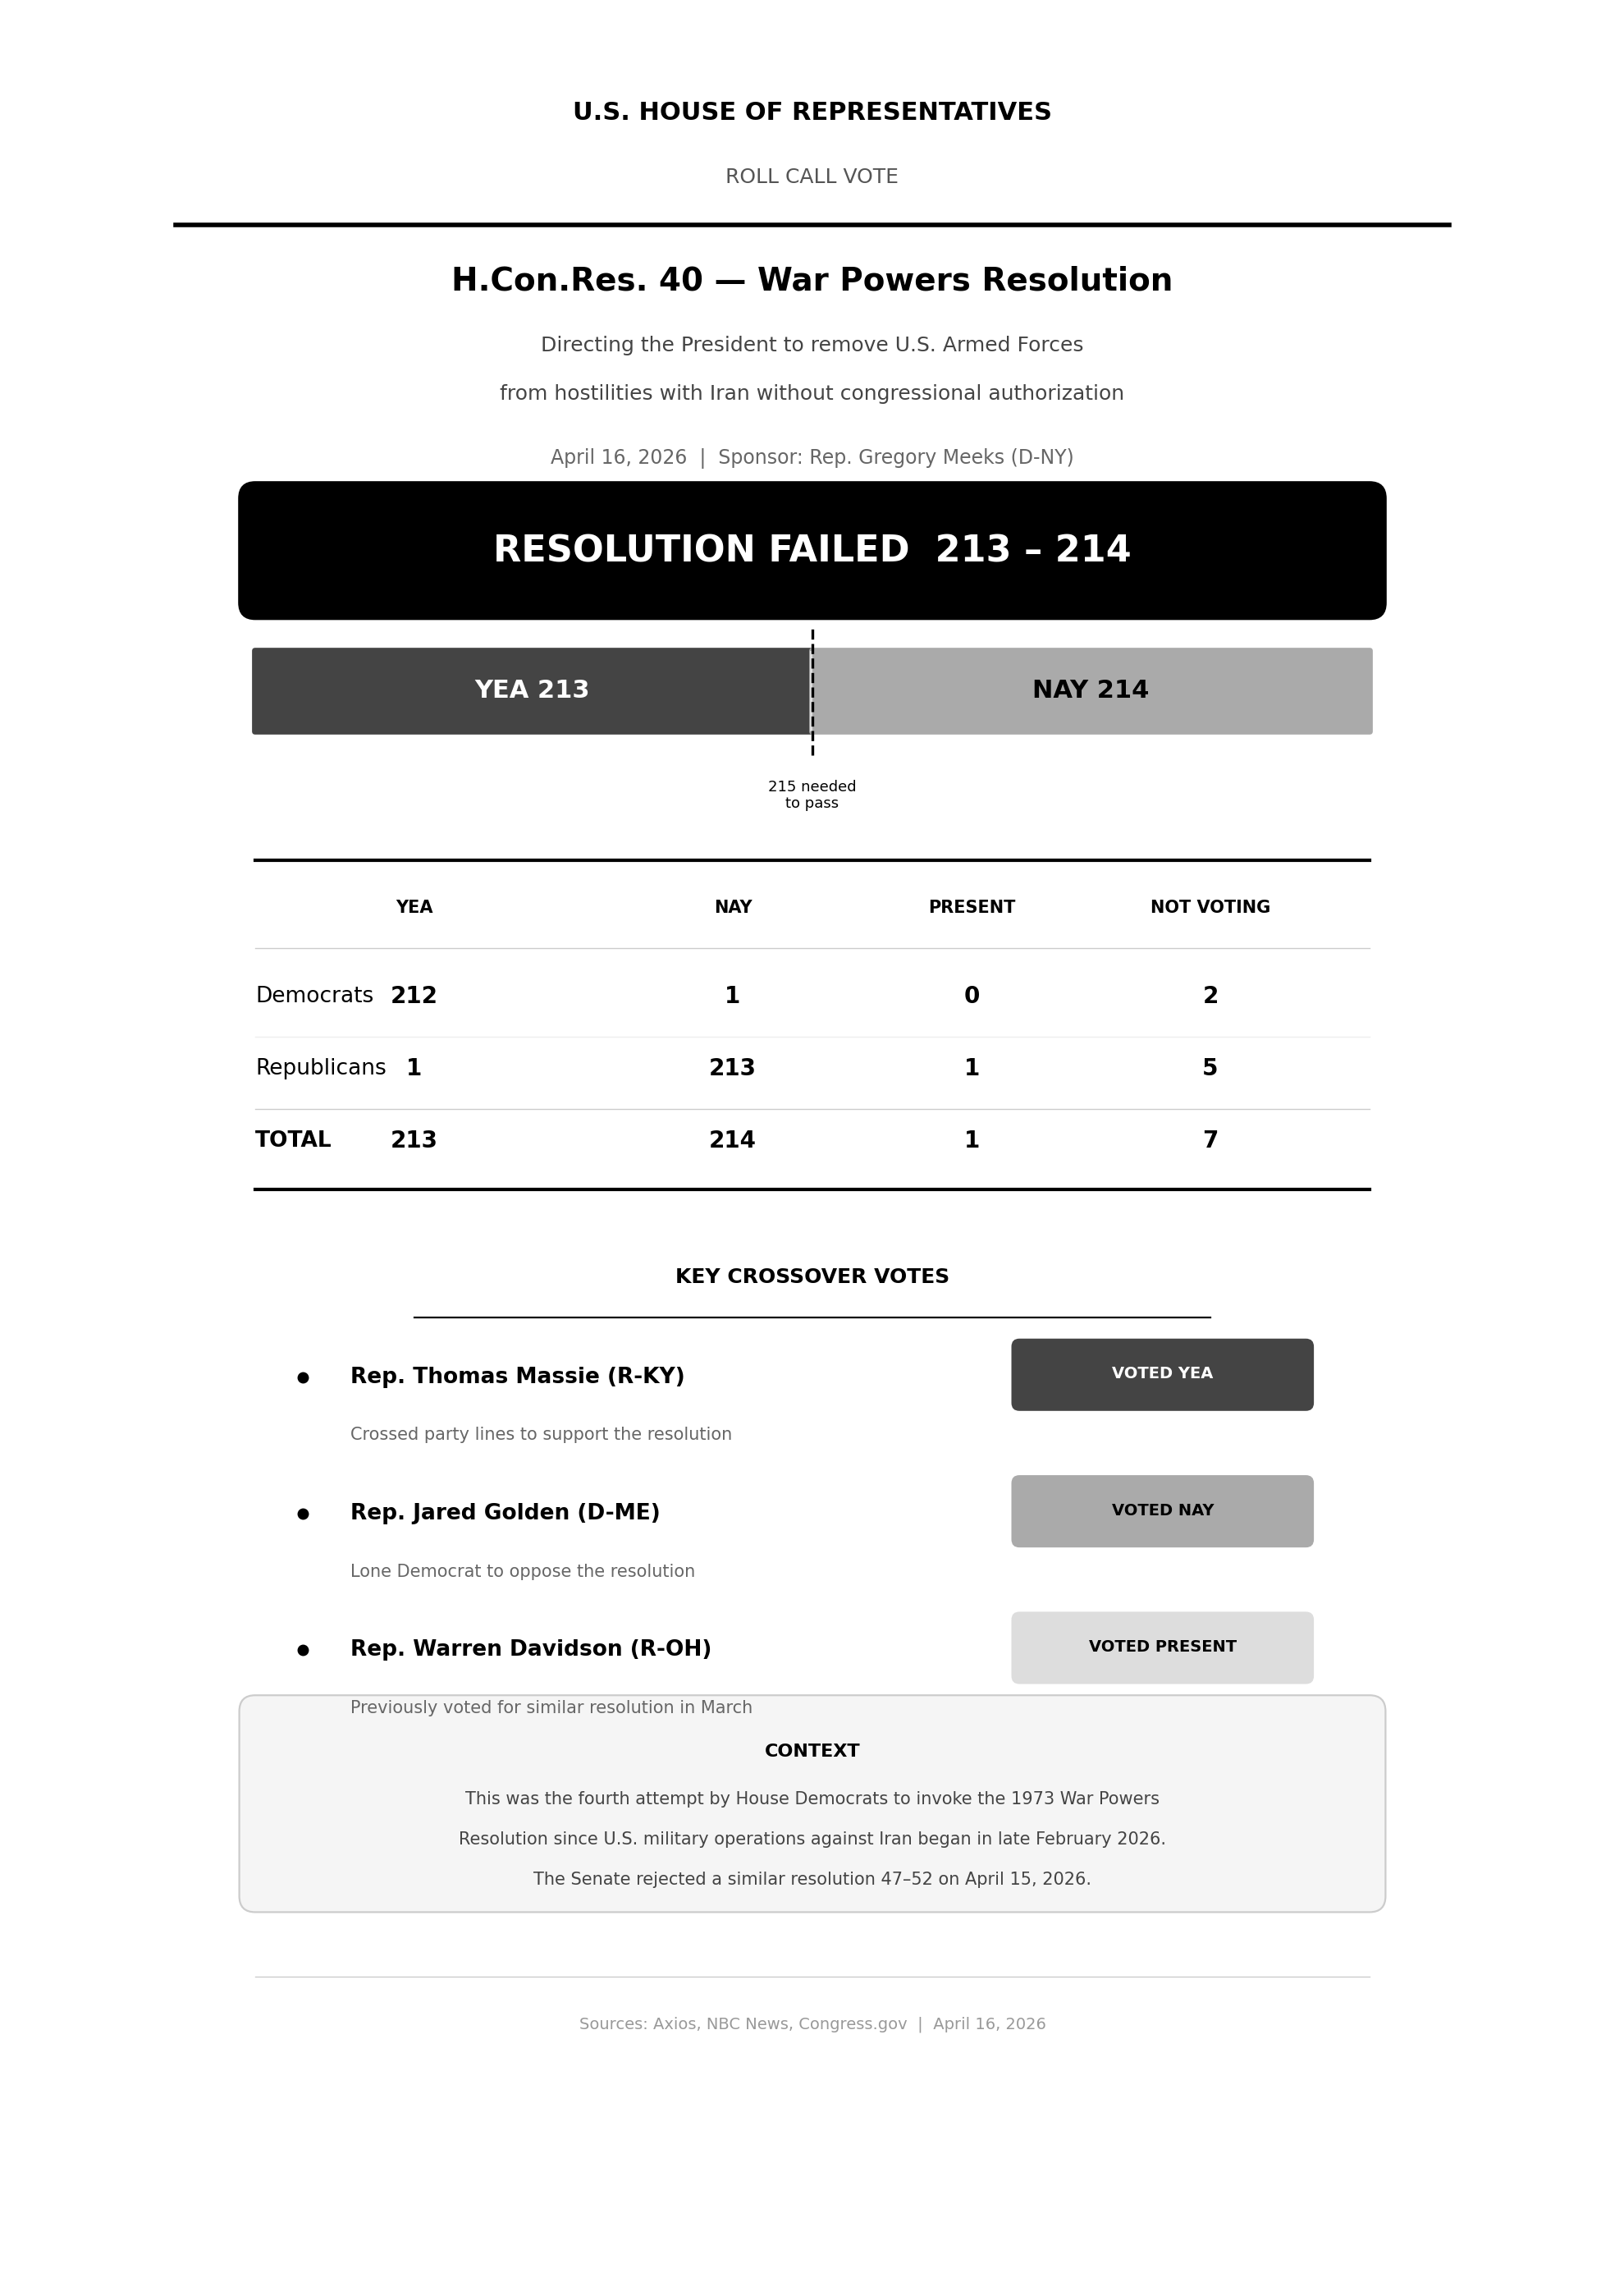
The Senate rejected a similar resolution 47-52 a day earlier. Democrats have now forced at least four such votes in both chambers since the Iran conflict began in late February, all failing along partisan lines.
Trump Announces Israel-Lebanon Ceasefire
Hours before the vote, Trump announced that Israeli Prime Minister Benjamin Netanyahu and Lebanese President Joseph Aoun had agreed to a 10-day ceasefire starting at 5 p.m. EST.
The deal followed the first direct talks between the two countries in 34 years, held in Washington with Secretary of State Marco Rubio.
Trump said he would invite both leaders to the White House for what he called the first meaningful talks between Israel and Lebanon since 1983.
European Commission President Ursula von der Leyen welcomed the truce, urging “a path to permanent peace” and full respect of Lebanon’s sovereignty.
Energy Crisis Deepens Alongside Conflict
The International Energy Agency warned that Europe holds just six weeks of jet fuel supply as the Iran conflict disrupts global energy flows.
IEA Executive Director Fatih Birol described the situation as the largest energy crisis the agency has ever tracked.
Dutch airline KLM has already cancelled 80 flights over the next month due to rising fuel costs. Jet fuel prices across Europe have surged by over 100% since the war began.
Gulf and European officials now estimate the U.S. may need six months to reach a deal with Iran, suggesting the energy shock could extend well into summer.
Whether the Israel-Lebanon ceasefire eases broader regional tensions or simply shifts attention remains the open question for markets.
The post Trump Announces Israel and Lebanon Ceasefire, But Oil Crisis Deepens appeared first on BeInCrypto.
Market analysts said Bitcoin’s (BTC) latest rally to $76,000 was a “clear momentum shift,” confirming a short-term uptrend for BTC price.
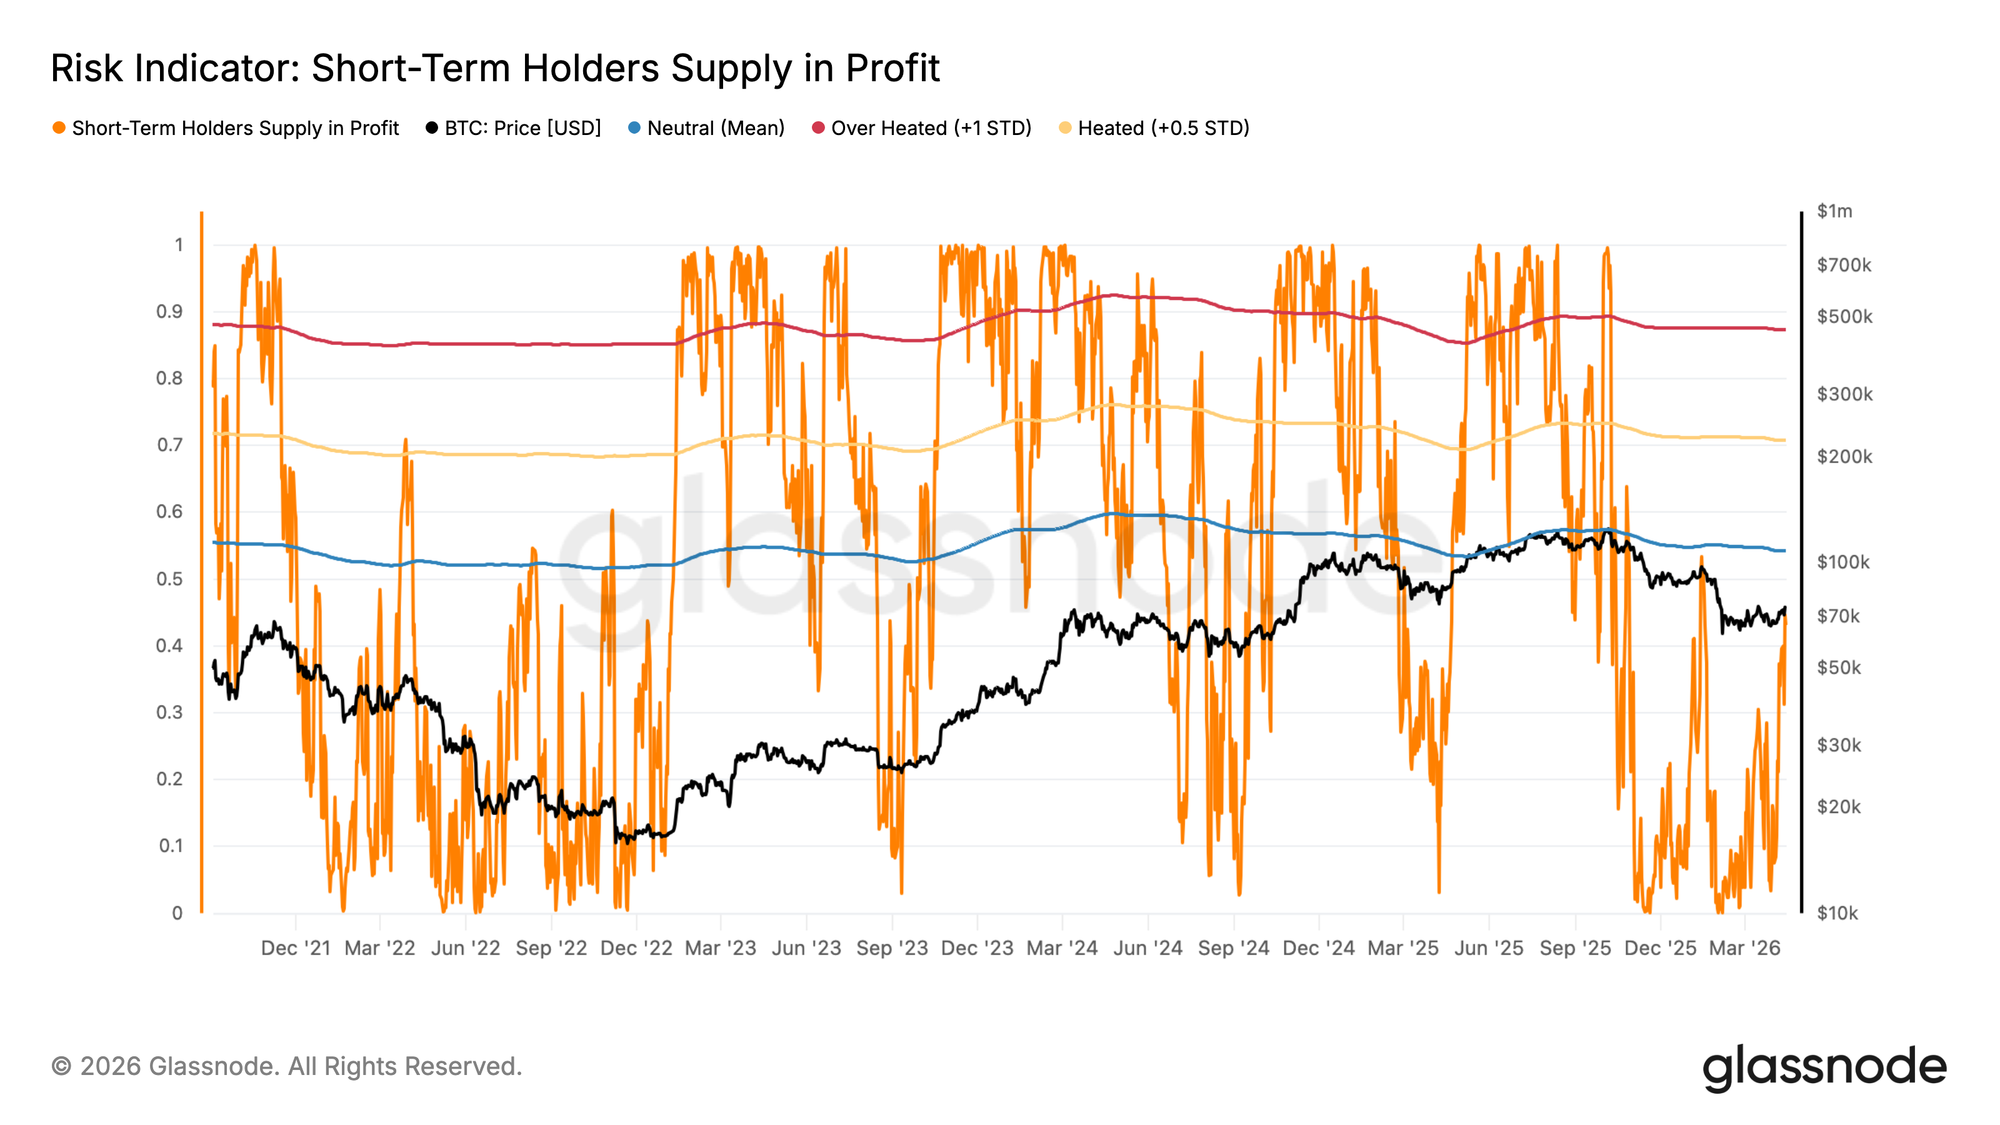
Bitcoin’s short-term holder (STH) supply in profit, a measure of the share of recently acquired coins currently held at an unrealized gain, suggests that BTC/USD has not exhausted its bear market rally, data from Glassnode shows.
Local tops in bear market rallies have historically formed when this metric approaches its statistical mean of 54.2%, a threshold where the concentration of profitable STHs becomes sufficient to trigger meaningful distribution.
Currently at 43.2%, the STH supply in profit remains “meaningfully below that threshold, suggesting the present rally has not yet reached the zone of typical exhaustion,” Glassnode said in its latest Week Onchain newsletter, adding:
“This leaves slight room for further upside toward the True Market Mean, while also providing a quantitative level to monitor as price advances.”

Meanwhile, Bitcoin has remained in “deep under extension territory” relative to its 50-week simple moving average (SMA), currently at $96,800, analyst McKenna said in a recent post on X.
Related: Bitcoin traders cash out 63K BTC profit as price rallied above $76K: Will the market rebound?
When markets deviate either to the upside or downside, they usually revert back to their mean.
Combined with “clear momentum shifts and bullish trending signals firing then I would be inclined to be directionally bullish here, the analyst said, adding:
“BTC breaking above $74K and holding this level on a HTF is the final trigger I want to see to be confident in mid to high 80s over the coming weeks.”

Fellow analyst Bitcoin Archive focused on the falling US dollar index, saying that it provides a “massive tailwind for the next leg up” for Bitcoin.

As Cointelegraph reported, several metrics support Bitcoin’s potential to rise higher, including increasing network activity and a strengthening technical setup.
Onchain data reveals key Bitcoin price levels to watch
Bitcoin’s 41% drawdown from its $126,000 all-time high has seen the BTC/USD pair drop below key pricing levels, including the active realized price at $85,100, the STH cost basis at $80,950 and the true market mean currently at $78,140.
At $74,000, Bitcoin is 5.2% below the true market mean, a metric tracking the cost basis of active BTC supply.
While the price is yet to “test and stabilize above this key threshold, the probability of a spike toward and potentially above it remains considerable in the mid-term,” Glassnode added.

The importance of this resistance level is reinforced by cost basis distribution. The heatmap below shows that over 200,000 BTC were acquired for around $78,000.

On the downside, the first major support is at $72,000, where the 20-day and 50-day exponential moving averages (EMAs) appear to converge. It is also where investors bought approximately 220,000 BTC.
Lower than that, the $65,000-$70,000 demand zone is a key area to watch. This price band has historically served as a vital support level, as seen between October and November 2024, providing a launching pad for the October 2024-January 2025 rally.
As Cointelegraph reported, a drop below the $70,000 would suggest the bears are back in control, increasing the prospects of a drop toward $60,000.
This article is produced in accordance with Cointelegraph’s Editorial Policy and is intended for informational purposes only. It does not constitute investment advice or recommendations. All investments and trades carry risk; readers are encouraged to conduct independent research before making any decisions. Cointelegraph makes no guarantees regarding the accuracy or completeness of the information presented, including forward-looking statements, and will not be liable for any loss or damage arising from reliance on this content.

NVIDIA Ising has launched as the world’s first family of open-source quantum AI models, targeting the two biggest engineering bottlenecks in quantum computing: processor calibration and error correction decoding.
Summary
- NVIDIA Ising delivers up to 2.5x faster and 3x more accurate quantum error correction decoding than current open-source benchmarks, with calibration workflows shrinking from days to hours.
- The model family includes Ising Calibration, a 35-billion-parameter vision-language model, and Ising Decoding, a 3D convolutional neural network framework, both available on GitHub and Hugging Face.
- Early adopters include Fermi National Accelerator Laboratory, Harvard, IQM Quantum Computers, Lawrence Berkeley National Laboratory, and the UK National Physical Laboratory.
NVIDIA Ising launched April 15, 2026, as the world’s first open-source AI model family purpose-built for quantum computing, providing researchers and enterprises with tools to address processor calibration and error correction, the two engineering barriers standing between today’s fragile qubits and large-scale useful quantum systems.
The models achieve up to 2.5x faster and 3x more accurate quantum error correction decoding compared to pyMatching, the current open-source benchmark.
The family has two domains. Ising Calibration is a 35-billion-parameter vision-language model that automates quantum processor tuning, compressing calibration workflows that previously required days of manual setup to hours of automated execution. Ising Decoding is a 3D convolutional neural network framework for real-time quantum error correction, available in two variants optimized for either speed or accuracy depending on the application.
Both models are distributed through GitHub, Hugging Face, and NVIDIA’s build.nvidia.com platform, integrated with CUDA-Q and NVQLink. NVIDIA is also releasing a quantum workflow cookbook, training datasets, and hardware-specific fine-tuning tools so researchers can adapt the models to their own quantum processor architectures without exposing proprietary data.
Jensen Huang, NVIDIA’s founder and CEO, framed the launch in infrastructure terms. “AI is essential to making quantum computing practical. With Ising, AI becomes the control plane, the operating system of quantum machines, transforming fragile qubits to scalable and reliable quantum-GPU systems,” he said.
Who Is Already Using It
Adoption at launch spans a range of institutions including Academia Sinica, Fermi National Accelerator Laboratory, Harvard’s John A. Paulson School of Engineering and Applied Sciences, IQM Quantum Computers, Lawrence Berkeley National Laboratory’s Advanced Quantum Testbed, Sandia National Laboratories, UC San Diego, the UK National Physical Laboratory, and Yonsei University.
The breadth of early adopters reflects a deliberate open-model strategy. By releasing pre-trained weights, training frameworks, and benchmarks publicly, NVIDIA positions Ising as a foundation layer that other developers can build on without starting from scratch.
Crypto and AI Market Implications
The Ising launch reinforces NVIDIA’s positioning as the dominant infrastructure provider across both classical AI and the emerging quantum-classical hybrid computing stack. For the crypto sector, quantum computing has long represented a future threat to existing blockchain encryption standards, particularly RSA and elliptic curve cryptography used to secure Bitcoin wallets.
Progress in quantum error correction, which Ising specifically targets, is the technical precondition for cryptographically relevant quantum computers to exist. The timeline remains distant, but every improvement in error correction decoding accuracy shortens it.
NVIDIA news has historically triggered moves in AI tokens across the crypto market, as the chip company’s hardware underpins the AI infrastructure that powers many blockchain AI projects. The Ising launch adds a new quantum AI vertical to that relationship.

Pi Network (PI) announced it has surpassed 18 million identity-verified users, positioning the figure as a structural advantage over networks that measure growth by wallet count alone.
The post from the Pi Core Team argued that verified identities are necessary for any transfer of value.
How Pi Verified 18 Million Identities
Pi’s in-app KYC system pairs human reviewers with AI-assisted fraud detection. More than 1 million validators processed 526 million verification tasks to confirm approximately 18 million unique identities.
Each submission passed through roughly 30 individual checks before approval.
The network recently completed its first validator reward distribution, paying out 26.5 million PI to participants. Validators earned about 0.05 PI per task, approximately 22 times the standard mining rate.
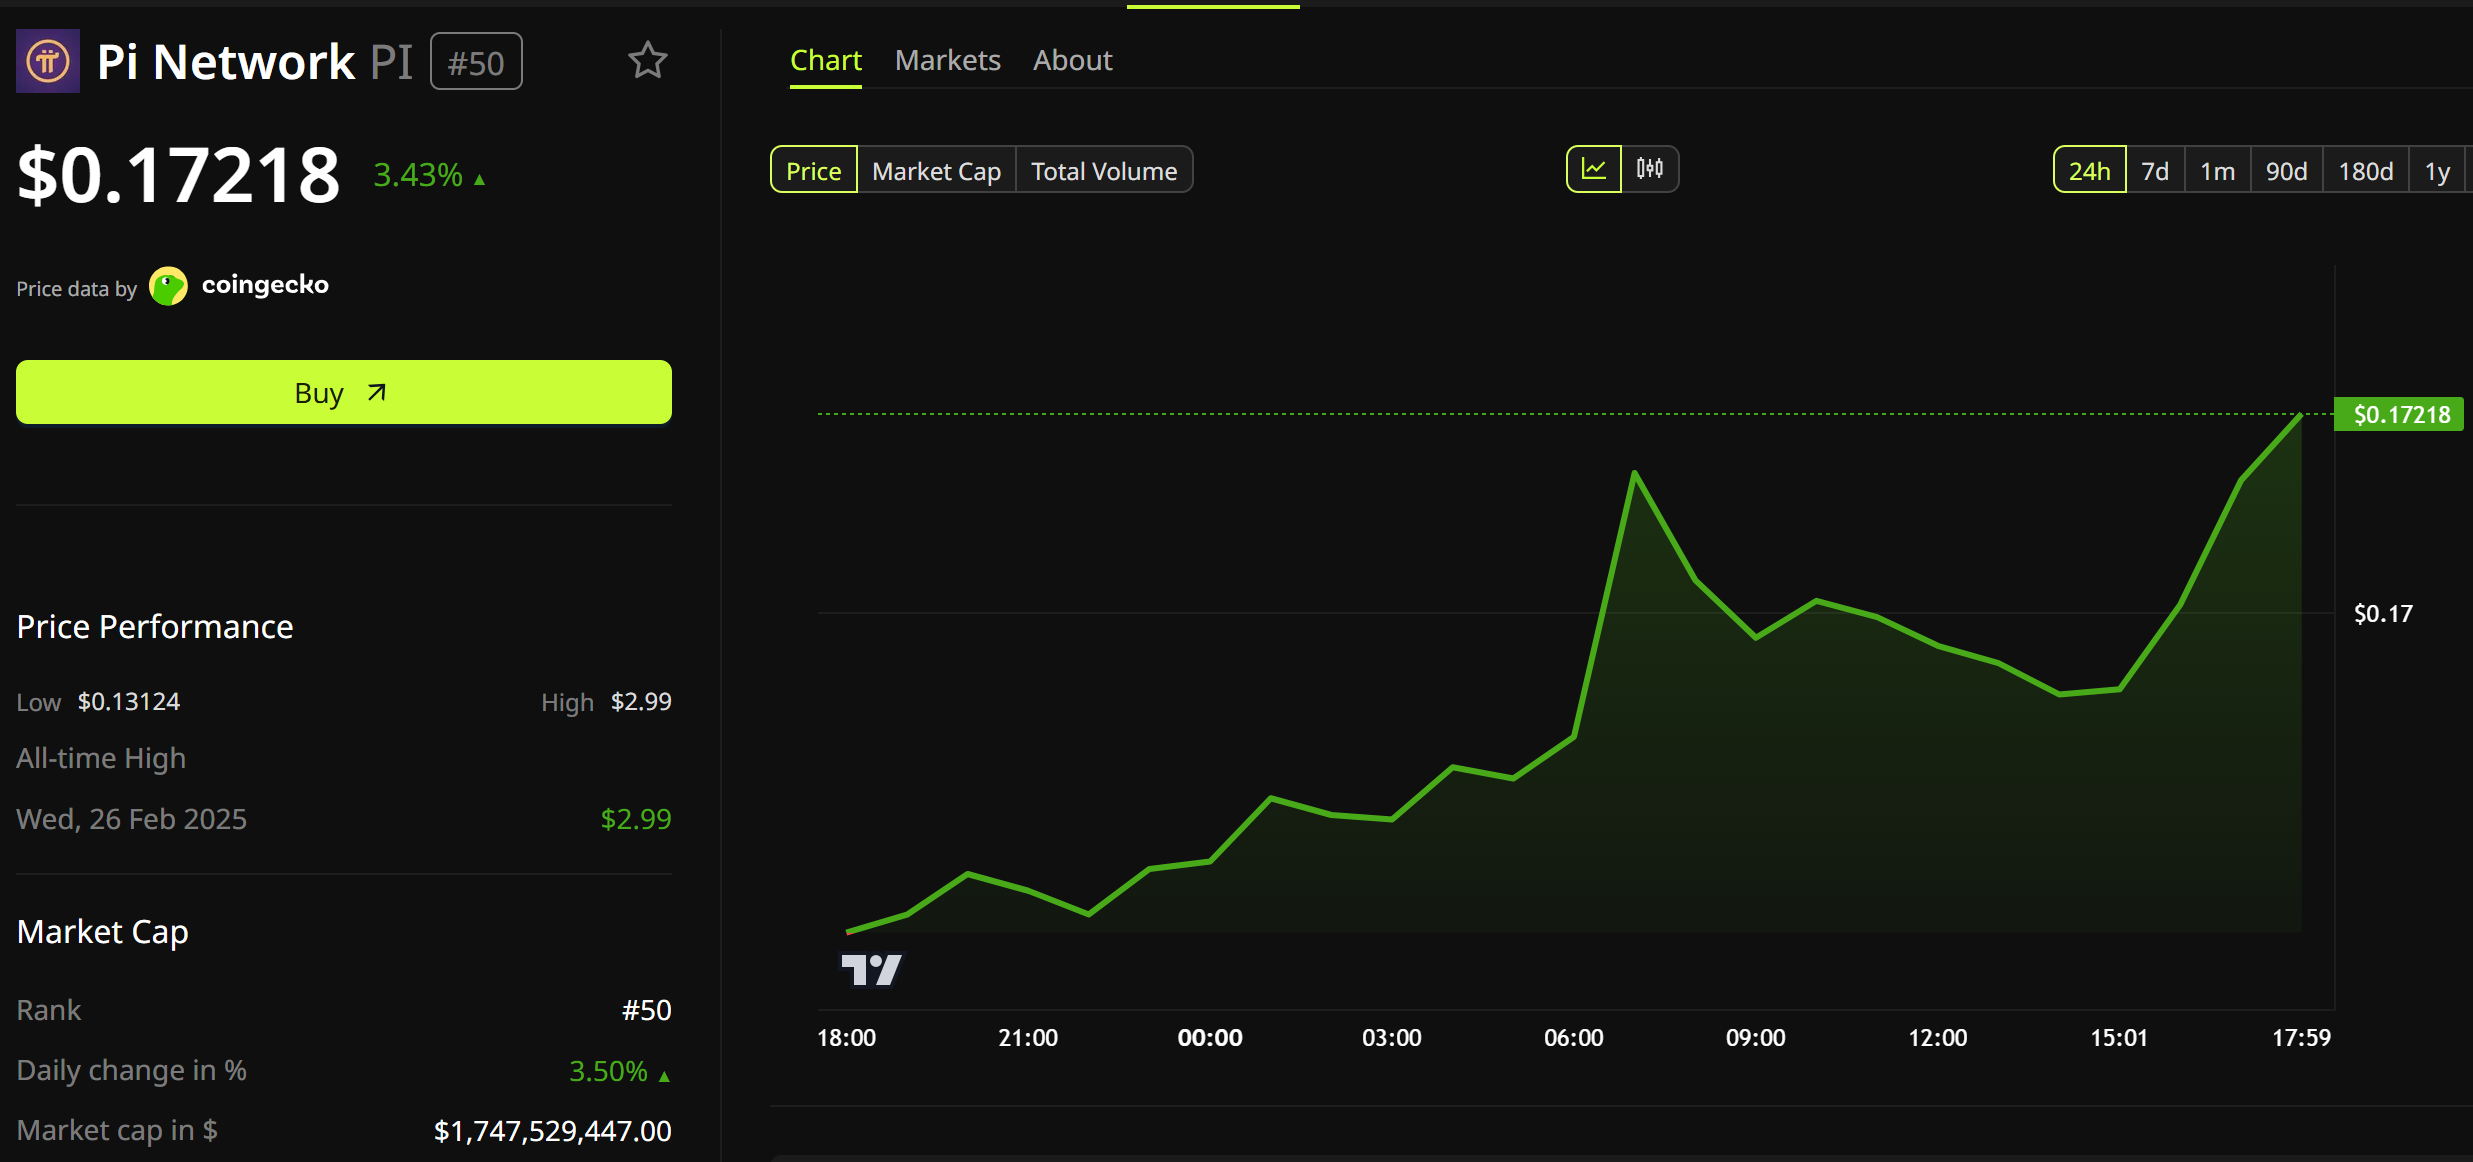
PI traded near $0.17 as of this writing, up 3.43% on the day, with a market cap of $1.75 billion according to CoinGecko data.
Backlogs and Tentative KYC Remain Pain Points
Despite the milestone, a significant number of Pioneers remain stuck in limbo. Nearly 44 million users have held a “tentative” KYC status at various points, meaning their verification requires additional review before full Mainnet access.
“At this rate, it’s going to be 10 years before some people see their Pi,” one pioneer remarked.
Some users report waiting over two years without resolution. Others faced losing accumulated coins when a KYC deadline passed before their applications cleared.
Pi introduced a FastTrack option and automated review system that fully verified an additional 3.36 million Pioneers.
“If eligible, users will see this option directly within the Pi Wallet app, allowing them to begin KYC and, once verified, gain immediate access to the Pi Mainnet wallet and its utilities,” the team wrote in a blog.
However, with over 16 million Mainnet migrations completed so far, a gap remains between verified and fully migrated accounts.
Whether Pi’s identity-first approach translates into sustained real-world adoption may depend on how quickly it clears the backlog of verifications that continues to frustrate its most loyal users.
The post Pi Network Claims 18 Million Verified Real Users, Is It True? appeared first on BeInCrypto.


Eight web3 games have either shuttered, paused operations, or pivoted to web2 this year as the space continues to struggle amid a major funding drought.
The latest web3 games to be hit, 77-Bit and Pixel Heroes Adventure, delivered their bad news on Wednesday.
Pixel Heroes Adventure says it laid off its entire team due to “unavoidable circumstances,” while 77-Bit paused its development, citing infrastructure issues “built with corners we cut trying to win time that couldn’t hold the scale we grew into.”
Before the dust from those two announcements had had time to settle, XOCIETY revealed on Thursday that it would be pausing its live service NFT game and web3 activities due to “ongoing profitability issues.” Its development team, NDUS, is considering selling or merging the firm.
One of Moku’s social media team members, @EduMock noted that this year, Bloktopia, Pixiland, Forgotten Runiverse, GENSO Online, and KTTY World have all either shut down, paused their operations, or pivoted to web2.
Web3 games typically involve some sort of element that incorporates blockchain technology, such as NFTs or some kind of token system.
Earlier this month, Gunzilla Games, the firm behind Off The Grid and one of the biggest names in web3 gaming, was revealed to be struggling to pay its staff on time, with multiple staff members reporting that they hadn’t been paid after months of work.
Read more: Hamster Kombat players are exploiting the game with massage guns
The response from the company’s CEO spun the coverage as FUD. He claimed the salary delays were necessary, and framed the revelations as “a new narrative from haters.”
Web3’s woes stretch back further than the beginning of this year. Indeed, crypto poster “@StarPlatinum_” noted that, in May 2025, 18 different web3 studios and games had shuttered their operations across the first five months of the year.
Has web3 gaming funding dried up?
The downturn appears to stem from a lackluster demand in web3 games that has in turn, contributed to a lack of venture capital funding to keep supporting the development of these teams.
Indeed, various web3 executives told Decrypt that funding was starting to dry up, many web3 games were reaching the end of their life span, and teams were pivoting away from the space entirely.
The CEO of web3 game The Sandbox, Robby Yung, told Decrypt, “Venture capital funding in gaming has been dry for years,” adding that “most of them probably raised money in 2022, and this is just how long their runway has lasted.”
Even Gunzilla’s web3 director, Theodore Agranat, told Decrypt that there’s an “open” and “universal sentiment” about the lack of funds within his venture capital contacts.
Read more: Web3 is the future of the internet — and a16z’s exit liquidity
Chris Heatherly, who ran the development studio Great Big Beautiful Tomorrow, which suffered its own game closures, said investors thought crypto firms would make twice their return quicker than a regular fund, “so they wanted these redonkulous returns and had no patience.”
He added, “Towards the end of 2023, mid-2023, crypto funds stopped deploying and writing checks.”
There’s also been economic struggles across the mainstream gaming industry. Fortnite’s developer Epic Games, Ubisoft, and EA have made thousands of their employees redundant.
Meta, the firm that rebranded its image from Facebook as part of the “metaverse” hype, announced in March that it was shutting down its virtual reality metaverse project, Horizon Worlds, this year.
Got a tip? Send us an email securely via Protos Leaks. For more informed news and investigations, follow us on X, Bluesky, and Google News, or subscribe to our YouTube channel.

Ordinals (ORDI) posted a 94% single-day gain on April 16, pushing directly into its first major Fibonacci resistance zone. The move follows months of base-building and a falling wedge breakout visible across multiple timeframes.
A massive volume surge accompanied the advance, driving price from the $2.00 range to above $6.60. ORDI is now testing the 0.382 Fibonacci retracement at $6.488 after opening the session at $3.444.
Volume Explosion Drives ORDI Into Fibonacci Resistance
The daily chart shows a prolonged downtrend that stretches back to the all-time high. A Fibonacci retracement runs from the May 14, 2025 high of $13.61 to the March 29 low of $2.085. That grid maps the key recovery levels ahead.
ORDI spent months building a base below the 0.236 level at $4.805. A green accumulation zone formed between $3.60 and $4.00 from late 2025 through early 2026, with a series of higher highs and higher lows developing inside that range.
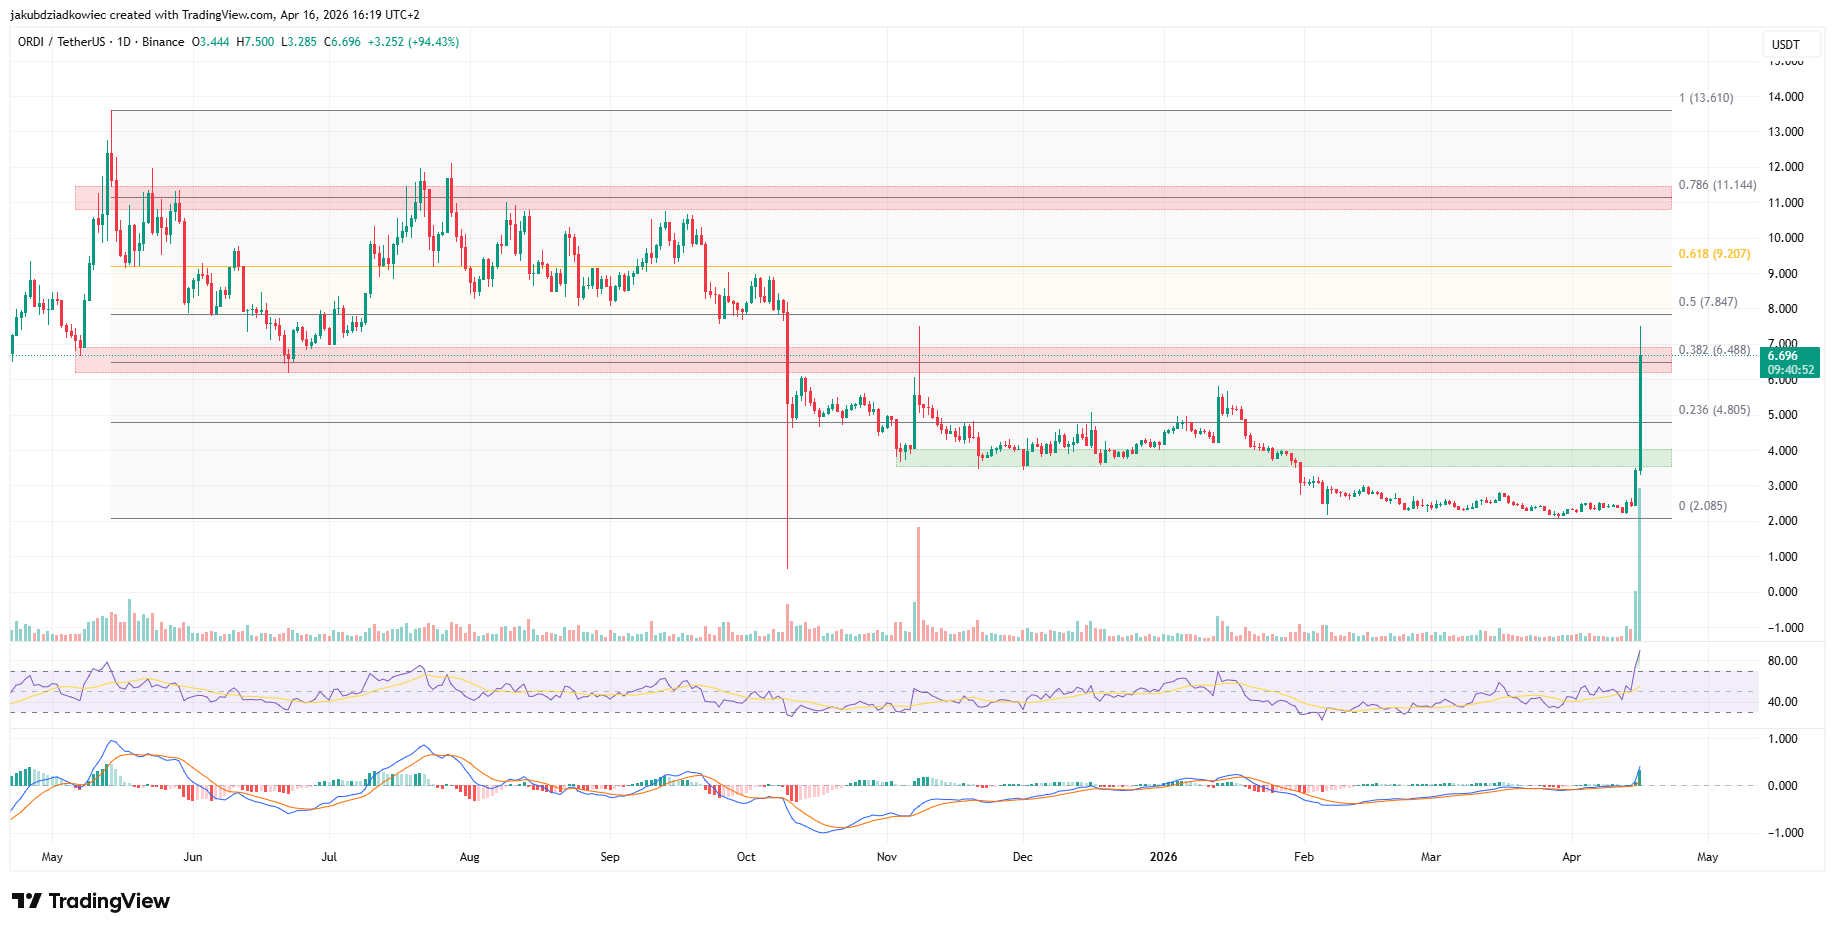
Today’s candle drove price through that zone and into the 0.382 resistance band at $6.488. A volume spike dwarfing recent activity fueled the move, with the daily bar reaching a high of $7.500 before pulling back toward $6.696.
The daily RSI is printing approximately 89, its highest reading in months. That level sits deep in overbought territory. A daily close above $6.488 would confirm the level as broken and redirect focus to higher targets. A rejection here could send ORDI back toward the $4.805 support.
One-Hour Chart Confirms Trend With No Bearish Divergence
The overbought daily RSI introduces caution. The one-hour chart, however, offers a contrasting read on near-term momentum.
From April 13, ORDI tracked a black exponential growth curve, with each candle printing new highs at an accelerating pace. Price accelerated sharply on April 16, lifting from roughly $2.50 to a high of $6.896 in a matter of hours.
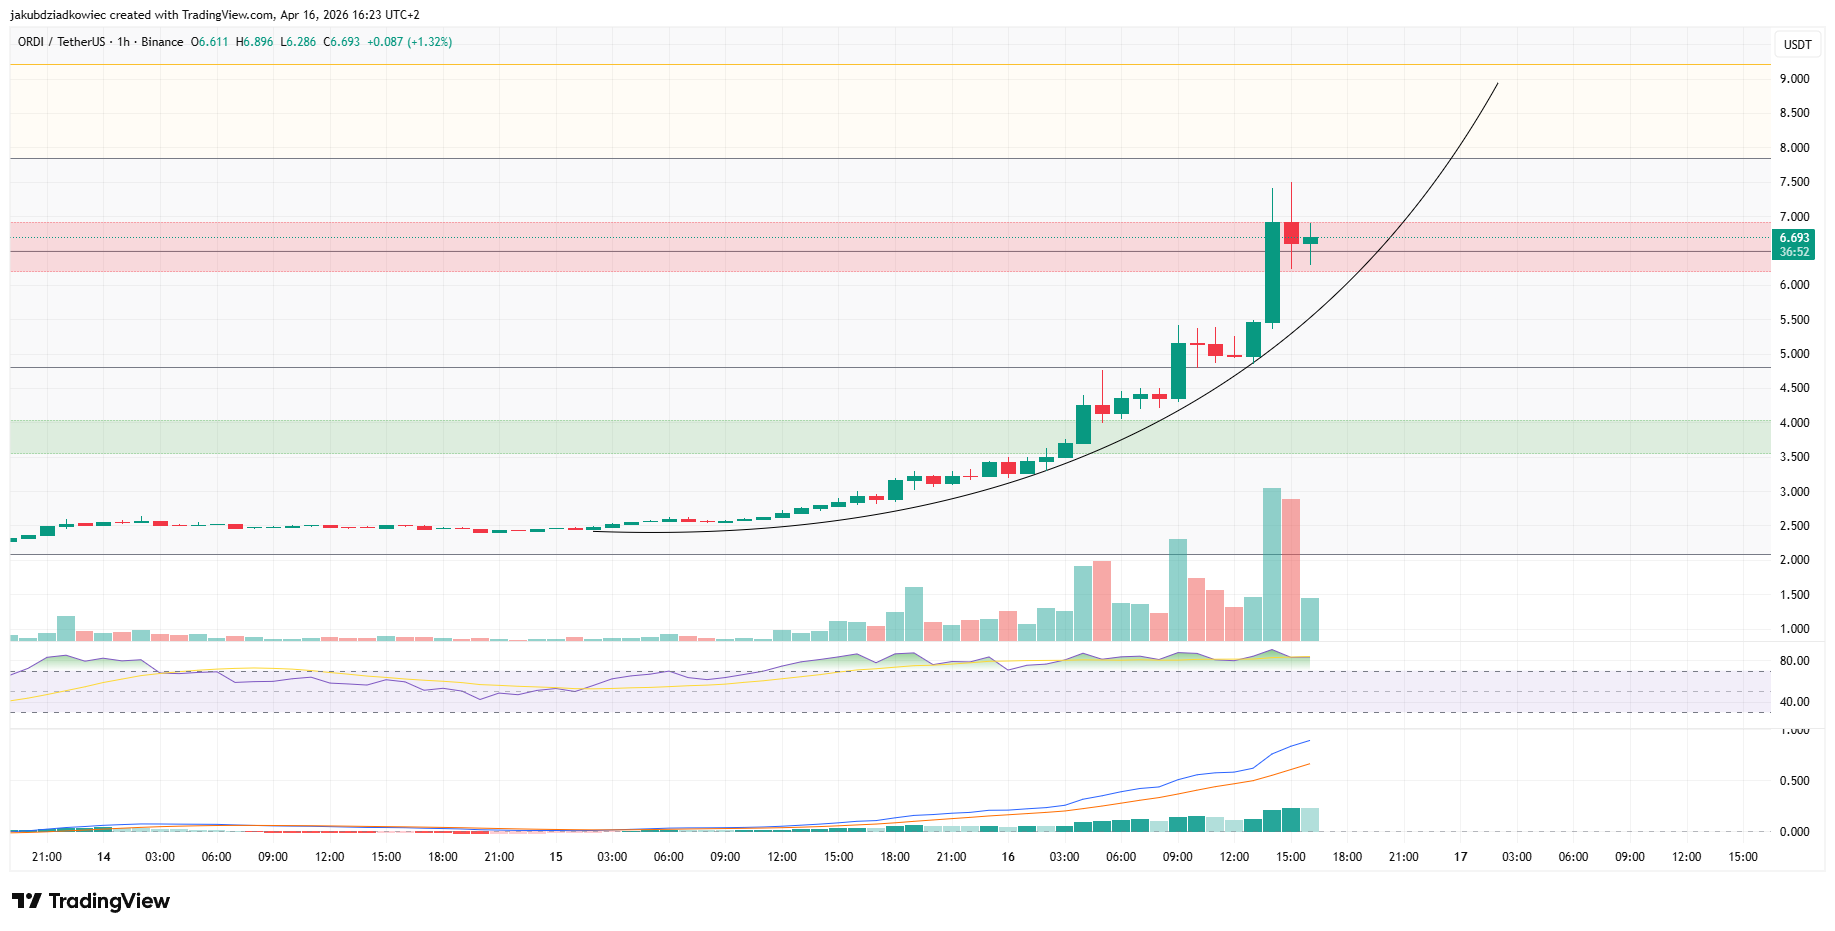
Neither the RSI nor the MACD on the one-hour timeframe shows any bearish divergence. Both indicators are rising alongside price, not lagging behind it. That distinction matters in strong trend environments, where ORDI has historically maintained momentum longer than overbought readings alone would suggest.
Price is currently consolidating inside the red resistance box between $6.50 and $7.00. A sustained break above that zone opens immediate targets at $8.00 and above $9.00. Should buyers lose control at current levels, the first meaningful support sits at the green zone between $3.60 and $4.00, with an intermediate buffer near $4.805.
ORDI Price Targets $11.40 as Falling Wedge Signals Extended Rally
The three-day chart published by analyst @CryptoCove adds a longer-term structural argument to the Ordinals breakout thesis. A falling wedge pattern, visible since mid-2024, is now breaking out with force.
The analyst projects a 335.65% move from the breakout point, with a target of $11.409. That figure sits near the 0.786 Fibonacci retracement at $11.144 identified on the daily chart. Both signals converge around $11.40, strengthening the case for that target.
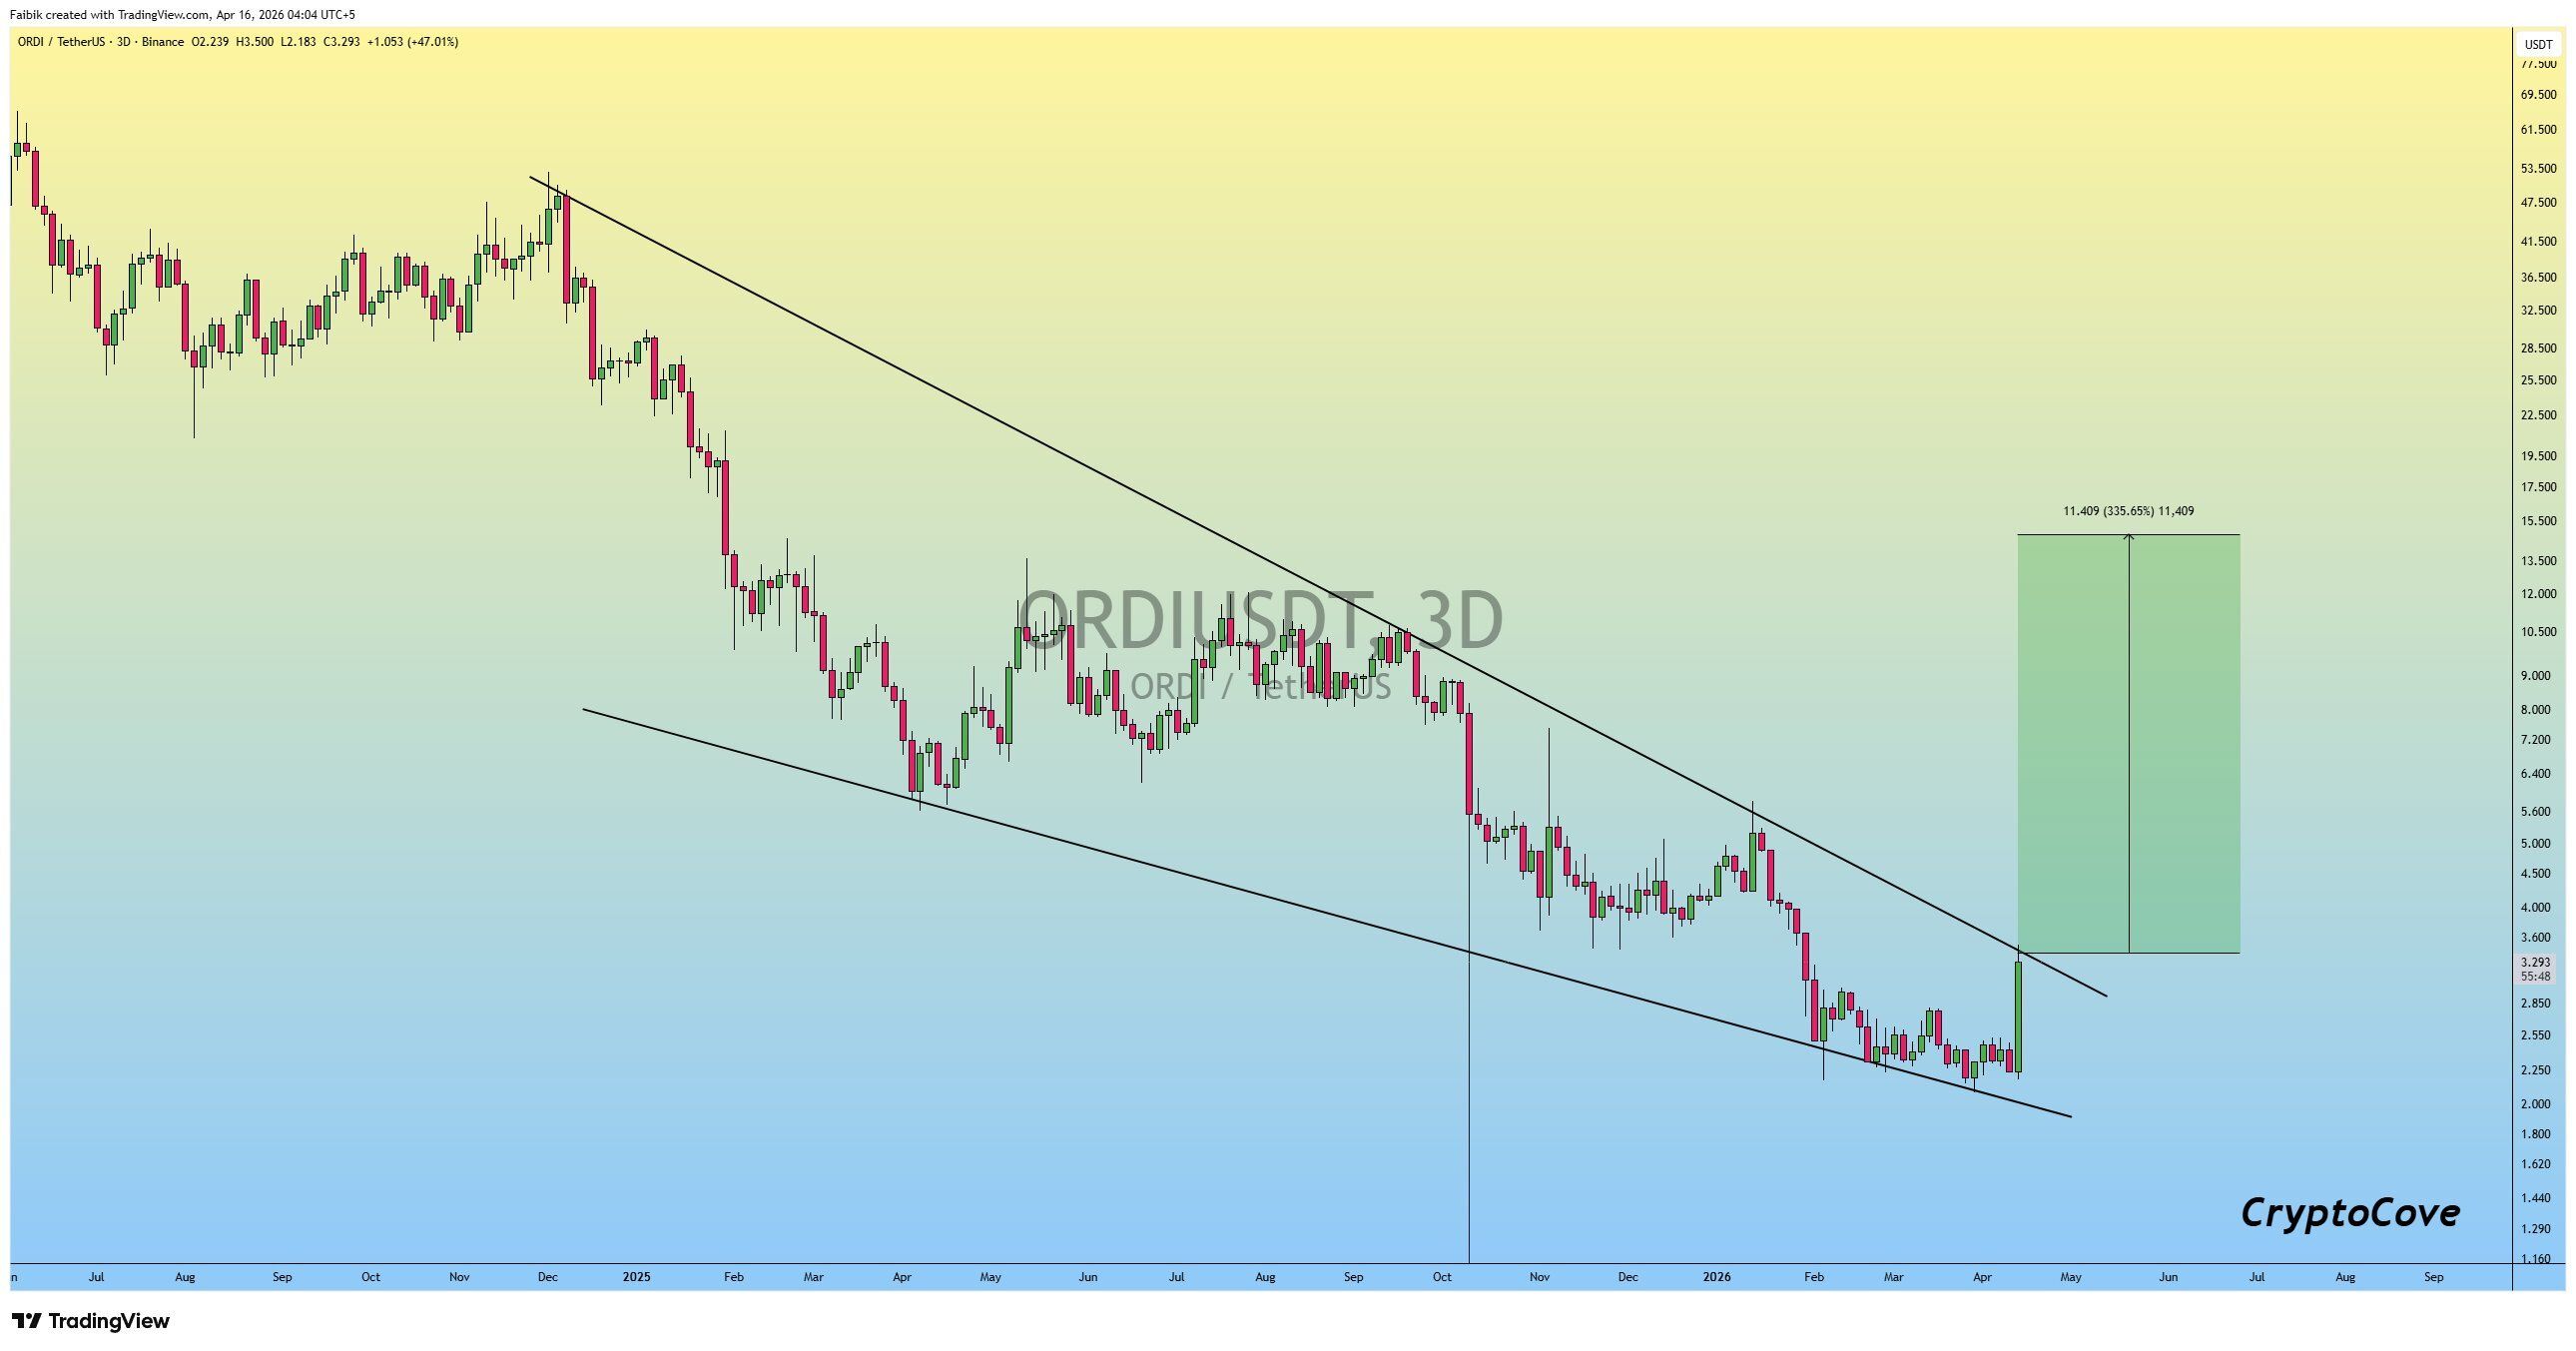
Three resistance zones stand between current price and $11.40. The 0.5 Fibonacci level at $7.847 is the first test. The golden pocket at 0.618, near $9.207, follows. The 0.786 retracement at $11.144 is the final structural hurdle before new highs become possible.
A failure to hold above $6.488 would delay the setup and put the green support zone back in play. But the volume behind today’s move and the aligned signals across three timeframes suggest that any dip toward support may attract fresh buyers.
The post ORDI Surges 200% Amid Altcoin Rally, Prints God Candle appeared first on BeInCrypto.
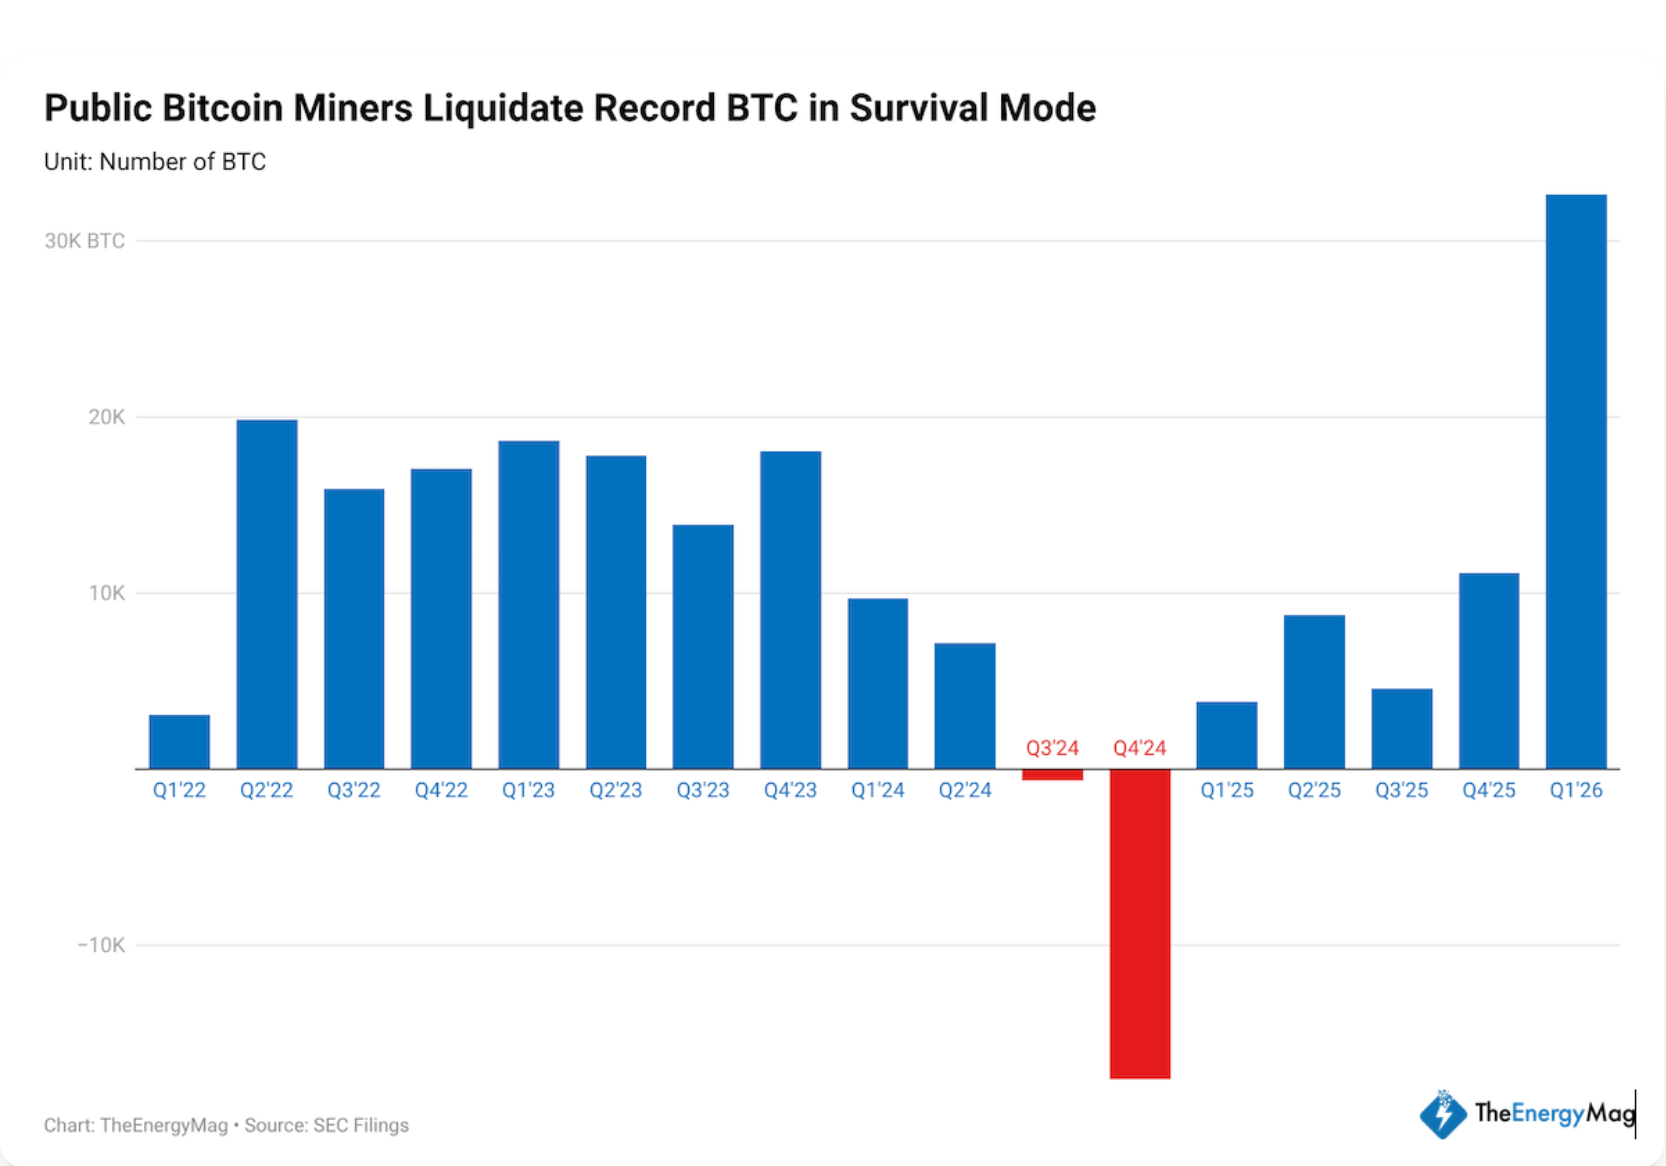
Publicly traded Bitcoin (BTC) mining companies sold more BTC in Q1 2026 than in all four quarters of 2025, as business conditions tighten for the mining industry.
Publicly listed BTC miners, including MARA, CleanSpark, Riot, Cango, Core Scientific and Bitdeer, have collectively sold more than 32,000 BTC in Q1 2026, according to TheEnergyMag.
The Q1 sales surpassed the 20,000 BTC sold in Q2 2022 during the crypto bear market triggered by the collapse of the Terra-Luna ecosystem, setting a “new record” for BTC miner sales in a single quarter, TheMinerMag said.

The sales come as hashprice, that is, the computing cost and a critical metric for miner profitability, sits at record low levels under $35 per petahash/second per day (PH/s), according to data from Hashrate Index.
That $35 PH/s level is the breakeven for many Bitcoin miners, particularly those running older mining machines, and the current hashprice of about $33 PH/s per day places about 20% of the mining industry in unprofitable territory.

The heavy BTC sales come as the mining industry struggles with increased competition represented by a rising hashrate, the total computing power expended by miners to secure the network, reduced block rewards and macroeconomic headwinds.
Related: Bitcoin miners face a tougher road to the 2028 halving
BTC held by miners has been declining long-term while treasury companies pour in
The Bitcoin Miner Reserve, a metric tracking all the BTC held by miners, has been gradually decreasing since 2023, according to CryptoQuant.
Bitcoin miners collectively held over 1.86 million BTC at the end of 2023, but only hold about 1.8 million BTC at the time of publication.

Miners periodically sell portions of their BTC to cover operating expenses, but a combination of lower crypto prices and rising energy costs has forced some miners to offload coins they would have held in their corporate treasuries.
“We expect further capitulation among higher-cost operators in H1 2026 unless BTC’s price recovers materially,” asset manager CoinShares said in its Q1 2026 Bitcoin Mining Report.
Standing in sharp contrast to the miners’ selling are Bitcoin treasury companies, like Strategy, which has been a regular buyer of the biggest crypto.
Michael Saylor, the co-founder of the biggest Bitcoin treasury company, earlier this week signaled that Strategy is acquiring more BTC, as the price retreated from the local high of over $73,000 reached this week.
“Think bigger,” Saylor said on Sunday, while sharing the chart of Strategy’s BTC purchase history that has become synonymous with imminent BTC acquisitions.
Magazine: Bitcoin mining industry ‘going to be dead in 2 years’: Bit Digital CEO

Tether, the stablecoin giant behind $185 billion USDT, has announced its support of a recovery plan to assist Drift Protocol following a devastating hack on April 1.
Drift, a Solana-based perpetual futures exchange, lost around $285 million after its team was allegedly infiltrated by North Korean-linked hackers to compromise a multisignature wallet.
The move will also see Drift “transition its settlement asset from USDC to USDT” and appears to be a “masterclass” bid for dominance on Solana where competitor Circle’s USDC is more popular.
Read more: Inside the $280M Drift hack: weeks of setup, minutes to drain
While USDT is far-and-away the crypto industry’s dominant stablecoin, on Solana, closest competitor USDC flips the script.
In the wider market, USDT’s market cap is over 2.3 times that of USDC’s $79 billion. But on Solana, USDC’s market cap of $8.1 billion is 2.65 larger than USDT’s $3.05 billion.
In replacing USDC, Tether claims it will bring “more than 128,000 users and over 35 ecosystem teams onto USDT-based trading… on one of Solana’s largest perpetual trading venues.”
Indeed, Drift Protocol’s pre-hack total value locked was $550 million, which would make it Solana’s eighth largest protocol by the same metric, ahead of real-world asset platforms Securitize and xStocks and decentralized exchange Meteora.
A long road to recovery?
The recovery plan is far from a straight-up reimbursement for users. It will instead see exchange revenue directed toward recovery, with “capital support… introduced progressively and aligned with performance.”
DeFiLlama’s 0xngmi remarked that it looks “closer to a plan where users recover their hacked amounts by trading on drift.”
Both a portion of exchange fees and outside support funds will be committed to a “recovery pool” for distribution to affected users. Drift also describes a planned token “intended to represent a claim on the recovery pool.”
With a nod to concerns raised in the wake of the hack, it explains that all core assets will be controlled by a new “community-based multisig,” using “dedicated signing devices, with transaction content independently verified.”
Going round in Circles
Circle has been repeatedly criticized over its failure to freeze funds in the aftermath of hacks and other illicit activity.
The Drift hack was one of the most egregious examples of this, as highlighted by blockchain investigator, and frequent Circle critic, ZachXBT.
Read more: Circle rarely freezes stolen funds but wants reversible transactions
Other examples include the SwapNet hack, where over $3 million of USDC sat unfrozen on Base hours after the event, and last year’s GMX hack in which $8 million was bridged using Circle’s own tool.
This latest incident appears to have finally landed USDC’s issuer in hot water.
A class action suit has reportedly been filed against Circle, accusing the firm of “knowingly permitting the attackers, reportedly tied to North Korea’s government, to offload $230 million of their spoils over the course of several hours by using Circle’s own stablecoin USDC and its blockchain bridge CCTP, instead of freezing the funds.”
Protos reached out to Tether for comment, but it didn’t respond immediately, we will update this piece if we hear back.
Got a tip? Send us an email securely via Protos Leaks. For more informed news, follow us on X, Bluesky, and Google News, or subscribe to our YouTube channel.
Crypto World
Bitcoin Price Prediction Flips Bullish After Strategy Loads $1 Billion in BTC but Pepeto Is the Best Crypto to Buy Now
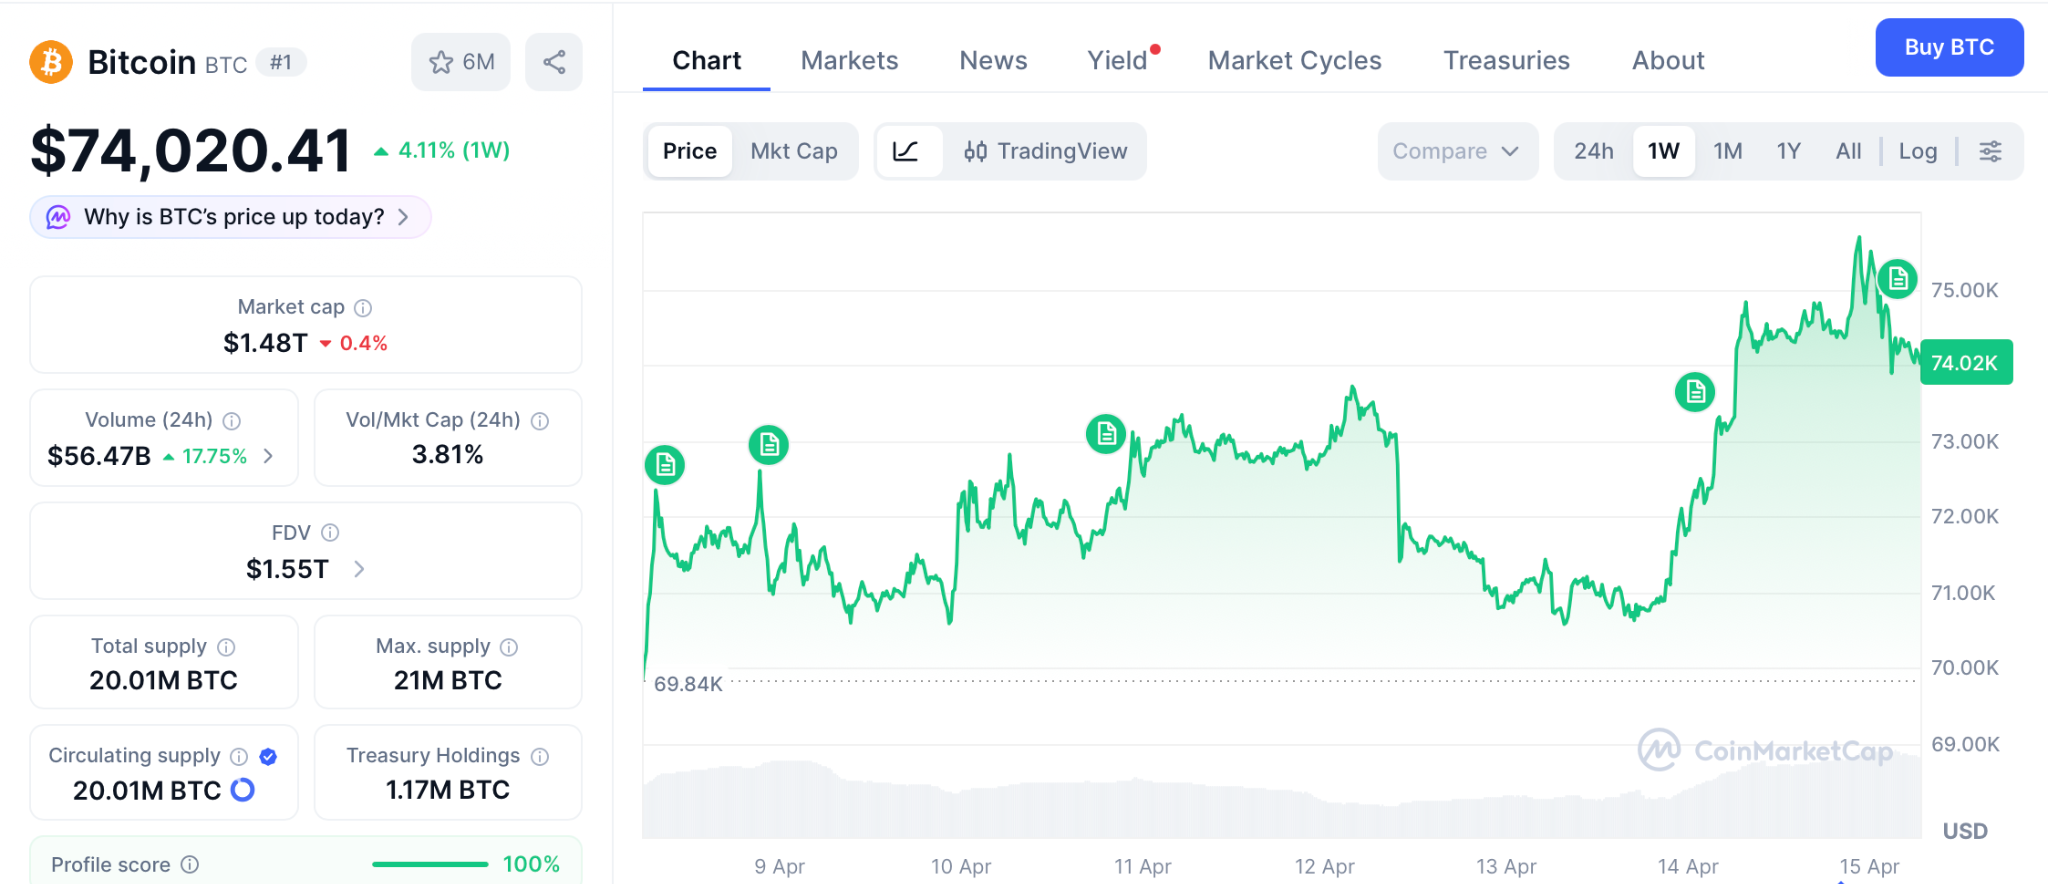
The bitcoin price prediction is running hot after Strategy dropped $1 billion on 13,927 BTC in a single week, lifting total holdings to 780,897 coins and leaving the company just 19,103 BTC from the 800,000 mark, per CoinDesk. That kind of corporate conviction while the Fear and Greed Index sits at 12 tells you exactly where the biggest buyer on the planet expects this market to go next.
BTC hit $76,000 on April 14, its highest since mid-March, as short liquidations and geopolitical easing drove a sharp rally per Bloomberg. Strategy funded the entire buy through STRC preferred stock, and the ticker printed a record $1.16 billion in daily volume on April 13 per CoinDesk. Pepeto crossed $9.04 million raised at $0.0000001863 with 183% APY staking compounding daily, and every day this presale stays open is one day closer to the listing that changes this price forever.
Institutional demand through ETFs now absorbs more than 100% of Bitcoin’s newly mined annual supply, building a structural squeeze that Bitwise calls the main driver behind its bitcoin price prediction that BTC prints a new all-time high before 2026 ends.
Goldman Sachs filed for a Bitcoin Premium Income ETF on April 14, joining BlackRock in building yield products around BTC. When the bitcoin price prediction lines up this cleanly with corporate buying and Wall Street expansion, presale tokens with real tools are the ones that catch the biggest wave.
Bitcoin Price Prediction Goes Institutional: Pepeto Is Where Smart Capital Moves Next
Pepeto stands as the best crypto to buy now after crossing $9.04 million raised while Bitcoin holds near $74,020 and the world’s largest corporate BTC holder keeps stacking during extreme fear.
Conviction keeps building because investors tracking the bitcoin price prediction understand the pattern. When BTC bounces off fear-driven dips, the altcoin wave that follows sends presale entries into return territory no big cap can reach.
The core problem Pepeto attacks is fragmentation. Traders jump between five or six platforms to bridge, swap, check contracts, and track positions, losing fees and time at every step. The exchange pulls all of that into one place.
From one dashboard, users bridge across Ethereum, BNB Chain, and Solana at zero cost, run risk scores on any contract before committing capital, and track their full portfolio on a single screen. The zero-fee engine keeps every dollar productive instead of leaking through hidden charges.
The result is real tools powering smart decisions instead of guesswork across broken platforms. The bridge, risk scorer, token engine, and portfolio tracker all run on smart contracts verified by a SolidProof audit, giving a security base most presales never come close to building.
At $0.0000001863 right now, a $10,000 position earns roughly $18,300 in annual staking rewards at 183% APY, putting about $1,525 per month straight into your wallet while the listing draws closer. The cofounder who created the original Pepe coin built Pepeto to capture exactly this kind of moment. Buying presales while fear runs the market is how the biggest fortunes in crypto have always started, and the confirmed Binance listing on Pepeto means this entry price gets wiped out the moment the first trade clears.
Bitcoin (BTC) Price at $74,020 While Bitwise Targets a New All-Time High
Bitcoin (BTC) trades near $74,020 on April 15 per CoinMarketCap, after punching above $76,000 on April 14 for its highest print since the February crash that drove prices to $60,000. Bitwise holds firm on its bitcoin price prediction that BTC will break its $128,198 all-time high before this year closes.
Every major desk keeps lifting its bitcoin price prediction, but BTC still needs to nearly double to reach those targets. By the time it arrives, every wallet that locked in Pepeto at six zeros will already hold returns that large-cap buyers would need years to match.
Conclusion
Every signal right now points to the same outcome. The bitcoin price prediction turning bullish, Strategy loading $1 billion in BTC during peak fear, Goldman Sachs filing a Bitcoin ETF, and the exchange infrastructure that merged meme energy with real trading tools standing ready to capture the full move.
The wealth built this cycle will belong to the people who found the tools, the builder, and the timing behind Pepeto before anyone else showed up. Visit the Pepeto official website today because the listing gets closer with every passing hour and the entry you see right now disappears the moment trading goes live.
Click To Visit Pepeto Website To Enter The Presale

FAQs
What is the bitcoin price prediction for 2026 and can presale tokens outperform BTC?
Bitwise and Standard Chartered both project Bitcoin will break its all-time high this year, roughly 2x from current levels. Presale tokens with confirmed listings and working tools historically deliver far larger multiples, and Pepeto at $0.0000001863 sits at that exact entry point.
Will Bitcoin (BTC) break its all-time high of $128,198 before 2026 ends?
Bitwise projects Bitcoin (BTC) will top $128,198 before December 2026, backed by ETF inflows absorbing over 100% of newly mined supply. Strategy’s $1 billion weekly purchase and 780,897 BTC total stack add corporate weight to that call.
Disclaimer: This is a Press Release provided by a third party who is responsible for the content. Please conduct your own research before taking any action based on the content.


Sis Vs Bro CHIP in Mini MONEY Hole
Arlene Foster tells peers she received online abuse about father’s shooting

Trump nominates Erica Schwartz as CDC director


-

 Politics6 days ago
US brings back mandatory military draft registration
-
 Sports6 days ago
Man United discover Nico Schlotterbeck transfer fee as defender reaches Dortmund agreement
-

 Fashion6 days ago
Weekend Open Thread: Veronica Beard
-

 Politics7 days ago
Malcolm In The Middle OG Turned Down ‘Buckets Of Money’ To Appear In Reboot
-

 Politics4 days ago
World Cup exit makes Italy enter crisis mode
-

 Business6 days ago
Tesla Model Y Tops China Auto Sales in March 2026 With 39,827 Registrations, Beating Cheaper EVs and Gas Cars
-

 Crypto World3 days ago
The SEC Conditionalises DeFi Platforms to Be Avoided for Broker Registration
-

 Crypto World3 days ago
SEC Signals Exemption for Crypto Interfaces From Broker Registration
-

 News Videos1 day ago
Secure crypto trading starts with an FIU-registered
-
 NewsBeat4 days ago
Pep Guardiola and Gary Neville agree over Arsenal title problem that benefits Man City
-

 Business5 days ago
Ireland Fuel Protests Enter Day 5 as Blockades Spark Shortages and Government Prepares Support Package
-

 Business6 days ago
OpenAI Halts Stargate UK Data Centre Project Over Energy Costs and Copyright Row
-

 Politics7 days ago
LBC Presenter Mocks Trump Over Iran War Failures
-

 Crypto World6 days ago
Federal judge blocks Arizona from bringing criminal charges against Kalshi
-

 NewsBeat2 days ago
Trump and Pope Leo: Behind their disagreement over Iran war
-

 Crypto World3 days ago
SEC Proposes Certain Crypto Interfaces Don’t Need to Register as Brokers
-
 NewsBeat5 days ago
JD Vance announces ‘no agreement’ with Iran over nuclear weapons fear
-

 Tech7 days ago
A version of Windows 10 released a decade ago is now eligible for additional security patches
-

 Business6 days ago
IMF retains floor for precautionary balances at SDR 20 billion
-

 Business6 days ago
Former Liverpool CEO eviscerates FIFA for World Cup ticket pricing
You must be logged in to post a comment Login