

Crypto World
Hyperliquid (HYPE) Soars 21% Following Nasdaq ETF Debut and Coinbase Partnership

Key Highlights
- HYPE rallied 21% over 24 hours to reach $46.64, with daily trading volumes exceeding $716 million.
- 21Shares launched the THYP ETF on Nasdaq May 12 — marking the first U.S. spot product offering direct HYPE exposure.
- Coinbase was designated as the official USDC treasury deployer on Hyperliquid, phasing out the native USDH stablecoin.
- Circle pledged 500,000 HYPE tokens for validator operations as part of the partnership agreement.
- Technical analyst Crypto Patel warns of possible retracement to $30–$33 range unless HYPE sustains a close above $50.
Hyperliquid’s HYPE token experienced a sharp 21% surge over the last 24 hours, climbing to $46.64 by Friday’s close. This upward movement elevated its market capitalization to approximately $11.14 billion, securing its position back among the top 10 largest cryptocurrencies.
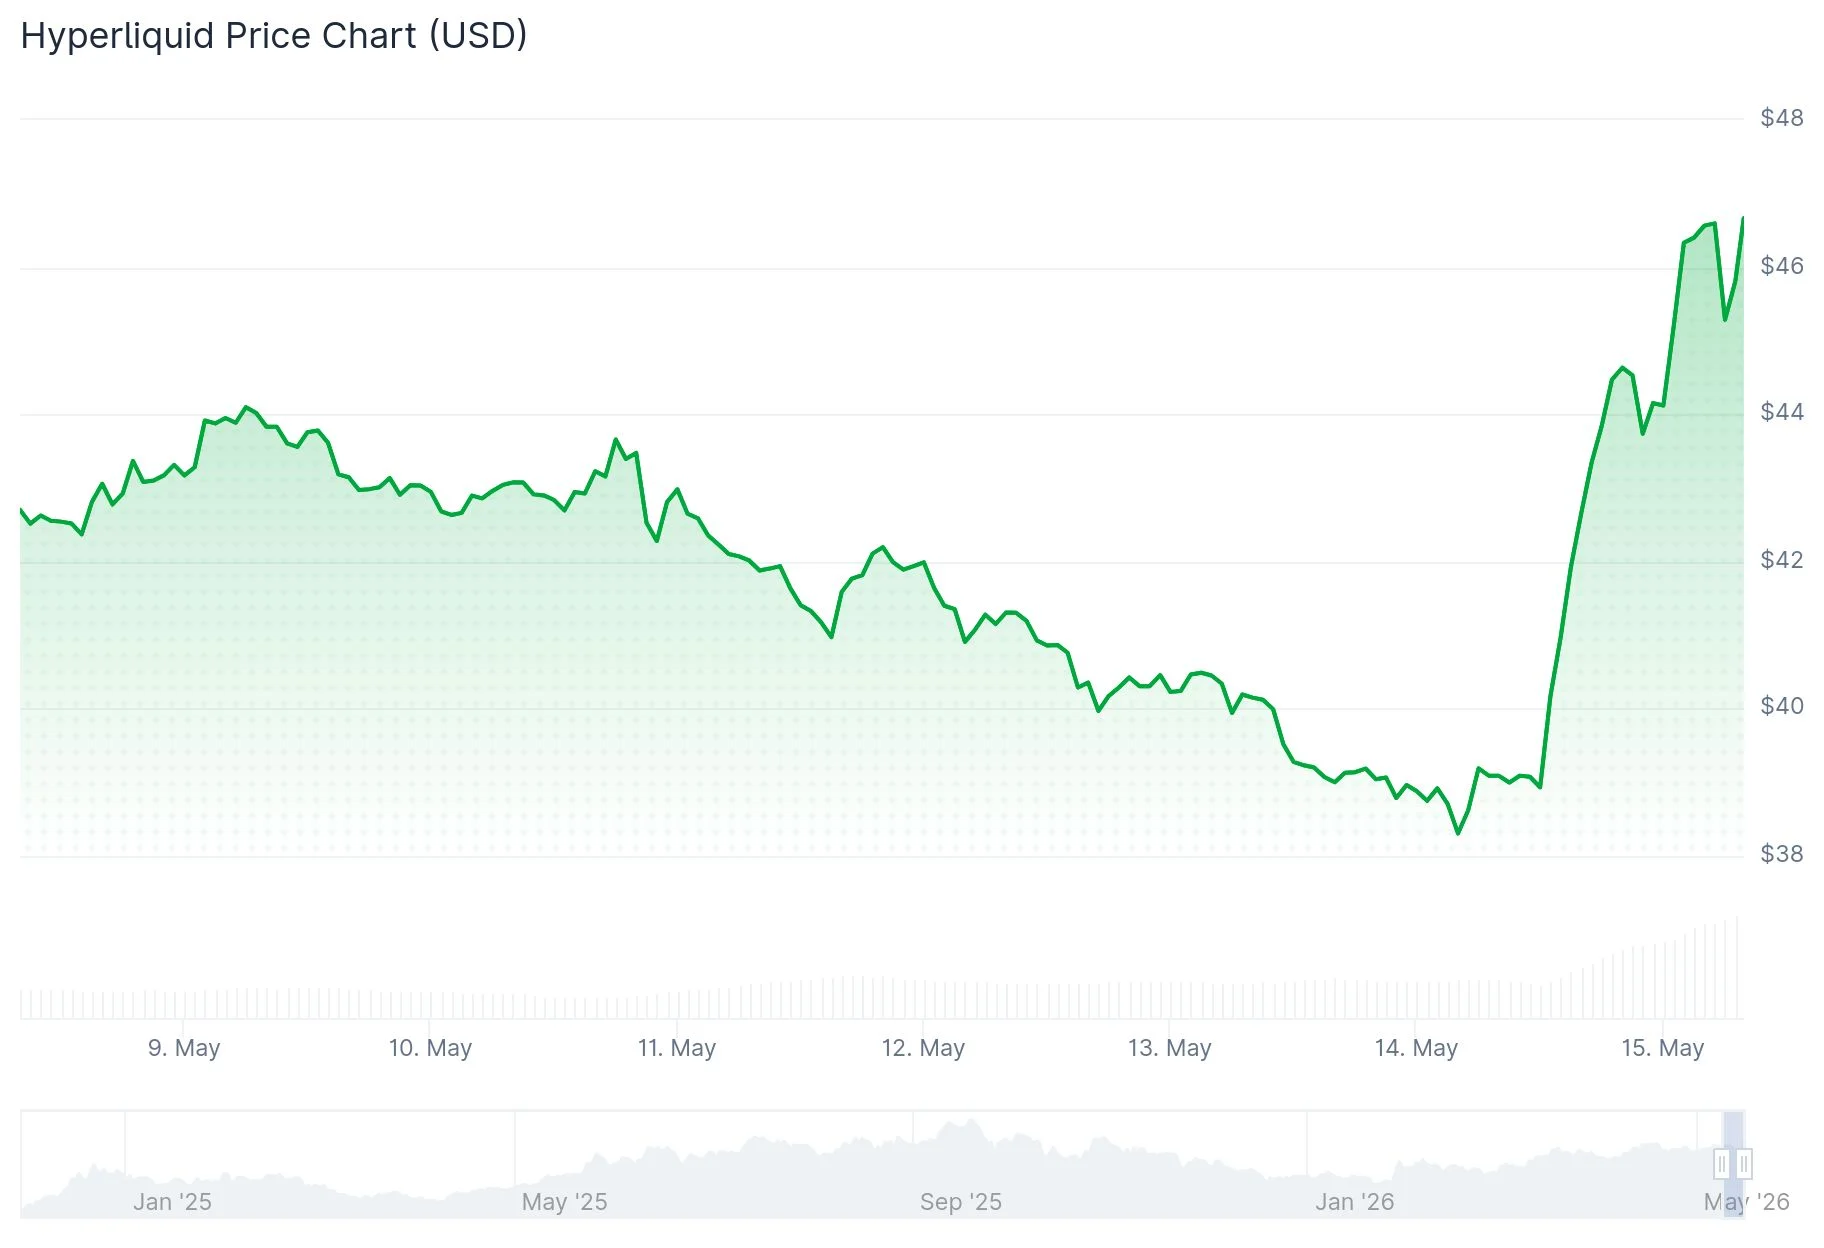
The token experienced significant intraday volatility, moving from a low of $38.45 to a peak of $46.93. Daily trading activity surged to $716.7 million — representing more than a twofold increase from the prior session — based on CoinMarketCap statistics.
However, HYPE remains approximately 21% beneath its record high of $59.37, which was recorded in September 2025.
The price explosion came after two significant announcements: the introduction of a regulated investment vehicle and a fundamental transformation in stablecoin operations.
Regulated ETF Provides Institutional Gateway
On May 12, 21Shares introduced the THYP ETF on the Nasdaq exchange. This marks the inaugural U.S. spot exchange-traded fund that provides direct exposure to HYPE tokens. The product maintains physical token holdings, stakes a percentage for rewards, and applies a 0.30% management fee.
First-day trading recorded $1.8 million in volume, accompanied by approximately $1.2 million in net inflows. Pending applications from Bitwise and Grayscale indicate that additional HYPE-focused investment products could emerge soon.
The ETF structure enables conventional investors to gain HYPE exposure without managing cryptocurrency wallets or navigating blockchain protocols.
Coinbase and Circle Forge Strategic Alliance
On May 14, Coinbase revealed its new role as the official treasury deployer for USDC on Hyperliquid through the platform’s Aligned Quote Asset program. USDC will supplant USDH as the dominant settlement and collateral instrument.
Circle will oversee the cross-chain technical operations. This transition aims to minimize liquidity division between the two stablecoin options.
USDC circulating on Hyperliquid currently stands at approximately $5 billion, representing a year-over-year doubling. The bulk of reserve income will be channeled back into Hyperliquid’s ecosystem through its Assistance Fund, which facilitates automatic HYPE token buybacks.
Circle has also allocated 500,000 HYPE tokens to support validator activities.
Technical Analysis and Market Outlook
Analyst Crypto Patel posted a measured assessment on X, noting that the rejection near $46 aligns with a rising wedge breakdown formation. He identified potential support zones at $33, $30, and $27, highlighting his primary interest area between $30–$31. He emphasized that his outlook would shift bullish only with a daily close surpassing $50.
Meanwhile, analyst Ali Charts pointed out that the TD Sequential indicator — which accurately predicted the bounce from $22 to $44 — is currently displaying a sell signal. He suggested this could prompt profit-taking activity targeting $36 or $33.
Hyperliquid presently captures approximately 60% of worldwide perpetual futures trading volume and produces over $2 million in daily protocol fees, with nearly 97% allocated toward HYPE token buybacks and burns.


Bitcoin (BTC) starts the third week of June with a spring in its step as the US-Iran peace deal sends risk assets higher.
Key points:
- Bitcoin price action targets $66,000 as US stock futures soar and oil approaches its lowest levels since early March.
- Traders see $69,000 as a likely short-term BTC price target.
- The Federal Reserve interest-rate decision is under the microscope thanks to new Chair Kevin Warsh.
- Bitcoin whales have reversed their selling mentality, putting in a “rock-solid floor” near $60,000.
- Overall demand weakness raises questions over a bull-market comeback.
Oil price drops below $80 as Iran peace countdown begins
The US-Iran war is again the center of attention for traders this week as a peace deal appears closer than ever.
Developments over the weekend initially included a Sunday deadline for signing off on a ceasefire, but this subsequently became Friday.
Multiple sources then confirmed that the US and Iran would sign an agreement for a 60-day pause in hostilities, along with various other measures, in Switzerland on Friday.
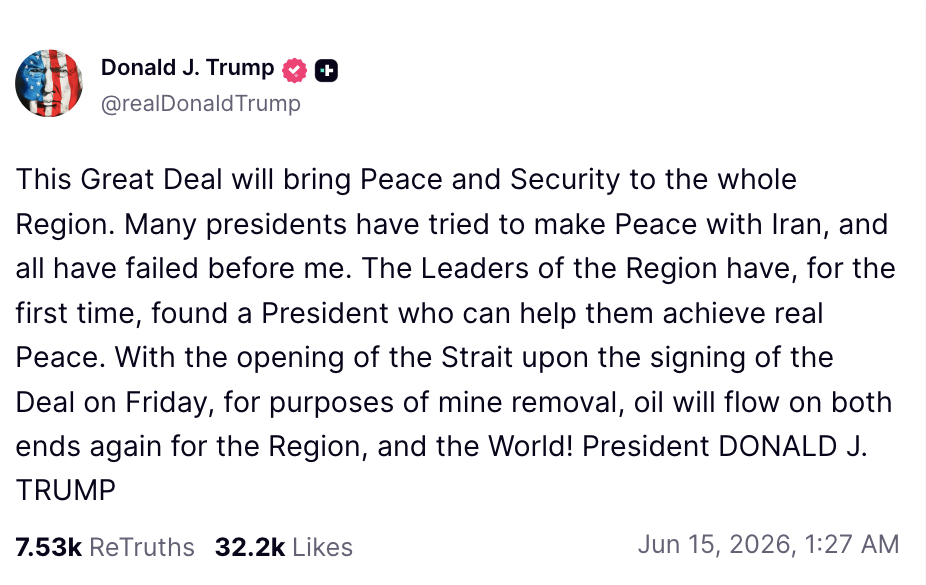
In a post on Truth Social, US President Donald Trump confirmed that the deal would include the reopening of the Strait of Hormuz — a key global oil route.
“With the opening of the Strait upon the signing of the Deal on Friday, for purposes of mine removal, oil will flow on both ends again for the Region, and the World!” he wrote.
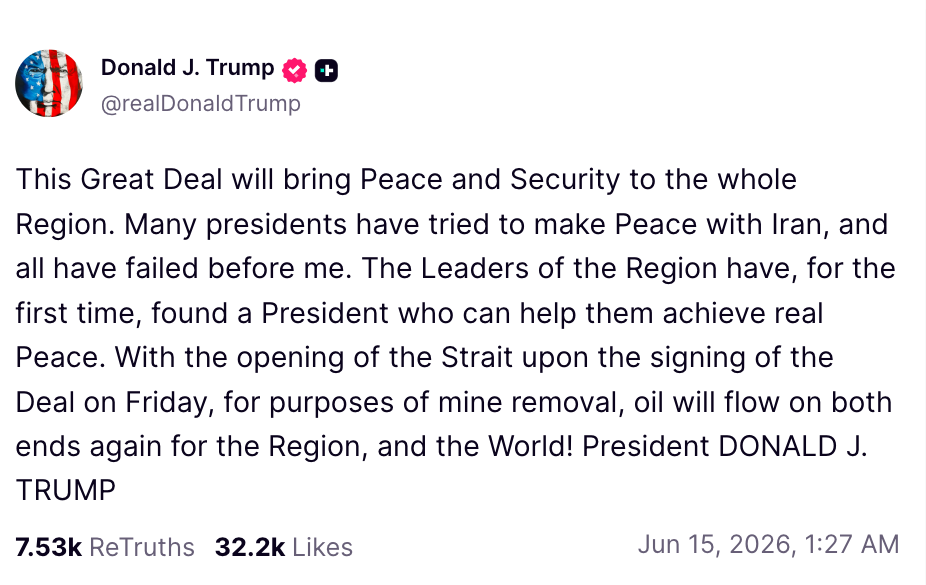
Source: Truth Social
US stock futures surged as a result, with risk assets moving higher across the board — including Bitcoin and crypto.
Oil, by contrast, fell immediately, with WTI crude trading below $80 per barrel for the first time since mid-April.
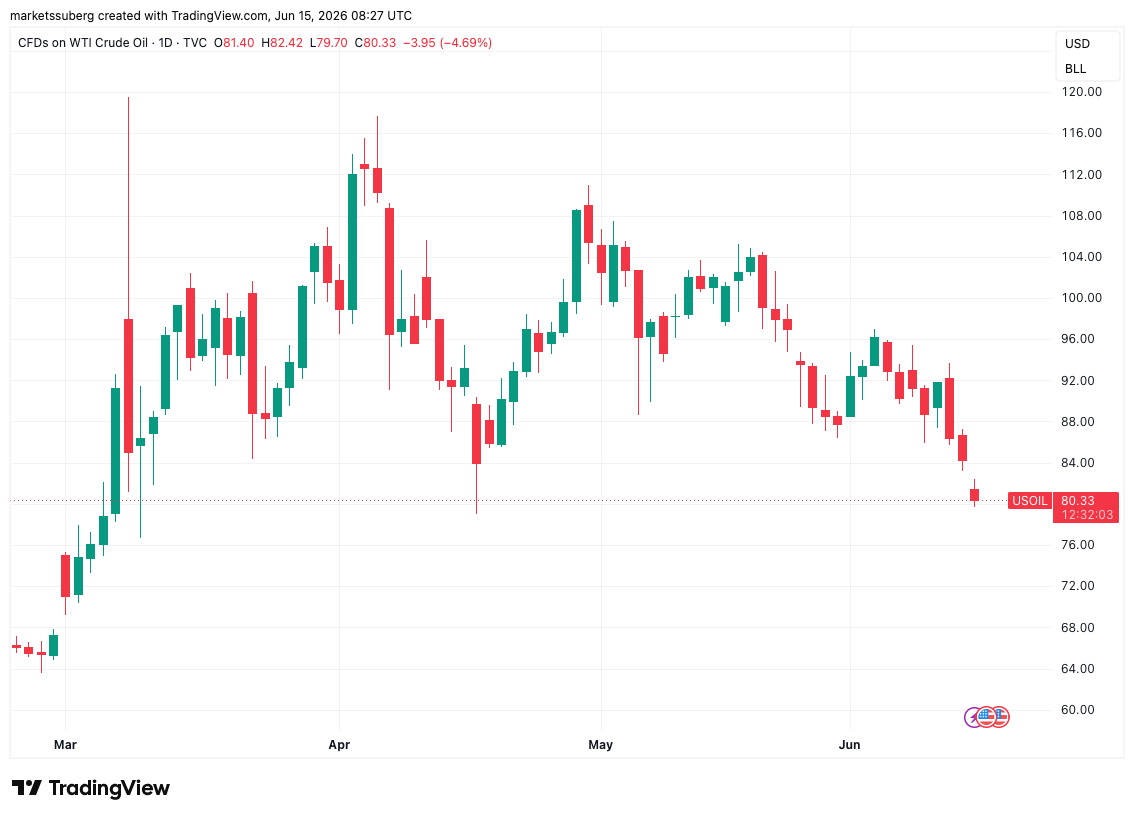
CFDs on US WTI crude oil one-day chart. Source: Cointelegraph/TradingView
Reacting, portfolio manager Danny Dayan described the deal as the “biggest and worst TACO of all time,” referring to the Trump administration’s approach to various geopolitical and macroeconomic conflicts.
“Overheat, higher core inflation, and higher neutral rate, will be the macro considerations ahead,” he told X followers, seeing a pivot away from oil as a market mover.
Throughout the conflict, oil price strength has been a headwind for Bitcoin, even as stocks see repeated new all-time highs.
BTC/USD is now back at the exact level it traded when it began on Feb. 28.
Bitcoin traders see $69,000 short squeeze
News of a US-Iran peace deal helped propel BTC price action toward two-week highs into Sunday’s weekly candle close.
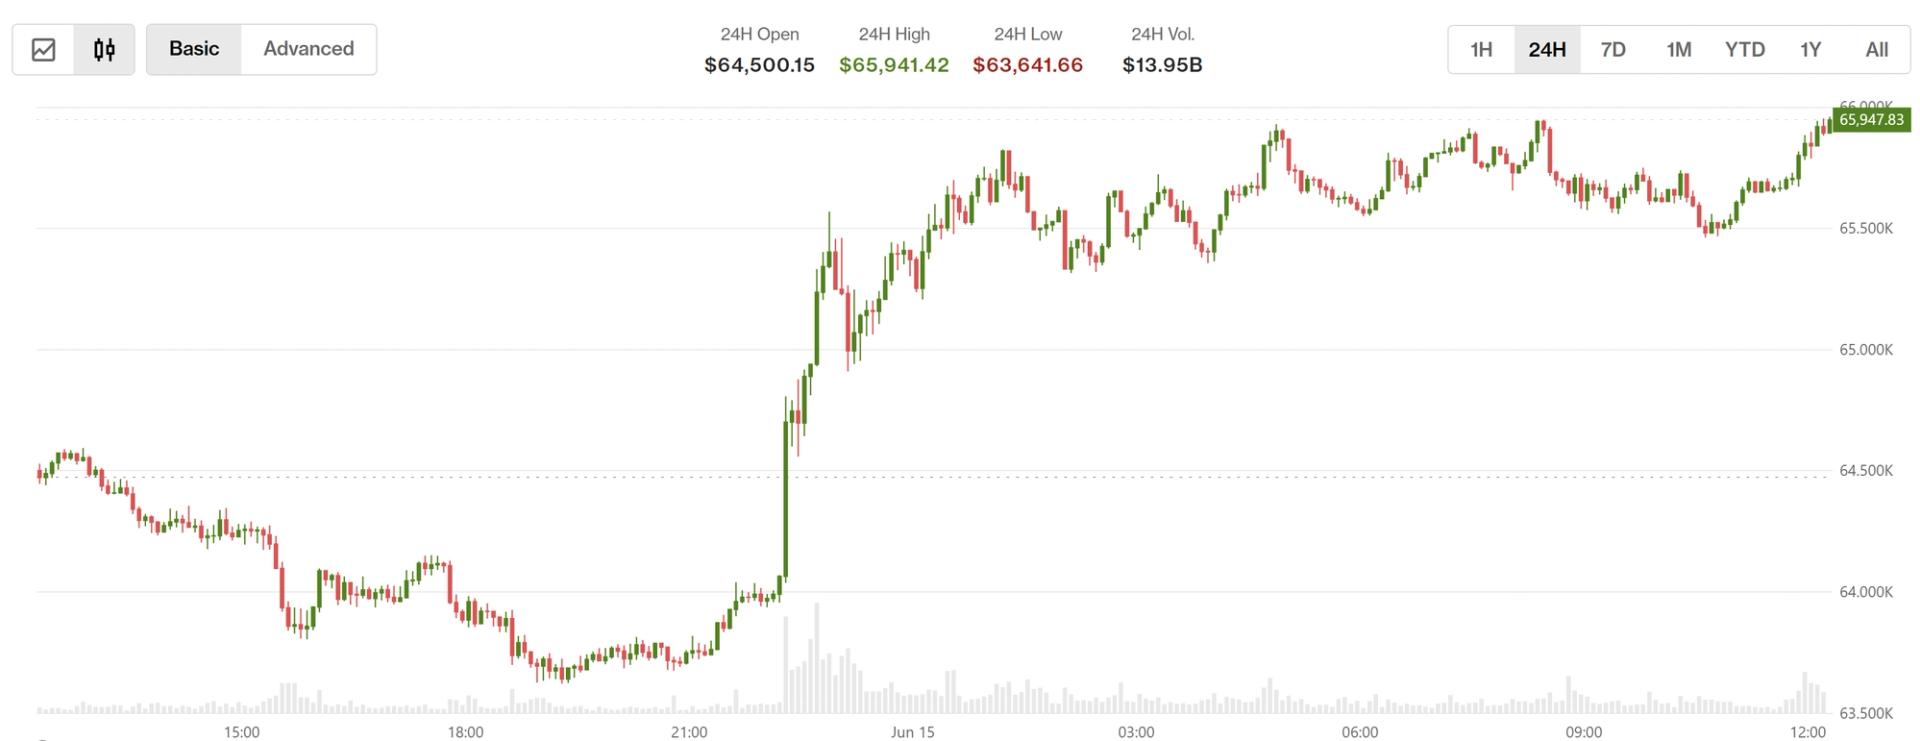
Data from TradingView captured local highs of $65,988 as the new week began.
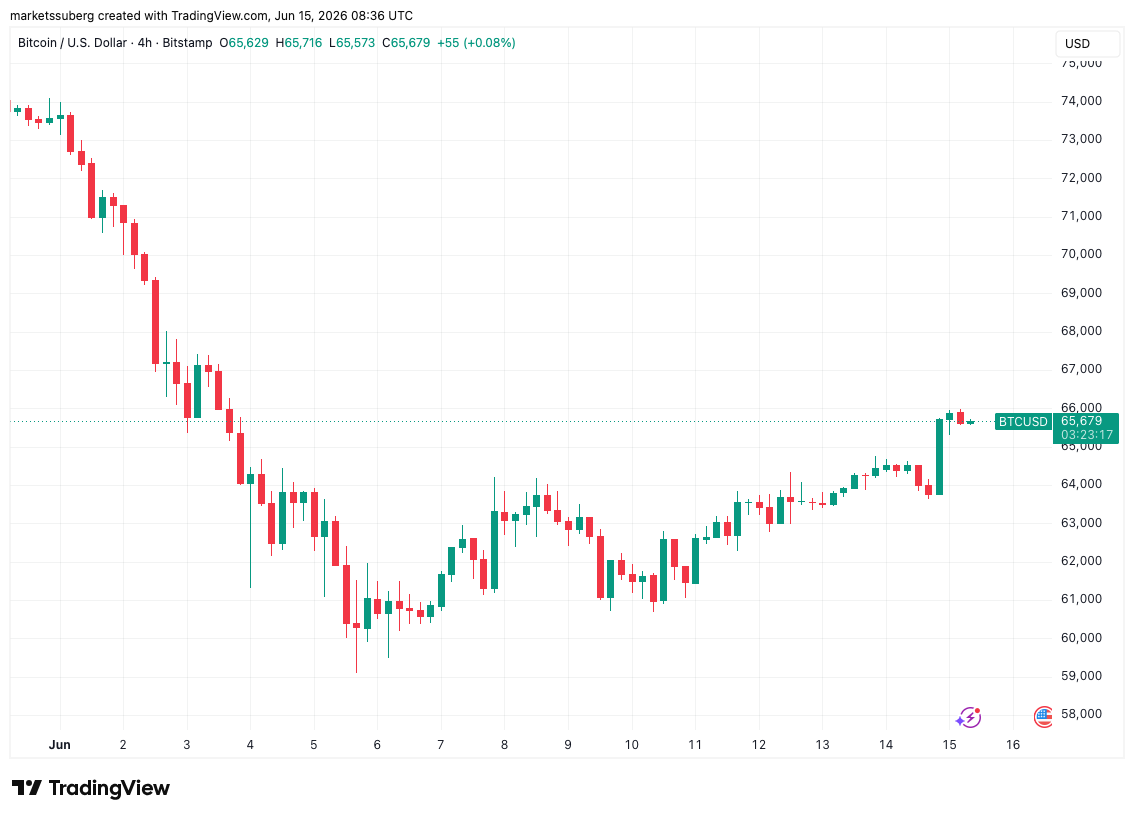
BTC/USD four-hour chart. Source: Cointelegraph/TradingView
With both $60,000 and Bitcoin’s 200-week simple moving average (SMA) at $62,000 holding as support, traders’ short-term outlook began to improve.
“Closed near the highs with almost no upper wick, favoring a push higher this week,” trader SuperBro wrote in his latest analysis on X.
SuperBro eyed the 200-week exponential moving average (EMA) as a potential target for a short squeeze.
“There are a lot of leveraged shorts up to the 200 EMA around $69K. Good chance that is where this is headed,” he added.
“Q2 closes in just 2 weeks. Let’s see if bulls can keep the heat on.”
BTC/USD one-week chart. Source: SuperBro/X
Trader CrypNuevo also had the area just below the $70,000 boundary in sight for the week.
“Still seeing a recovery to the mid-range $69k,” he wrote in his X analysis.
CrypNuevo warned that BTC/USD could still return to local lows as part of range-bound trading.
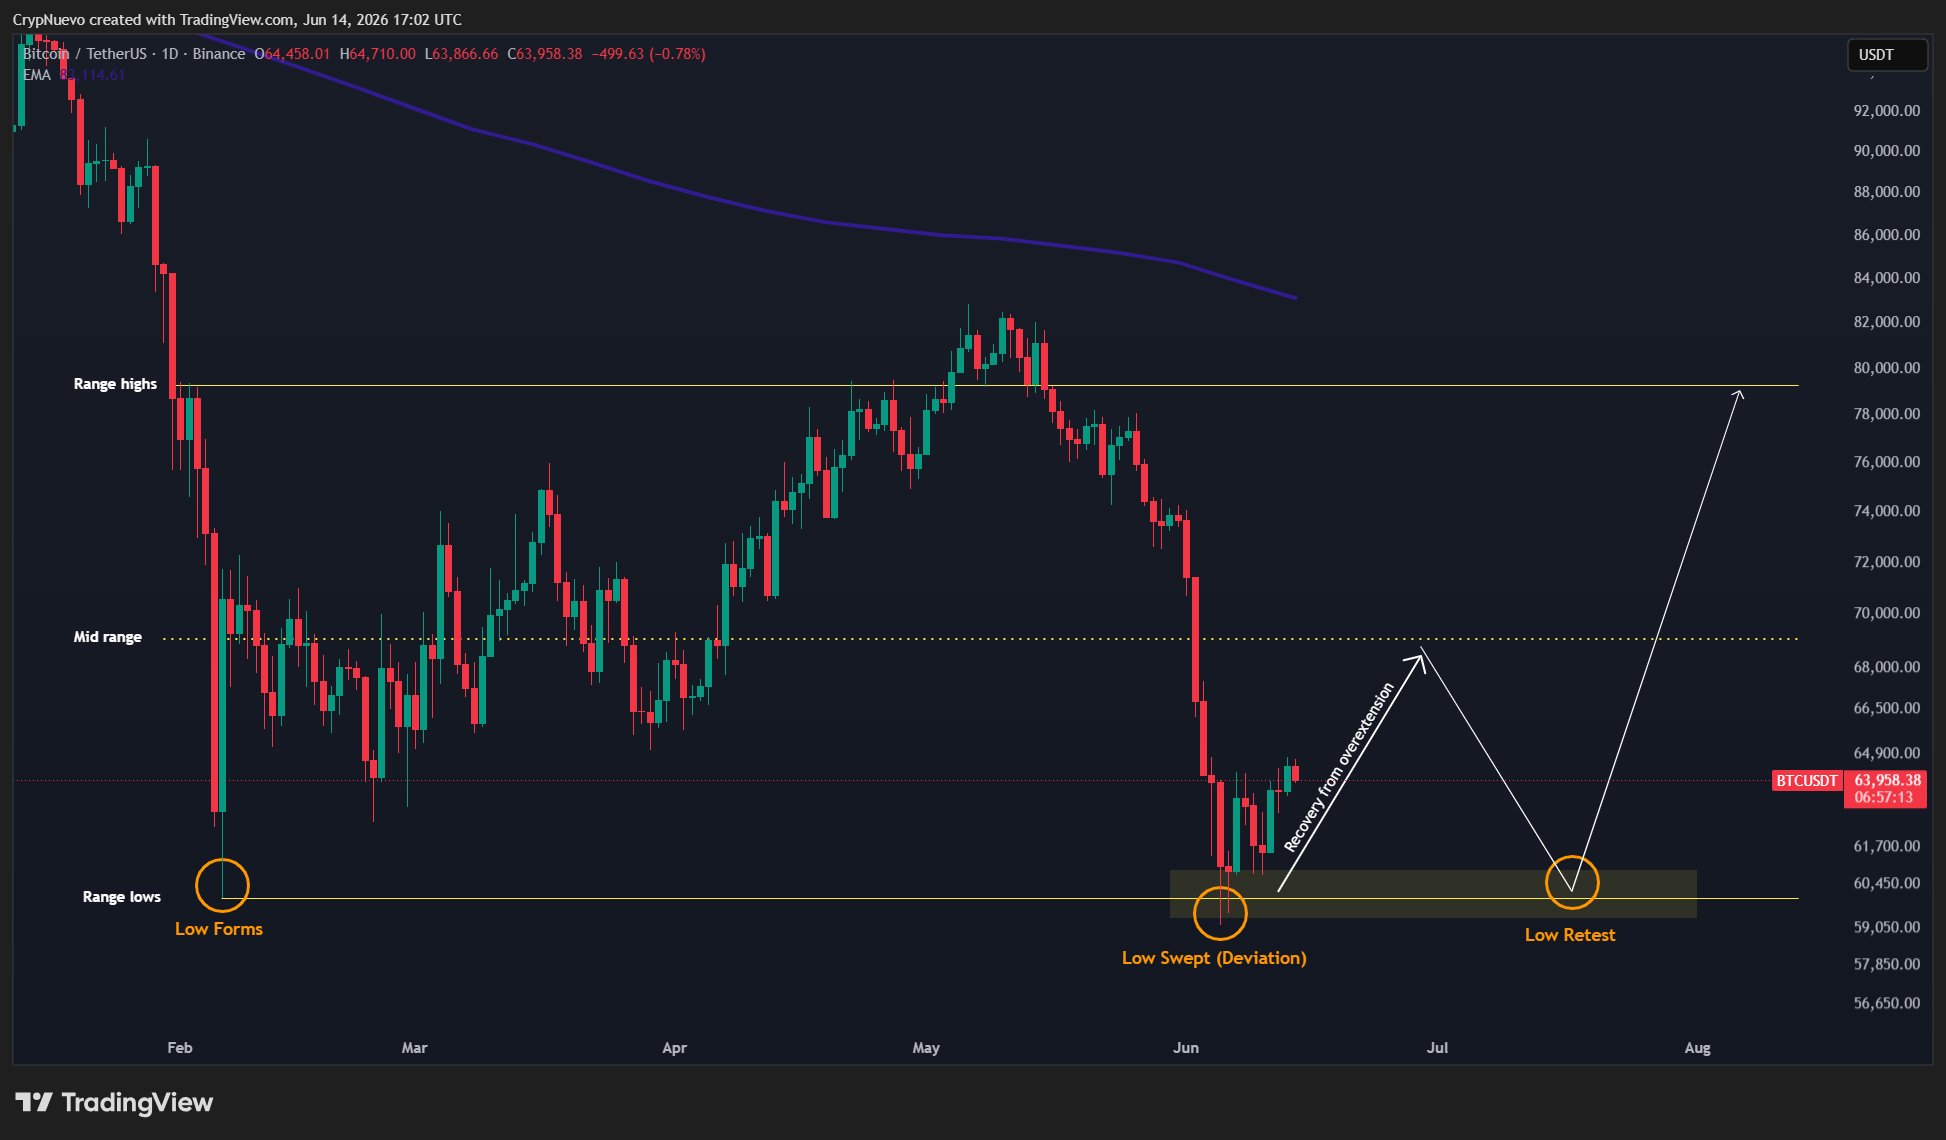
BTC/USDT one-day chart. Source: CrypNuevo/X
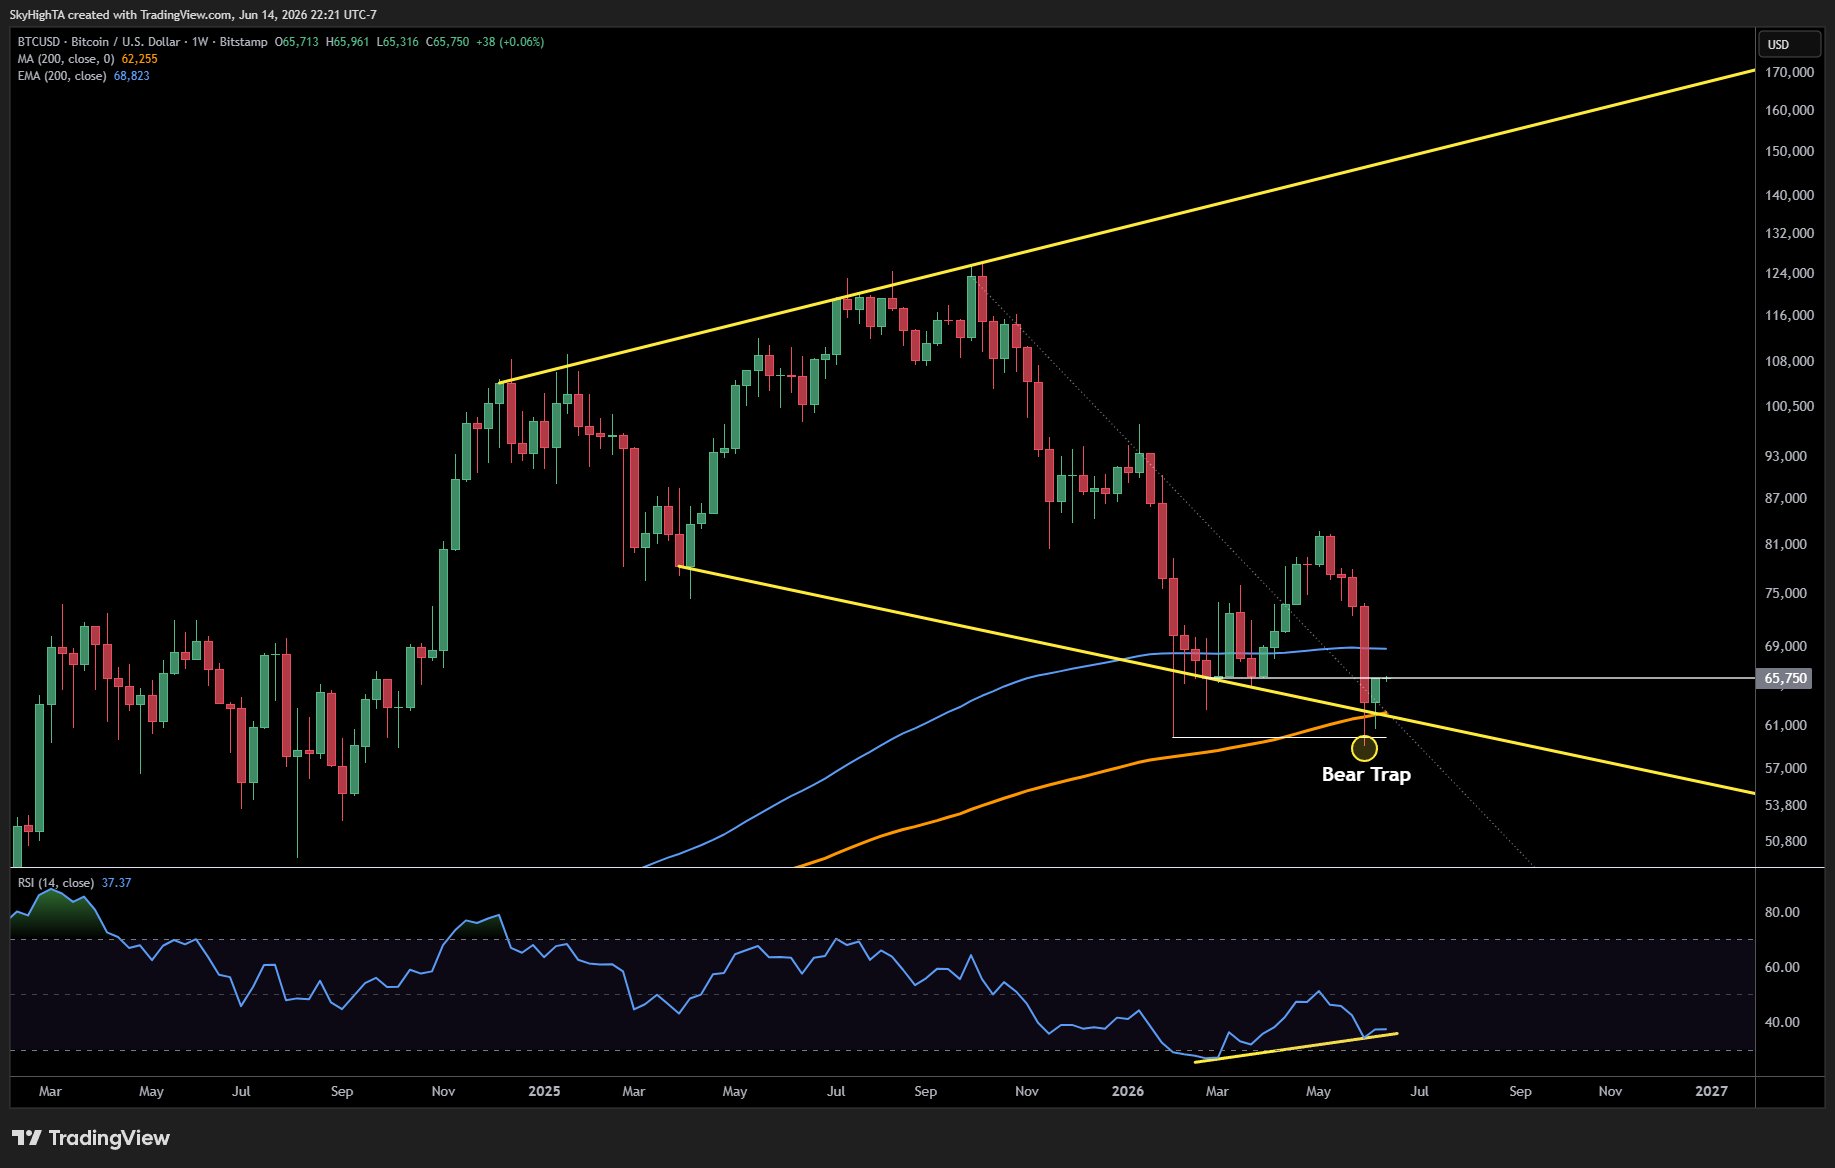
Trader and analyst Rekt Capital agreed, stressing that price rebounds tend to become weaker as bear markets progress, along with key support — in this case the $60,000 mark.
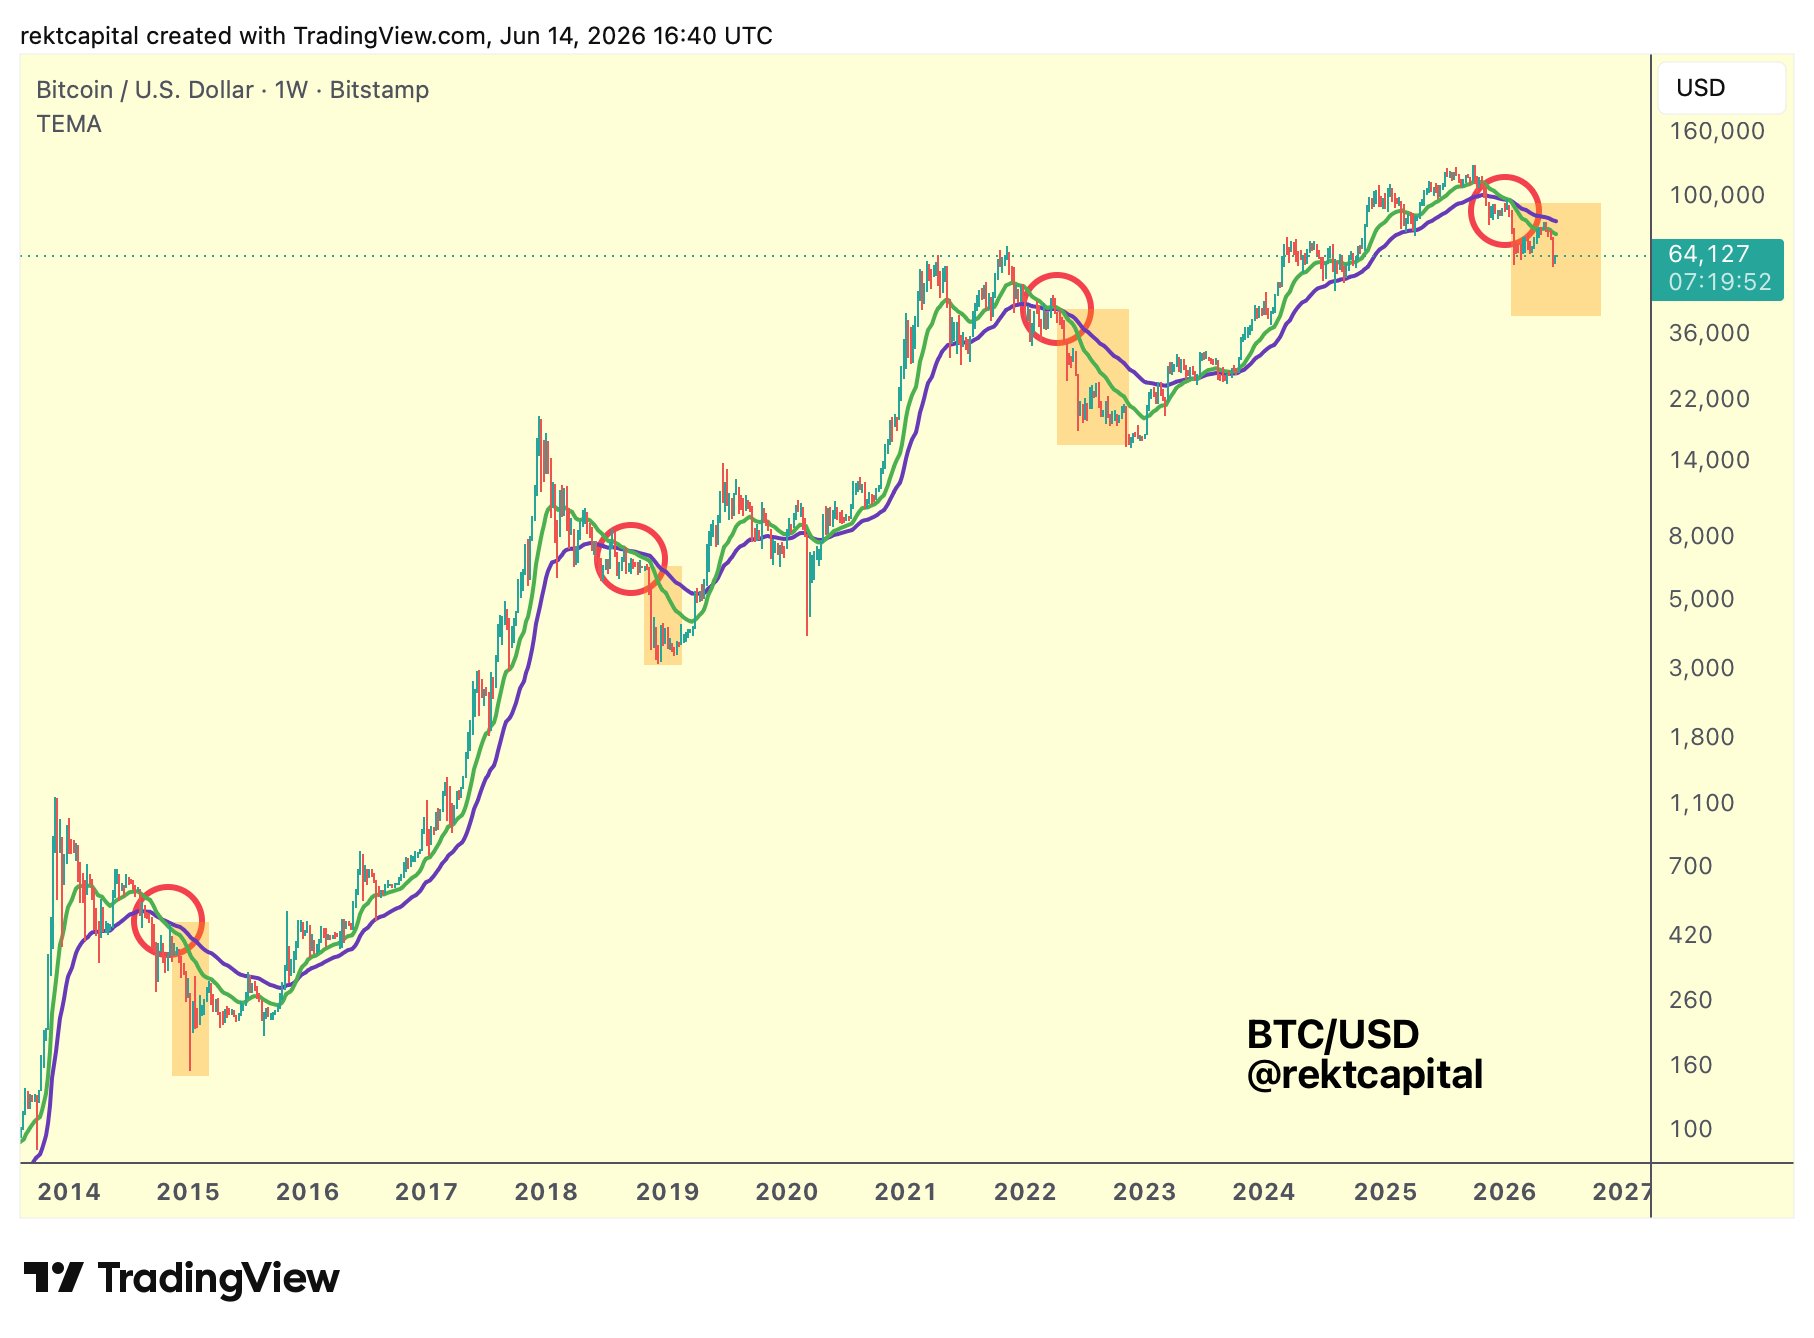
BTC/USD one-week chart. Source: Rekt Capital/X
New Fed chair under pressure on rate cut
Against the backdrop of serious geopolitical flux, “all eyes” nonetheless remain on the US Federal Reserve.
On Wednesday, the Fed’s new chair, Kevin Warsh, will lead his first meeting to decide on interest-rate changes.
Given the inflationary catalyst that the Iran war has become, markets see barely any chance of Warsh cutting rates — but Trump has repeatedly called for that very outcome.
In an interview in April, Trump told mainstream media that he “would” be disappointed if Warsh did not deliver a cut at the first opportunity.
“All eyes are on the Fed this week,” trading resource The Kobeissi Letter summarized in its latest X analysis.
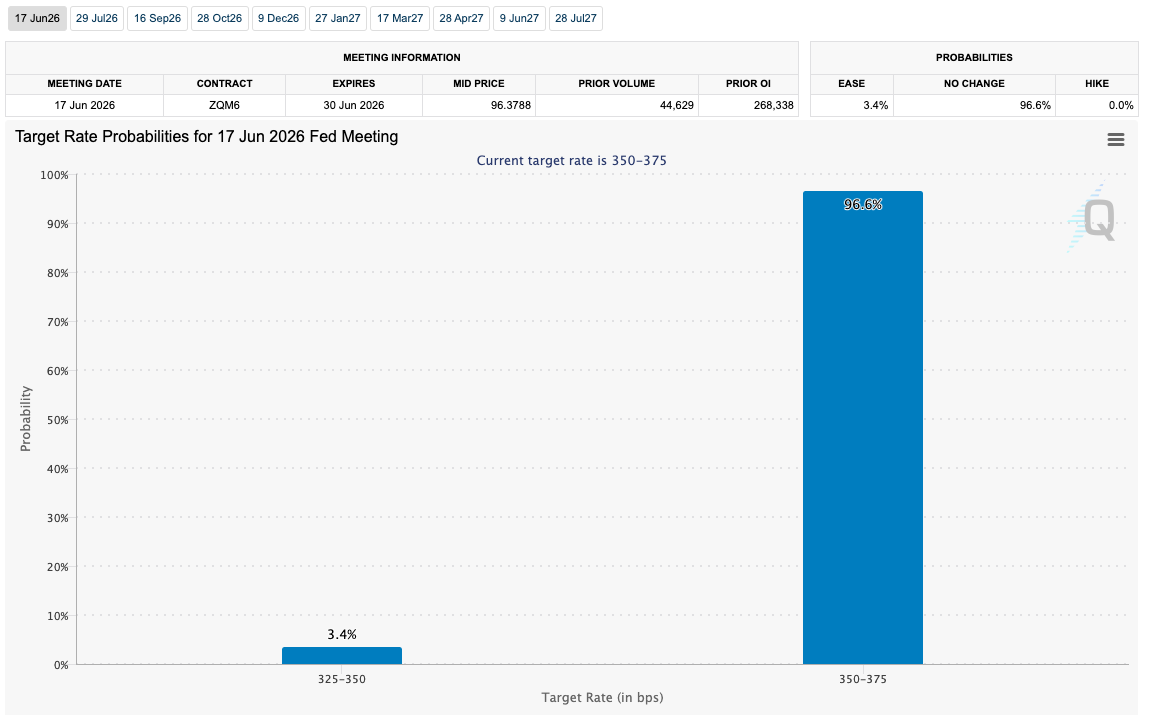
Fed target rate probabilities for Wednesday FOMC meeting (screenshot). Source: CME Group
The latest data from CME Group’s FedWatch Tool puts the odds of a minimal 0.25% cut at just 3.4%.
Reacting, commentators overwhelmingly see rates remaining at current levels.
In analysis on Sunday, Dayan described Warsh as “trapped no matter what he does.”
“If he is hawkish, he will be breaking promises made to Trump,” he wrote.
“On the other hand, if he uses the recent decline in oil prices as a reason for a wait and see stance, I think he is raising the odds we will see a panic hike in the second half of the year as the economy overheats.”
US markets will have a shorter four-day week, with Wall Street closed Friday for the Juneteenth holiday.
Whales deliver “rock-solid floor”
In a boost for Bitcoin bulls, new analysis reveals a potential sea change in large-volume investor mentality in recent days.
Bitcoin whales, according to onchain analytics platform CryptoQuant, have become buyers again.
Looking at exchange inflows from whale wallets, CryptoQuant data shows that coin days destroyed (CDD) — the number of days funds spent dormant after last moving — have significantly cooled.
“Inflow CDD plunged from 2.16M to near-zero (33K), showing long-term whale dumping has completely stopped,” contributor Woo Minkyu wrote in a Quicktake blog post on Monday.
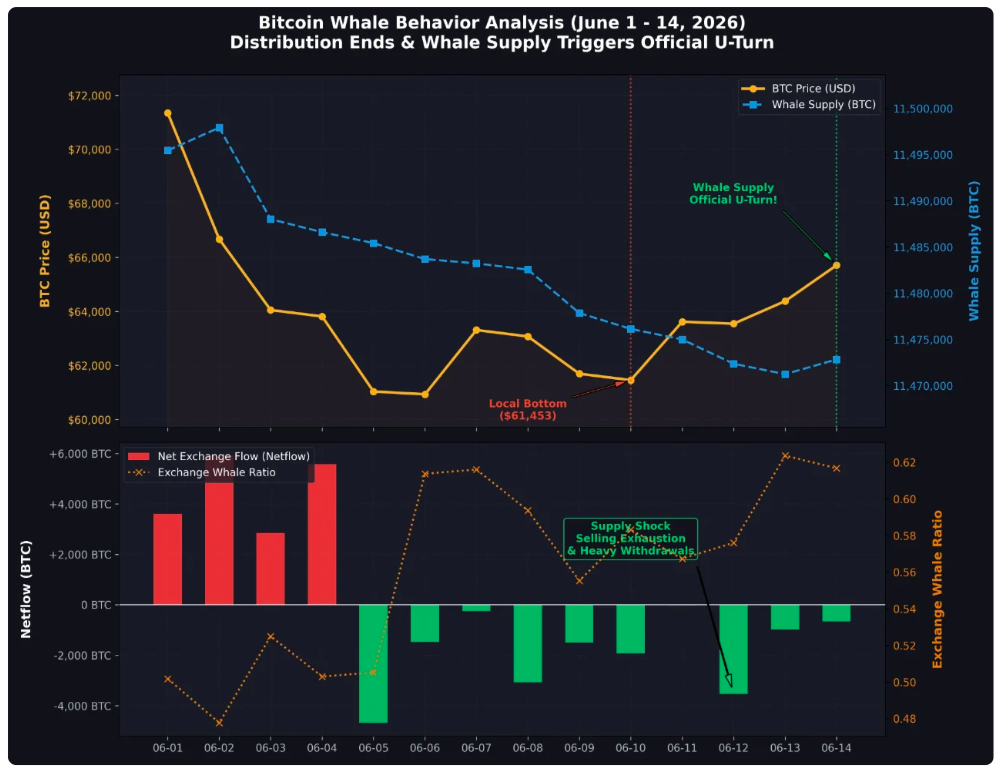
Bitcoin whale data (screenshot). Source: CryptoQuant
Woo described whales as putting in an “aggressive bottom buy” at around $61,000, absorbing “all” coins panic sold by other investor cohorts.
“The wealth transfer from weak hands to strong hands is complete,” he concluded.
“Whales have locked in the $60,000–$61,500 range as a rock-solid floor. With exchange reserves depleted, the path of least resistance for Bitcoin is now firmly upward.”
Earlier, Cointelegraph reported that three key conditions for a BTC price rebound were almost satisfied. Whales on Hyperliquid and Bitfinex, analysis said at the time, were already positioned for a bounce.
Bitcoin apparent demand stays negative
When it comes to a full bull-market rebound, CryptoQuant remains cautious in light of current onchain data.
Related: Bitcoin miner ‘capitulation’ comes as trader sees later 2026 bear-market bottom
Apparent demand, contributor XWIN Japan notes, is still negative — something that has always coincided with bear markets in the past.
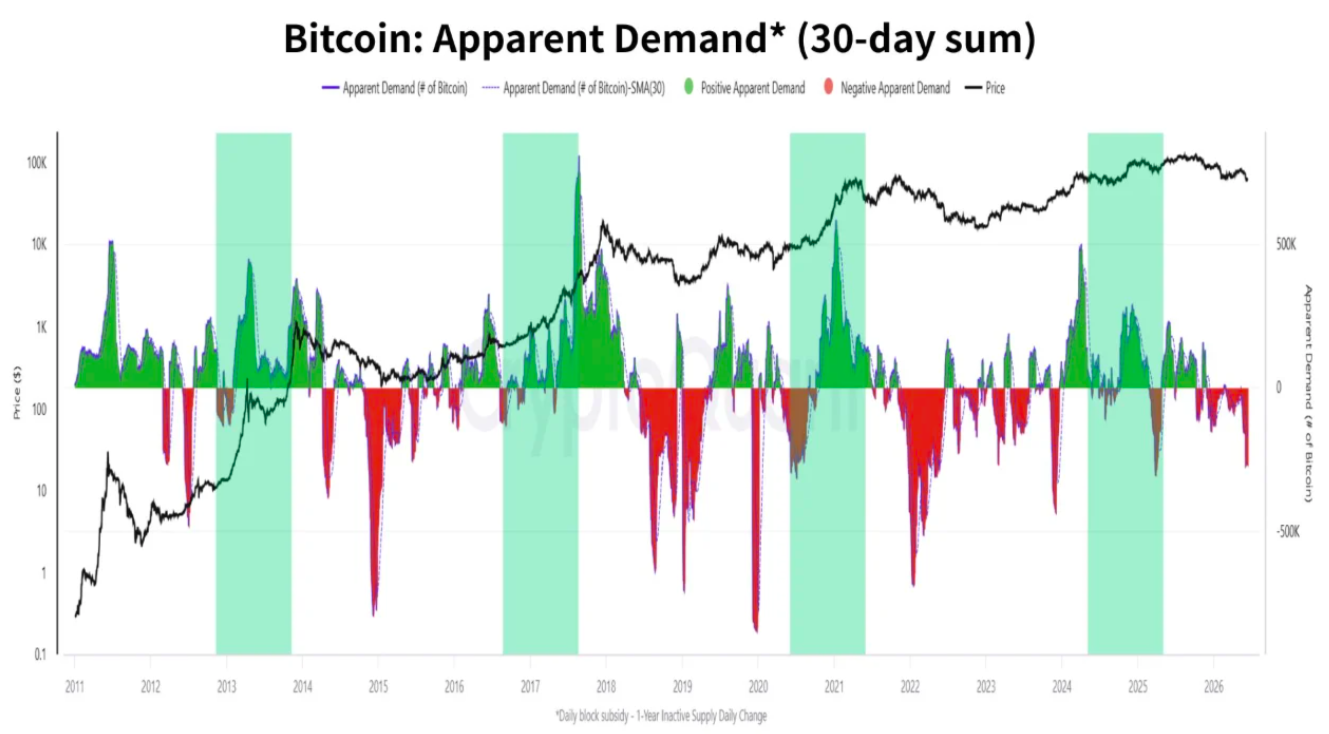
Bitcoin apparent demand (screenshot). Source: CryptoQuant
Apparent demand is the difference between Bitcoin’s issuance — or newly mined coins — and the supply inactive for over a year.
“If the decrease in inventory exceeds production, demand is increasing, and vice versa,” CryptoQuant head of research Julio Moreno explains.
Accordingly, current negative values signal a broad lack of interest in BTC exposure and may even override the four-year cycle theory to dictate future price action, XWIN says.
“This suggests that Bitcoin may not be declining simply because ‘the cycle says so.’ Instead, demand growth has slowed,” it wrote this weekend.
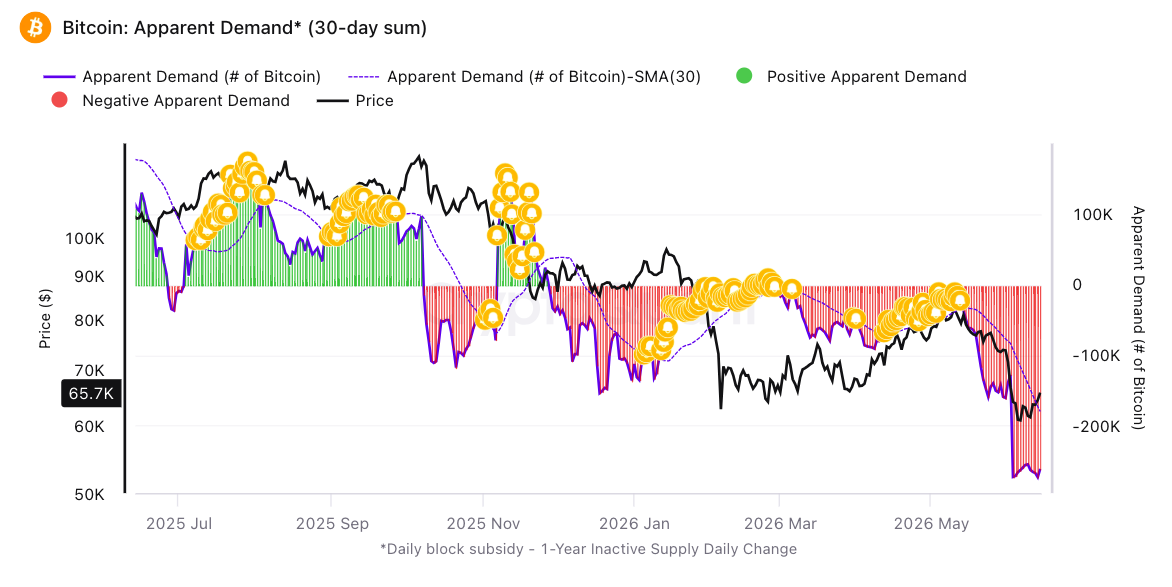
Bitcoin apparent demand (screenshot). Source: CryptoQuant
XWIN also pointed to declining open interest on Bitcoin futures markets while echoing the theory that a final “capitulation” event may yet occur.

Two weeks after announcing its first BTC sale in roughly four years, the Michael Saylor-founded business intelligence giant has reaffirmed its support for bitcoin, acquiring another 1,587 units for approximately $100 million.
The average purchase price was just over $63,000, and the company has also increased its USD stash by another $100 million to $1.1 billion. Its total crypto fortune has grown to 846,842 BTC, currently valued at almost $56 billion.
Strategy has acquired 1,587 BTC for $100 million to increase our $BTC Reserve to ₿846,842. We have also increased our USD Reserve by $100 million to $1.1 billion. $MSTR $STRC https://t.co/27PYXJN7GD
— Michael Saylor (@saylor) June 15, 2026
Recall that Strategy sold off 32 BTC a couple of weeks ago, which, despite what some critics claimed, wasn’t a capitulation event. Instead, it was necessary to support preferred stock distributions, including cash dividends across the firm’s stock series.
Aside from FUD that was among the reasons behind bitcoin’s price collapse to a 19-month low beneath $60,000, Strategy’s decision raised some eyebrows within the community and prompted Jim Cramer to say that the firm and its co-founder had “killed” the cryptocurrency.
Saylor was quick to respond, refuting the FUD and indicating that he never said the company would not sell any BTC when it becomes necessary. However, he remains a firm believer that individual investors should refrain from dumping their bitcoin.
Moreover, Strategy resumed its accumulation spree last week, buying 1,550 BTC for just over $100 million.
Prominent crypto figures, such as Samson Mow and Lyn Alden, defended BTC, arguing that if a single entity that likes it so much to buy it cannot kill it with one decision to sell a tiny portion of its holdings.
The post Strategy Buys Another 1,587 BTC as Bitcoin Sale FUD Fades Away appeared first on CryptoPotato.

Crypto’s market structure bill cleared committee and then walked into a trap with two jaws. One fight is about the President’s crypto fortune. The other is about whether writing code makes you a money transmitter. Neither side will move, and the clock is running out.
Summary
- The CLARITY Act is no longer stuck on one dispute. It is trapped between an ethics fight and a developer-liability fight at the same time.
- The ethics fight centers on whether crypto conflict-of-interest rules should have enforcement teeth strong enough to reach the President’s crypto holdings.
- Section 604 has become its own veto point because developers think it is already too weak, while law enforcement argues it is still too broad.
- The bill’s biggest enemy may now be the calendar. With only 31 Senate session days before the August recess, unresolved disputes could push the framework beyond 2026.
A month ago the CLARITY Act looked close to inevitable. The Senate Banking Committee had advanced it 15 to 9 on May 14, two Democrats had crossed the aisle, the bill landed on the Senate Legislative Calendar on June 1, and prediction markets priced its 2026 passage near 74%. Senator Cynthia Lummis, one of its architects, called the committee vote the most consequential Senate action on crypto regulation in history. The industry allowed itself to believe the market structure bill it had wanted for years was finally going to happen.
Then the trap closed. By mid-June, Polymarket’s passage odds had fallen to roughly 48%, a coin flip, down 26 points in a month. An ethics agreement that negotiators thought they had collapsed in a closed-door meeting on a Tuesday. A second front opened almost simultaneously, with the nation’s largest law enforcement organizations mobilizing against a single section of the bill.
Two Democratic senators tied their votes to the first fight, two more tied theirs to the second, and the bill that needed seven Democratic crossovers to reach 60 suddenly faced four senators pulling in incompatible directions. With 31 Senate session days left before the August recess, CLARITY Act is stuck, and it is stuck in the worst possible way: not from a single objection that could be negotiated away, but from two unrelated poison pills lodged on opposite sides of the bill, each defended by people who will not move.
What follows lays out the trap: the two fights, why each is intractable on its own, why they are far worse together, the irony that connects them through one section of the bill, and what a two-sided stall means for whether crypto gets its framework in 2026 or starts over from nothing.
Poison pill one: the President’s crypto fortune
First, the fight most people know about, and it is intractable because it is not really about crypto at all. Democrats on the Banking Committee conditioned their support on ethics provisions restricting government officials from conflicts of interest in crypto, a demand driven directly by the business activities of President Trump’s family. The scale of those activities is the reason the demand will not go away: since returning to office, Trump and his family have generated an estimated $2.3 billion from crypto ventures, according to Reuters, spanning a personal memecoin, a family-linked venture with its own token and a dollar stablecoin, mining interests, and a media company with a crypto treasury. No previous administration has held positions remotely like these while crypto legislation moved through Congress, and the legislation itself would shape the value of several of them.
For Democrats, a market structure law written without ethics rails would mean regulating an industry in which the signing official holds billions in personal positions. Senator Ruben Gallego, one of the two Democrats who supplied the decisive committee votes, drew the line in public: the group had come close but not finished an agreement on ethics guardrails for all elected officials, and if it was not resolved by the floor vote, he was not afraid to vote no. Senator Angela Alsobrooks, the other crossover, has signaled she may need further negotiation before committing on the floor. The two votes that carried the bill out of committee are explicitly conditional, and the condition is ethics.
The White House holds its own line, and the two lines do not meet. The administration will accept rules that apply across the board, from the President down to the newest intern, but rejects anything it reads as targeting a specific officeholder. That formula sounds like room for compromise until you watch what happens when negotiators try to write it down, which is exactly what happened on the Tuesday the deal collapsed.
How the ethics deal actually collapsed
The collapse is worth getting right in detail, because it reveals why this fight resists the usual legislative solvent of splitting the difference. The closed-door meeting brought together Senators Kirsten Gillibrand, Gallego, Bernie Moreno, and Lummis, along with White House Crypto Council director Patrick Witt. It was the first ethics meeting since a bipartisan group reached a tentative framework back in May, and it was supposed to convert that framework into agreed text. It collapsed when Republicans and the White House withdrew a specific provision: language that would have let state attorneys general sue the Department of Justice over failures to enforce ethics rules tied to the President’s crypto interests.
That withdrawn provision contains the whole fight. An ethics rule without an enforcement mechanism is a statement of principle; an ethics rule that lets state AGs sue the DOJ for not enforcing it is a weapon, one that could be pointed directly at the administration’s handling of the President’s holdings. Democrats wanted the enforcement teeth precisely because a rule the DOJ can decline to enforce is, against this administration, no rule at all. The White House withdrew the teeth precisely because a mechanism letting partisan state AGs drag the DOJ into court over the President’s businesses is the targeting it said it would never accept.
Both sides are correct about what the provision does, which is why neither will yield. The enforcement teeth are the compromise and the dealbreaker at the same time, depending on which side of the table you sit. A true poison pill works this way. It is not a number to be split or a date to be moved. It is a binary, where the thing one side needs to vote yes is the precise thing the other side cannot accept, and no drafting cleverness dissolves it, because the disagreement is about the underlying reality the words describe, not the words.
This is why the conflict-of-interest fight examined in depth matters so much to the bill’s floor math. It is not just a messaging dispute around Trump’s crypto activity. It is the condition attached to the very Democratic votes that helped the bill leave committee.
Poison pill two: is writing code money transmission?
Second, the fight almost nobody outside the policy weeds is tracking, and it may be the more dangerous of the two because it pits the crypto industry’s allies against each other. Section 604 of the Senate draft is the Blockchain Regulatory Certainty Act, and its purpose is to settle a question that has hung over crypto development for a decade: is a person who writes blockchain software, but who cannot control or move users’ assets, a money transmitter subject to the full weight of financial-surveillance law? Section 604 says no. It defines a non-controlling developer or provider as one lacking the legal right or unilateral ability to control or initiate user transactions, and it limits money-transmitter treatment to parties who actually control or move assets, leaving developers who write distributed-ledger software, build self-custody tools, or support blockchain infrastructure outside that classification.
For the crypto industry, Section 604 is close to sacred. It codifies a principle the Department of Justice itself articulated in 2025, when a senior official said that merely writing code, without ill intent, is not a crime. It protects the open-source developers who build the rails without ever touching user funds, and stripping it would leave them exposed to prosecution as unlicensed money transmitters for the act of publishing software. When crypto industry heavyweights signed letters urging the Senate to pass CLARITY, the phrase they kept repeating was “with developer protections intact.” Section 604 is the protection they mean.
For law enforcement, Section 604 is a loophole. The National Sheriffs’ Association, the Fraternal Order of Police, and the National District Attorneys’ Association have mobilized against it, arguing the provision could make it harder to pursue bad actors operating on-chain, hampering investigations into money laundering and other illicit finance. Their case rests on real numbers: TRM Labs estimated illicit crypto volume reached $158 billion in 2025, up nearly 145% from the prior year, and the FBI’s 2025 report found crypto investment fraud alone generated $7.2 billion in reported losses. The police organizations worry that a statute placing developers categorically outside money-transmitter rules removes a tool they use to reach the infrastructure criminals rely on.
Why the second fight has its own veto bloc
Law enforcement’s objection would be background noise if it did not come attached to votes, and it does. Senators Mark Warner and Catherine Cortez Masto have tied their support for CLARITY Act to law enforcement’s sign-off on Section 604. That sentence is the structural problem. The bill already needs roughly seven Democrats beyond the two committee crossovers to clear the 60-vote threshold, and two of the most gettable Democrats have made their votes contingent not on ethics, the first poison pill, but on a completely separate objection that the crypto industry’s own allies consider an attack on the bill’s core protections.
The pro-crypto Democrats are not even unified among themselves: a group of five, Warner, Cortez Masto, Raphael Warnock, Alsobrooks, and Gallego, met in Warner’s office to discuss strategy before the committee markup, and they want different and partly incompatible things from the same bill. The White House sees the danger and is working the law enforcement front directly. The White House Crypto Council convened representatives from the major police and prosecutor organizations, alongside officials from the DOJ, Treasury, and FinCEN, to address the Section 604 objections, with crypto adviser Patrick Witt arguing the bill is pro-regulatory and pro-enforcement and that the developer language does not shield criminals.
Whether that lobbying succeeds is unknown, but its mere necessity tells the story: in June 2026, the administration is spending political capital persuading sheriffs, not just senators, because the sheriffs now hold a bloc of Democratic votes through Warner and Cortez Masto.
The cruel irony: one section, both directions
One detail in CLARITY’s stall is almost too neat, and most coverage misses it. Section 604 has already been cut once, and the cutting is what set up the current trap. In the frantic dealmaking before the May 14 committee vote, negotiators removed language from Section 301 of the bill that referenced the Blockchain Regulatory Certainty Act in Section 604, weakening the protections for non-custodial DeFi developers as the price of getting Gallego and Alsobrooks to yes. DeFi advocates raised alarms immediately, warning that the change could strip critical developer protections and leave open-source builders exposed to the vague standard of exercising control through agreements or understandings, which regulators could later stretch to cover governance-token voting or protocol participation.
The industry won the committee vote by partly sacrificing the developer protection it cares about most. Now watch the geometry that creates. The developer protection was already weakened to pass committee, which enraged the crypto-native DeFi camp. The remaining protection is still strong enough that law enforcement is fighting to weaken it further, which has captured Warner and Cortez Masto.
So Section 604 is simultaneously too weak for the developers who want it strengthened back and too strong for the police who want it cut more, and any move in either direction loses votes on the opposite side. Strengthen it to win back DeFi advocates and the broader developer base, and you harden the law enforcement bloc against the bill. Weaken it to satisfy the sheriffs and Warner and Cortez Masto, and you lose the developer-protection argument that is half the industry’s reason for wanting CLARITY Act at all. One section of one bill is being pulled in both directions at once, and there is no position for it that does not bleed votes somewhere.
That is why it functions as a two-sided poison pill instead of two separate problems. The ethics fight and the Section 604 fight are different disputes with different antagonists, but Section 604 itself contains a second internal poison pill, a provision that cannot be set anywhere on the dial without losing the votes the bill needs. A bill can sometimes route around one intractable clause. Routing around two, one of which is internally self-contradicting, inside 31 session days, is a different order of difficulty.
The vote math that makes it fatal
The arithmetic is where the two poison pills turn from survivable to fatal, because in a friendlier vote environment they would be neither. CLARITY Act needs 60 votes to break a filibuster. The committee vote was 15 to 9, mostly along party lines, with all 13 Republicans and just two Democrats. Reaching 60 on the floor requires roughly seven Democrats beyond those two, which means the bill must hold both committee crossovers and add five more, all from a caucus with two separate reasons to withhold support.
The two ethics-conditioned votes, Gallego and Alsobrooks, and the two enforcement-conditioned votes, Warner and Cortez Masto, are four of the most plausible Democratic yes votes, and all four are currently contingent on fights that point in incompatible directions. Satisfying the ethics bloc does nothing for the enforcement bloc, and vice versa. The bill cannot trade one group’s price for the other’s, because they are buying different things.
This is before even adding the third fight running inside the bill: the stablecoin-yield dispute between banks and crypto firms. That fight is not the central trap in this piece, but it shows how crowded the bill’s risk map has become. A market-structure bill that already had to solve the SEC-CFTC split is now carrying ethics, developer liability, law enforcement, and banking-industry pressure at the same time.
The calendar turns that difficulty into a deadline. With 31 session days before the August recess and no floor date yet announced, the bill needs floor time it has not been promised, in a Senate competing with appropriations, surveillance reauthorization, and everything else, during an election year that makes every Democratic vote to hand the administration a signing ceremony more costly as November approaches. Bill sponsors have suggested that if CLARITY Act does not pass in this window, reconsideration before 2030 is unlikely, which raises the stakes of the recess from a delay to a potential multi-year reset. Galaxy Research still estimates a 60 to 75% chance of passage in 2026 and a possible signing the week of August 3, but the prediction markets, at 48%, are pricing the two poison pills more pessimistically than the research desks, and the prediction markets moved 26 points in a month while the fundamentals deteriorated.
Why two pills are worse than twice one pill
Instinct treats two problems as additive, two fights to win instead of one. The reality is multiplicative, and understanding why explains the odds collapse. A single poison pill creates a negotiation with one axis. Both sides know what they are fighting over, the coalition that wants the bill can focus its energy on one compromise, and success requires moving one group.
Two poison pills on opposite sides create a negotiation with no stable solution, because every move to satisfy one bloc can alienate the other, and the coalition’s energy splits between two fronts that do not reinforce each other. Worse, the two fights attract different and partly opposed constituencies into the same bill: the ethics fight pulls in good-government Democrats and the White House’s defenders of presidential prerogative, while the Section 604 fight pulls in law enforcement and the open-source developer lobby, and these groups have no reason to trade with each other because they care about different sections. There is no grand bargain available, because a grand bargain requires the parties to want things they can exchange, and ethics hawks have nothing the sheriffs want.
A deeper problem: two simultaneous fights consume the one resource the bill cannot replace: time and floor attention inside a closing window. Even if each fight were individually winnable in three weeks, two fights running in parallel, each requiring leadership focus, each capable of reopening if the other’s solution disturbs the coalition, can easily consume the entire 31-day runway without either resolving. The bill does not need to lose either fight outright to die. It only needs both fights to stay unresolved when the recess arrives, and a two-front stall is far more likely to run out the clock than a one-front stall, because there are two ways to fail and they interfere with each other’s solutions.
What happens if the clock wins
At 48% odds, the failure scenario is no longer a tail risk, and it should be taken seriously instead of waved away. If neither poison pill is resolved before the August recess, the practical window for 2026 passage may close, and th e bill’s sponsors have suggested reconsideration could wait years. A reset would send the framework back to drafts in the next Congress, under unknown majorities after the midterms, with the GENIUS Act’s stablecoin rules as the only major crypto statute on the books and everything else, market structure, the SEC-CFTC jurisdiction split, the developer protections, the commodity classifications, left to agencies governing by enforcement and interpretation.
For the assets whose legal status CLARITY Act would settle, most consequentially the large non-Bitcoin tokens carrying classification overhangs, a reset means their agency-level treatment stays reversible by the next administration, which is the precise uncertainty that the statute exists to remove. That is what the bill would unlock for XRP if it passes, and why XRP remains the asset with the most riding on the outcome. If CLARITY Act stalls, XRP does not merely lose a near-term legislative catalyst. It loses the statutory certainty that ETF access alone could not provide.
A two-sided death carries its own irony: the bill would fail not because the country rejected crypto market structure, which polls as broadly bipartisan, but because two narrow and unrelated fights, one about one family’s holdings and one about the liability of software developers, occupied the same bill at the same time and neither could be settled before the calendar expired. CLARITY Act would die not from opposition to its purpose but from the geometry of its obstacles, which is a worse and more frustrating way for legislation to fail, because nobody actually voted against the thing itself.
What to watch
The next several weeks come down to a short watch list with the two pills as the axes. On the ethics front, watch whether any enforcement mechanism survives that both Democrats and the White House can accept, since the collapse centered on the state-AG-versus-DOJ provision, and watch Gallego and Alsobrooks specifically, whose public statements will move before their votes do. On the Section 604 front, watch the outcome of the White House Crypto Council’s law enforcement outreach, watch Warner and Cortez Masto for any sign the sheriffs have been satisfied, and watch the DeFi advocates for whether a strengthened developer protection re-enters the text, which would help one bloc while threatening the other.
Above both, watch the full procedural map and calendar: a floor date being scheduled at all would signal that leadership believes one or both pills are close to resolution, and continued silence on a date signals the opposite. And watch the prediction markets as a real-time gauge, since they fell from 74% to 48% as the pills hardened and will move first if either softens.
A bill caught in its own machinery
CLARITY’s stall is a specific kind of legislative tragedy, the kind where a bill with majority support and genuine momentum gets caught not by its enemies but by two unrelated disputes that happened to lodge in the same text at the same time. The ethics fight and the Section 604 fight have nothing to do with each other; one is about a President’s fortune and the other about a developer’s liability. They share only a vehicle, and that shared vehicle is now being pulled apart between them, with four senators holding votes hostage to two incompatible demands and a calendar that gives the coalition no time to satisfy both.
Cruelest of all is the symmetry. Each poison pill is defended by people with a real grievance: Democrats are right that regulating an industry while the signing official profits from it is a genuine conflict, and law enforcement is right that $158 billion in illicit volume is a real problem deserving real tools. Neither side is acting in bad faith, which is exactly why neither will fold, and a bill caught between two good-faith intractable positions is harder to save than one caught between a good-faith position and a bad-faith one.
The 48% on the prediction markets is not pessimism. It is an accurate reading of a bill that has to thread two needles pointing in opposite directions, inside a month, in an election year, and that has already watched one of the needles, Section 604, prove it cannot be threaded from either end. The clock, more than any senator, may end up casting the deciding vote.
Frequently Asked Questions
What are the two issues blocking the CLARITY Act?
Two unrelated disputes have stalled the bill. The first is an ethics fight: Democrats want provisions restricting government officials, especially President Trump and his family, from crypto conflicts of interest, after the family generated an estimated $2.3 billion from crypto ventures. The second is over Section 604, the Blockchain Regulatory Certainty Act, which protects software developers from being treated as money transmitters; law enforcement groups object that it could hamper investigations. Two Democratic senators are tied to each fight, and the demands point in incompatible directions.
What is Section 604 of the CLARITY Act?
Section 604 is the Blockchain Regulatory Certainty Act provision. It defines a non-controlling developer as one who cannot control or move user assets and limits money-transmitter treatment to parties who actually handle funds, shielding open-source developers who write blockchain software from prosecution as unlicensed money transmitters. The crypto industry considers it essential developer protection; the National Sheriffs’ Association, Fraternal Order of Police, and National District Attorneys’ Association argue it could make pursuing on-chain criminals harder.
Why did the CLARITY Act’s ethics agreement collapse?
A closed-door meeting collapsed when Republicans and the White House withdrew a provision that would have let state attorneys general sue the Department of Justice over failures to enforce ethics rules tied to the President’s crypto interests. Democrats wanted that enforcement mechanism because a rule the DOJ can decline to enforce is weak against the current administration; the White House rejected it as targeting the President. The enforcement teeth were both the compromise and the dealbreaker, which is why the meeting ended without agreement.
What are the CLARITY Act’s odds of passing in 2026?
Prediction markets price 2026 passage near 48% as of mid-June, down from 74% a month earlier, as the two poison pills hardened. Research desks are more optimistic, with Galaxy Research estimating 60 to 75% and a possible signing the week of August 3. The bill needs 60 Senate votes, roughly seven Democrats beyond the two committee crossovers, with 31 session days left before the August recess and no floor date scheduled.
Why are two problems so much harder than one for the bill?
A single dispute creates a negotiation with one axis that the bill’s coalition can focus on resolving. Two disputes on opposite sides create a negotiation with no stable solution, because satisfying one bloc can alienate the other, and the two fights attract different constituencies with nothing to trade. Section 604 makes it worse: it was already weakened once to pass committee, so it is now too weak for developers and too strong for police at the same time, meaning any move loses votes somewhere. The two fights also consume the scarce floor time the bill cannot replace.
What happens to crypto if the CLARITY Act fails in 2026?
If neither dispute resolves before the August recess, the 2026 window may close, and sponsors have suggested reconsideration could wait years. The framework would reset to drafts in the next Congress under post-midterm majorities, leaving the GENIUS Act’s stablecoin rules as the only major crypto statute and everything else, the SEC-CFTC split, developer protections, and commodity classifications, to agencies governing by enforcement and reversible interpretation. The assets most affected are the large non-Bitcoin tokens whose legal status the bill would have settled permanently.
As of June 15, 2026. Legislative status changes rapidly; verify the current state of negotiations before relying on this analysis. This article is information, not investment advice.


Elon Musk says reaching quadrillionaire status is “not impossible,” but would demand factories on the Moon and Mars to generate the economic scale required.
A social media post recently pointed out that Musk sits roughly $998.9 trillion short of the $1 quadrillion threshold. Rather than dismissing the scenario, Musk engaged with it directly, pointing to off-planet industrial expansion as the only credible path there.
Mass And Energy As Currency
Musk’s response drew attention for what it implied about the limits of wealth creation on a single planet. In his view, no amount of Earth-based activity gets a person to that figure.
“Not impossible, but definitely requires factories on the Moon and Mars to achieve.”
He then shifted the conversation toward what currency would even mean in such a future. Rather than pointing to a successor currency, Musk argued the concept of money itself may change form.
“By then, I don’t think dollars will be used as currency. Just mass and energy.”
The remarks land as SpaceX continues to expand its footprint. The company recently notched a historic $2 trillion IPO debut on Nasdaq, briefly ranking as the sixth most valuable US company. Musk has separately projected that SpaceX could hit its $1 trillion revenue target by 2030, though the company posted $18.7 billion in revenue for 2025.
The Musk Volcano Lair
The framing fits a pattern visible across Musk’s ventures. His SpaceX pay package ties 200 million super-voting shares to one condition: a permanent Mars colony of at least one million people. SpaceX has already assembled its first Mars flyby crew, selecting a crypto billionaire for the seat.
Musk also threw in a lighter note, joking about finally securing the “volcano lair” he has referenced publicly for years. The quip reflects his broader habit of anchoring outsize ambitions in the language of science fiction.
Ten facts about the SpaceX IPO illustrate how Musk has already shifted expectations around private company valuations. His quadrillionaire comments extend that same logic to an extreme, where planetary geography, not market conditions, sets the ceiling on what any individual or company can accumulate.
The post $998.9 Trillion to Go: Elon Musk Maps the Path to Quadrillionaire Status appeared first on BeInCrypto.


President Donald Trump said over the weekend that the U.S and Iran had reached a peace deal and will sign it on June 19.
Among other conditions, the agreement sees the removal of the U.S. naval blockade and the reopening of the Strait of Hormuz. Crude oil fell 5% to around $80 per barrel. It is now down roughly 33% from its early March high of $120.
Equity markets rose on the news. Indexes advanced worldwide, except in Tel Aviv, and U.S. stocks rallied in pre-market trading. The Invesco QQQ ETF, which tracks the Nasdaq 100 index, added 2% in pre-market trading.
Bitcoin and precious metals also gained. The largest cryptocurrency briefly topped $66,000, and was recently 2.7% higher over 24 hours, with most of the advance occurring on Sunday shortly after Trump’s announcement. Gold has risen nearly 3% over 24 hours to trade above $4,330 per ounce.
This extended ceasefire will remain in place for another 60 days, while talks on a final deal proceed. It’s worth keeping in mind the numerous shifts in negotiations over recent months, including ceasefires, breakdowns and renewed agreements, which suggest the path to a lasting resolution is unlikely to be straightforward

Key Highlights
-
Japanese exchange Bitbank issues suspension warning for Polymarket-related transactions.
-
Crypto transfers to prediction platforms could violate Japan’s gambling regulations.
-
Account freezes may block login, deposits, withdrawals, and trading capabilities.
-
Japanese crypto platforms increase monitoring of prediction market involvement.
-
Global regulatory pressure mounts on Polymarket and similar betting services.
Japanese cryptocurrency exchange Bitbank has issued a stern warning to its customer base regarding potential account suspensions linked to Polymarket activity. The platform indicated that any deposits or withdrawals connected to prediction market platforms could violate Japan’s gambling legislation. This development represents the latest challenge facing prediction markets as international regulatory bodies intensify oversight.
Exchange Identifies Prediction Platform Risks
According to Bitbank’s announcement, prediction market platforms enable participants to speculate on election outcomes, sporting events, and various future occurrences. These services frequently utilize digital currencies and typically operate beyond Japanese jurisdiction. Bitbank emphasized that Japanese residents using such platforms for profit-seeking purposes may face legal complications.
The trading platform specifically highlighted Polymarket as a representative example of these prediction services. Additional platforms offering wagering functionality were also referenced in the warning. Bitbank strongly advised its clientele to refrain from any transactions associated with these operations.
The exchange stated it reserves the right to freeze accounts upon detecting incoming or outgoing transfers linked to prediction markets. Bitbank indicated that similar or potentially related services might also prompt enforcement actions. Notably, the company did not reference any explicit governmental directive as the basis for this policy.
Suspension Measures Could Eliminate Platform Access
Bitbank outlined that users facing suspensions would be denied access to critical account features. The restrictions encompass account authentication, cryptocurrency deposits, digital asset withdrawals, fiat currency withdrawals, and all trading functionality. Consequently, impacted clients may encounter complete platform lockouts.
The exchange additionally clarified it would not assume liability for any losses resulting from enforcement actions. Users who believe their accounts were erroneously restricted may reach out to customer support for review. Bitbank confirmed it would examine such complaints through its established inquiry channels.
This announcement signals a more aggressive compliance approach among Japan’s cryptocurrency service providers. While Japanese authorities have yet to establish explicit regulations governing prediction markets, Bitbank’s preemptive measures demonstrate that exchanges may implement safeguards ahead of official regulatory framework.
Polymarket Confronts Expanding Regulatory Challenges
Polymarket currently identifies Japan as a prohibited territory within its user agreement and access restrictions. Despite this, the platform has expressed interest in Japanese market expansion, creating regulatory complications. Such ambitions may encounter significant obstacles given mounting legal apprehensions.
Prediction markets have attracted heightened regulatory attention because participants place bets on actual events and outcomes. Government agencies frequently evaluate these platforms under gambling statutes, derivatives regulations, and consumer protection frameworks. Cryptocurrency exchanges processing related transactions increasingly categorize such activity as elevated risk.
South Korean regulators have similarly launched investigations into local Polymarket participants regarding potential gambling law infractions. American regulatory agencies maintain ongoing surveillance of prediction markets for fraudulent activity and market manipulation. Within this regulatory environment, Bitbank has proactively implemented restrictions to minimize exposure before conflicts escalate.

Bitcoin enters the third week of June supported by a rare alignment of macro and on-chain signals: US-Iran ceasefire expectations have lifted risk sentiment, while oil prices have fallen sharply. At the same time, traders are watching a potential short squeeze as price consolidates above long-standing support levels.
However, analysts at CryptoQuant also flag that the picture is not fully bullish. Whale activity may have shifted toward accumulation, but “apparent demand” for BTC remains negative—an indicator that has historically coincided with bear-market conditions.
Key takeaways
- US-Iran ceasefire momentum pushed broader markets higher, with WTI crude slipping below $80—an environment that traders say can ease an important headwind for BTC.
- BTC has held key technical support around $60,000 and its long-term moving averages near the low-$60,000s, improving near-term upside odds.
- Several traders cited $69,000 as a likely short-term target, pointing to concentrated leveraged shorts in the $60,000s to high-$60,000s area.
- CryptoQuant data suggests exchange inflow “coin days destroyed” has cooled dramatically, implying large holders have stopped dumping and moved into aggressive accumulation near ~$61,000.
- Despite that whale reversal, CryptoQuant reports BTC “apparent demand” is still negative, which historically has tracked with weaker market phases.
Ceasefire hopes lift risk assets, oil breaks down
The week’s earliest catalyst was the prospect of de-escalation between the United States and Iran. Reports circulated over the weekend about a ceasefire sign-off window, which later shifted to a June 19 timeline, before multiple sources confirmed a broader agreement framework.
According to those accounts, the US and Iran would sign an agreement for a 60-day pause in hostilities alongside additional measures in Switzerland on Friday. In a Truth Social post, US President Donald Trump said the deal would include reopening the Strait of Hormuz—a critical global oil route—after the agreement is signed.
Trump’s message also linked the Strait reopening to improved conditions for mine removal and the resumption of oil flow. Market participants reacted quickly: US stock futures strengthened as risk appetite improved, and crypto followed the move.
Oil moved in the opposite direction. WTI crude fell below $80 per barrel for the first time since mid-April, according to the reporting. The shift matters for BTC because sustained strength in crude has often correlated with tighter macro conditions and can dampen crypto risk-taking.
BTC traders target a squeeze toward $69,000
With the macro lift filtering into crypto, traders moved to technical levels that define whether the market can extend its bounce. TradingView data referenced in the report showed local highs around $65,988 as the new week began.
Support has been reinforced near $60,000, with both the $60,000 area and Bitcoin’s 200-week simple moving average (SMA) near $62,000 described as key floor levels. One trader, SuperBro, argued that BTC closed near its highs on the weekly candle with minimal upper wick—an expression of bullish pressure—while also highlighting the 200-week exponential moving average (EMA) as a potential magnet for price.
SuperBro specifically pointed to leveraged shorts clustered around the 200 EMA area near $69,000. In his view, that concentration could increase the odds of a short squeeze if price keeps grinding upward. He also noted that the market is approaching quarterly closing dynamics (“Q2 closes in just 2 weeks”), a period when positioning and liquidity can shift.
Other analysts echoed the $69,000 recovery zone. CrypNuevo said he still expected a return toward the mid-$69,000 range, while cautioning that BTC could still revisit local lows as part of range-bound trade behavior. Rekt Capital added a broader bearish-market nuance: rebounds in bear markets often weaken over time, and key support—again, the $60,000 level—remains pivotal to whether bulls can build momentum.
The Fed’s first Warsh meeting becomes the next pressure point
Even with geopolitical risk easing in the headlines, attention quickly turned back to monetary policy. The US Federal Reserve’s new chair, Kevin Warsh, is scheduled to lead his first meeting where interest-rate changes will be decided.
Market expectations, as reflected in CME Group’s FedWatch Tool, suggest minimal odds of a meaningful cut. The report cited FedWatch estimates placing the probability of at least a 0.25% cut at just 3.4%. That framing aligns with the broader view that inflationary pressures—potentially reintroduced or amplified by geopolitical developments—make rate cuts difficult.
Still, political pressure adds complexity. The reporting noted that Trump has repeatedly called for rate cuts and, in an April interview referenced by Cointelegraph, said he would be disappointed if Warsh did not deliver a cut at the first opportunity. That tension—between White House preferences and the Fed’s likely inflation constraints—has been part of trader anxiety going into the meeting.
One commentary cited in the piece described Warsh as “trapped no matter what he does.” The logic: if he appears hawkish to control inflation, he risks breaking promises implied by Trump; if he waits based on oil’s decline, he may be setting the stage for future tightening if the economy overheats later in the year.
The immediate calendar also matters. The US market will run a shorter four-day week with Wall Street closed Friday for Juneteenth, which can affect liquidity and the way traders react to Fed-linked headlines.
Whale behavior improves—but demand indicators remain weak
On-chain data provided the most bullish counterweight: CryptoQuant says large holders have shifted from selling to buying. The analysis referenced in the report focused on exchange inflows associated with whale wallets, and how long coins had been dormant before moving.
CryptoQuant contributor Woo Minkyu wrote that “coin days destroyed” (CDD) plunged from about 2.16 million to near-zero (around 33,000). In plain terms, this signals that long-idle BTC sitting in whale-controlled wallets is no longer being pushed to exchanges in a way consistent with continued distribution. Minkyu characterized it as the end of long-term whale dumping.
He also described an “aggressive bottom buy” around $61,000, framing it as an absorption of “all” panic-sold coins from other investor cohorts. The report further quoted the view that whales have effectively locked in a “rock-solid floor” in the $60,000–$61,500 range, especially as exchange reserves appear to have been depleted.
Yet, CryptoQuant’s overall stance remains cautious because whale buying alone may not be enough to restart a durable uptrend. The report highlighted a separate CryptoQuant indicator: BTC “apparent demand,” attributed to XWIN Japan’s analysis.
Apparent demand is defined in the source as the difference between BTC issuance (newly mined coins) and supply that has remained inactive for over a year. Julio Moreno of CryptoQuant, cited in the report, explained that when inactive inventory declines faster than production, demand is increasing; when it rises relative to production, demand is weakening.
In the latest readings referenced, apparent demand still appears negative—an outcome the analyst says has historically matched bear markets. That negative condition can matter because it suggests that even if whales are stabilizing prices by absorbing sell pressure, broader market interest and willingness to build exposure may still be lagging.
XWIN also pointed to declining open interest in BTC futures markets and reiterated the possibility that a final “capitulation” event may still occur, a theme Cointelegraph previously covered in relation to bear-market dynamics.
What to watch next
BTC’s immediate direction may be shaped by two competing forces: the potential for a squeeze toward trader-cited resistance near $69,000 versus the risk that weaker apparent demand keeps rallies fragile. The next major test will likely come from the Fed decision under Kevin Warsh—and whether macro relief translates into sustained crypto inflows rather than a temporary rebound.

The U.S.-Iran peace deal reached over the weekend provided the stimulus many markets had been waiting for.
Oil fell more than 4% on news the Strait of Hormuz would reopen, copper jumped. MSCI’s broadest index of Asia-Pacific shares rallied 3% and Japan’s Nikkei 225 hit a record high.
Crypto markets, however, posted muted gains after the announcement, with the CoinDesk 20 Index (CD20) little changed since midnight UTC. The measure, however, is 2.4% higher over 24 hours.
Bitcoin held below $66,000, barely moving since midnight after adding 3.4% over the weekend. Ether’s (ETH) performance mirrored its larger peer. The biggest gains came in the smaller altcoins, with the CoinDesk 80 Index adding 1.5% since midnight.
The crypto market, reacting to geopolitics in the absence of industry-specific catalysts, has learned to distrust this particular headline. A ceasefire in April collapsed. U.S. strikes broke another truce on June 9. Both times, bitcoin gave back the relief rally. Today, traders appear not to be prepared to pay for an agreement that won’t be signed until the end of the week.

Bitcoin price is back above $65,000, gaining more than $3,000 in a day, although Washington helps, news from the other side of the world threatens the bullish prediction. The Bank of Japan is widely expected to raise its benchmark rate to 1% tomorrow, and the decision carries real tail risk for BTC.
What happens in Tokyo could determine if Bitcoin holds its current range or revisits the pre-June levels.
— Coin Bureau (@coinbureau) June 15, 2026
 BREAKING: JAPAN'S NIKKEI HITS NEW ATH RECORD 69,700
Nikkei just posted its largest one-day market cap gain in years, adding over $465 BILLION in a single session.
All eyes on the BOJ as its last four rate hikes triggered global market selloffs, with a fifth widely expected… pic.twitter.com/8WGE3SQARP
Leveraged funds have stacked speculative yen short positions to over 115,000 contracts as of the week, the highest since November 2017, per CFTC data. Analysts are flagging a 20–30% Bitcoin decline if tightening signals trigger a sharp short squeeze, forcing an unwind of yen-funded carry trades that have quietly underwritten risk appetite across global markets for years.
Polymarket odds on a December BOJ hike sit near 98%; it’s a near-certain event with uncertain magnitude.
The carry trade channel is the direct transmission mechanism: investors borrow cheap yen, deploy into higher-yielding risk assets including crypto, and reverse the entire position when the yen strengthens.
Discover: The Best Crypto to Diversify Your Portfolio
Bitcoin Price Prediction: BOJ Tightening Pressure Mounts?
Bitcoin’s technical structure is not doing it any favors heading into the decision. Price just broke upward, but the blood might not be over. The $70,000 zone that was supposed to act as a floor has already been breached on a spot basis weeks ago, shifting that level to immediate resistance.
Key levels to watch are if a daily close below $63,000 opens the door to the $60,000 structural support band. Lose that, and under $60,000 becomes the next logical destination. On the upside, bulls need to reclaim $68,000with volume to neutralize near-term bearish momentum — without that, any relief rally is just noise.

However, for bulls, if BOJ hikes as priced but delivers dovish forward guidance, yen shorts could absorb the move gradually for Bitcoin to reclaim $70,000, then target $72,200. The July 2024 precedent is instructive: BTC dropped from ~$65,000 to $50,000 within a week of that BOJ decision.
Some technicians see long lower wicks and reduced forced liquidations as evidence of dip-buying — base-building rather than breakdown. That read is contingent on macro staying quiet, which is exactly the variable currently in play.
Discover: The Best Token Presales
Bitcoin Hyper Targets Early Mover Upside as Bitcoin Tests Key Levels
Spot BTC exposure into a BOJ event with 115,000 stacked yen shorts is a risk management conversation as much as a trading one. Traders rotating out of near-term BTC volatility are looking at asymmetric alternatives. The one gaining traction in that context is infrastructure-layer exposure rather than pure price beta.
Bitcoin Hyper ($HYPER) is positioning itself as the first Bitcoin Layer 2 with full Solana Virtual Machine (SVM) integration, a meaningful technical distinction that claims sub-Solana latency while preserving Bitcoin’s security model.
The presale has raised $32 million at a current price of $0.0136, with staking already live for early participants. The core pitch is practical: Bitcoin’s transaction speed and programmability limitations are genuine constraints on ecosystem growth, and an SVM-powered L2 with a decentralized canonical bridge addresses all three slow finality, high fees, and lack of smart contract functionality in one architecture.
Earlier coverage of the project noted Bitcoin consolidating at comparable price levels while HYPER’s rise gained momentum.
Research Bitcoin Hyper before the presale closes.
The post Bitcoin Price Prediction: Bank of Japan Rate Hike and Piling Yen Shorts Threaten BTC appeared first on Cryptonews.
Crypto World
This Week’s Market Catalysts: Fed Meeting, SpaceX (SPACEX) Debut, and U.S.-Iran Peace Agreement
Key Highlights
- An interim peace agreement between Washington and Tehran will be formally executed Friday in Switzerland
- SpaceX launched on public markets at $150 per share, achieving a historic $2.1 trillion valuation
- Federal Reserve Chair Kevin Warsh presides over his inaugural policy meeting Wednesday; no rate change anticipated
- Consumer price growth reached a three-year peak in May, creating policy challenges for the central bank
- Anthropic executives scheduled for White House discussions regarding discontinued advanced AI systems
Washington and Tehran have finalized an interim peace framework that may conclude over three months of hostilities. The diplomatic agreement will be formally executed in Switzerland this Friday. Pakistani Prime Minister Shehbaz Sharif verified that both countries have announced an immediate cessation of military activities across all theaters, including Lebanese territory.
President Trump indicated the agreement will facilitate the reopening of the Strait of Hormuz, a critical maritime corridor for global petroleum transport. Approximately 20% of worldwide oil shipments traversed this waterway prior to conflict eruption in late February. Trump noted a temporary postponement attributable to naval mine removal operations, projecting the strait will resume operations Friday.
Crude oil valuations declined following the announcement. International equity markets experienced gains. However, market observers caution that complete energy sector normalization will require extended timeframes. Rystad Energy calculates the confrontation has already eliminated one billion barrels from global supply, with projections suggesting this figure could approach two billion by year’s conclusion.
Warsh Assumes Federal Reserve Leadership Role
Wednesday represents Federal Reserve Chair Kevin Warsh’s inaugural Federal Open Market Committee session since his May 22 oath of office. Market participants broadly anticipate interest rates will remain unchanged.
Inflationary pressures persist at elevated levels. May’s consumer price index registered its steepest acceleration since 2023. Producer price metrics reached their most significant rate since November 2022. Employment figures have similarly exceeded forecasts across multiple consecutive months.
Warsh has historically advocated against excessive specificity in forward policy guidance. This methodology may heighten market responsiveness to incoming economic indicators in subsequent periods.
President Trump has advocated for rate reductions. Nevertheless, economists emphasize current economic conditions bear little resemblance to circumstances surrounding the Fed’s previous easing cycle. Several strategists have identified artificial intelligence capital expenditure as a potential contributor to near-term inflationary dynamics, further complicating policy deliberations.
Vital Knowledge analysts project Wednesday’s statement will eliminate references to the Fed’s easing inclination. They suggest Warsh might still adopt accommodative messaging during his press briefing if he connects prospective rate cuts to successful Iran diplomatic resolution.
SpaceX Achieves Unprecedented Market Milestone
SpaceX commenced trading on the Nasdaq exchange last Friday, debuting at $150 per share. This represented an 11% premium above its $135 initial offering price. Share value appreciated approximately 20% during the trading session.
The aerospace manufacturer’s market capitalization reached approximately $2.1 trillion, positioning it among America’s most valuable publicly traded corporations. The offering mobilized more capital than any previous public market transaction in financial history. Elon Musk achieved trillionaire status for the first time in the contemporary economic era as a consequence.
Retail market participants acquired $117.6 million in shares during the inaugural trading day exclusively. Market analysts have identified potential price instability ahead attributed to SpaceX’s limited public float and elevated valuation metrics.
Musk announced Sunday that SpaceX could potentially achieve $1 trillion in annual revenues by 2030. The enterprise generated $18.7 billion throughout 2025.
SpaceX’s public market debut may additionally indicate robust investor demand for additional large-scale technology offerings. Anthropic, the artificial intelligence venture responsible for Claude, recently submitted confidential IPO documentation. Senior Anthropic personnel are scheduled to convene with White House representatives this week. These discussions seek to address a disagreement that compelled the organization to discontinue its most sophisticated AI models on a global basis.
The Bank of Japan is similarly projected to increase rates to levels unseen in over three decades Monday evening, while the Bank of England is forecast to maintain its 3.75% benchmark Thursday.
Long-Awaited ‘Dead by Daylight’ Movie Officially Has a Director
Cooling ingredients in vapes might cause irregular heartbeats

Dividend Harvesting Portfolio Week 276: $27,600 Allocated, $3,076 In Projected Dividends


-

 Business21 hours ago
No Jackpot Winner as $257 Million Prize Rolls Over to $269 Million Monday Draw
-

 Crypto World4 days ago
Oppenheimer backs SpaceX as $70 billion retail frenzy builds
-

 Crypto World4 days ago
Markets Rally as SpaceX IPO Looms Amid Iran Tensions and Inflation Surge
-

 Fashion3 days ago
Weekend Open Thread: Tuckernuck – Corporette.com
-

 Sports7 days ago
FIFA WC 2026 Group C: Morocco, Scotland challenge Brazil’s hunt for glory | FIFA World Cup 2022
-
Crypto World13 hours ago
Zimbabwe Requires Crypto Businesses to Register Annually Under New FIU Regulations
-

 Entertainment6 days ago
The Ryan Gosling True Crime Thriller On Netflix That Gets Even Stranger, Stream It Now
-
 Sports6 days ago
Bangladesh beat Australia after 20 years in ODIs, register only their second win over six-time world champions | Cricket News
-

 Tech3 days ago
This Week In Security: Microsoft On Microsoft, Register Your Domains, Linux On ARM, And FreeBSD Joins The File Cache Club
-

 Tech2 days ago
NanoClaw integrates JFrog registries to secure AI agent downloads
-

 Crypto World2 days ago
Bitget enters Argentina’s regulated crypto market through PSAV registration
-

 Politics4 days ago
Politics Home | Healey Resignation Is “Colossal Failure Of Government”, Says Former Labour Defence Secretary
-

 Tech5 days ago
‘This is Seattle’s position on AI’: City Council votes unanimously to pause big new data centers
-
 Tech4 days ago
Dutton Ranch star claims they ‘didn’t see any disruption’ on set following Chad Feehan’s exit from Yellowstone spinoff fueled by Taylor Sheridan clash rumors
-

 NewsBeat4 days ago
El Nino has formed in the Pacific and could set records, forecasters say
-
 Entertainment4 days ago
Donnie Wahlberg & More Heat Up Las Vegas at Circa’s Barry’s Downtown Prime
-

 Sports4 days ago
First Time Since 1971: Australia Register Historic Low In ODI Cricket
-
 Tech4 days ago
Opendoor Ends India Operations, Fueling a Bigger Conversation About AI and Outsourcing
-

 Politics4 days ago
Belfast burns, while Met chief points finger at Iran and Russia
-

 NewsBeat3 days ago
FBI searches office of Ohio voter registration group
You must be logged in to post a comment Login