

Crypto World
IP Rallies 15% as Story Protocol Abandons Broad Vision for AI Data
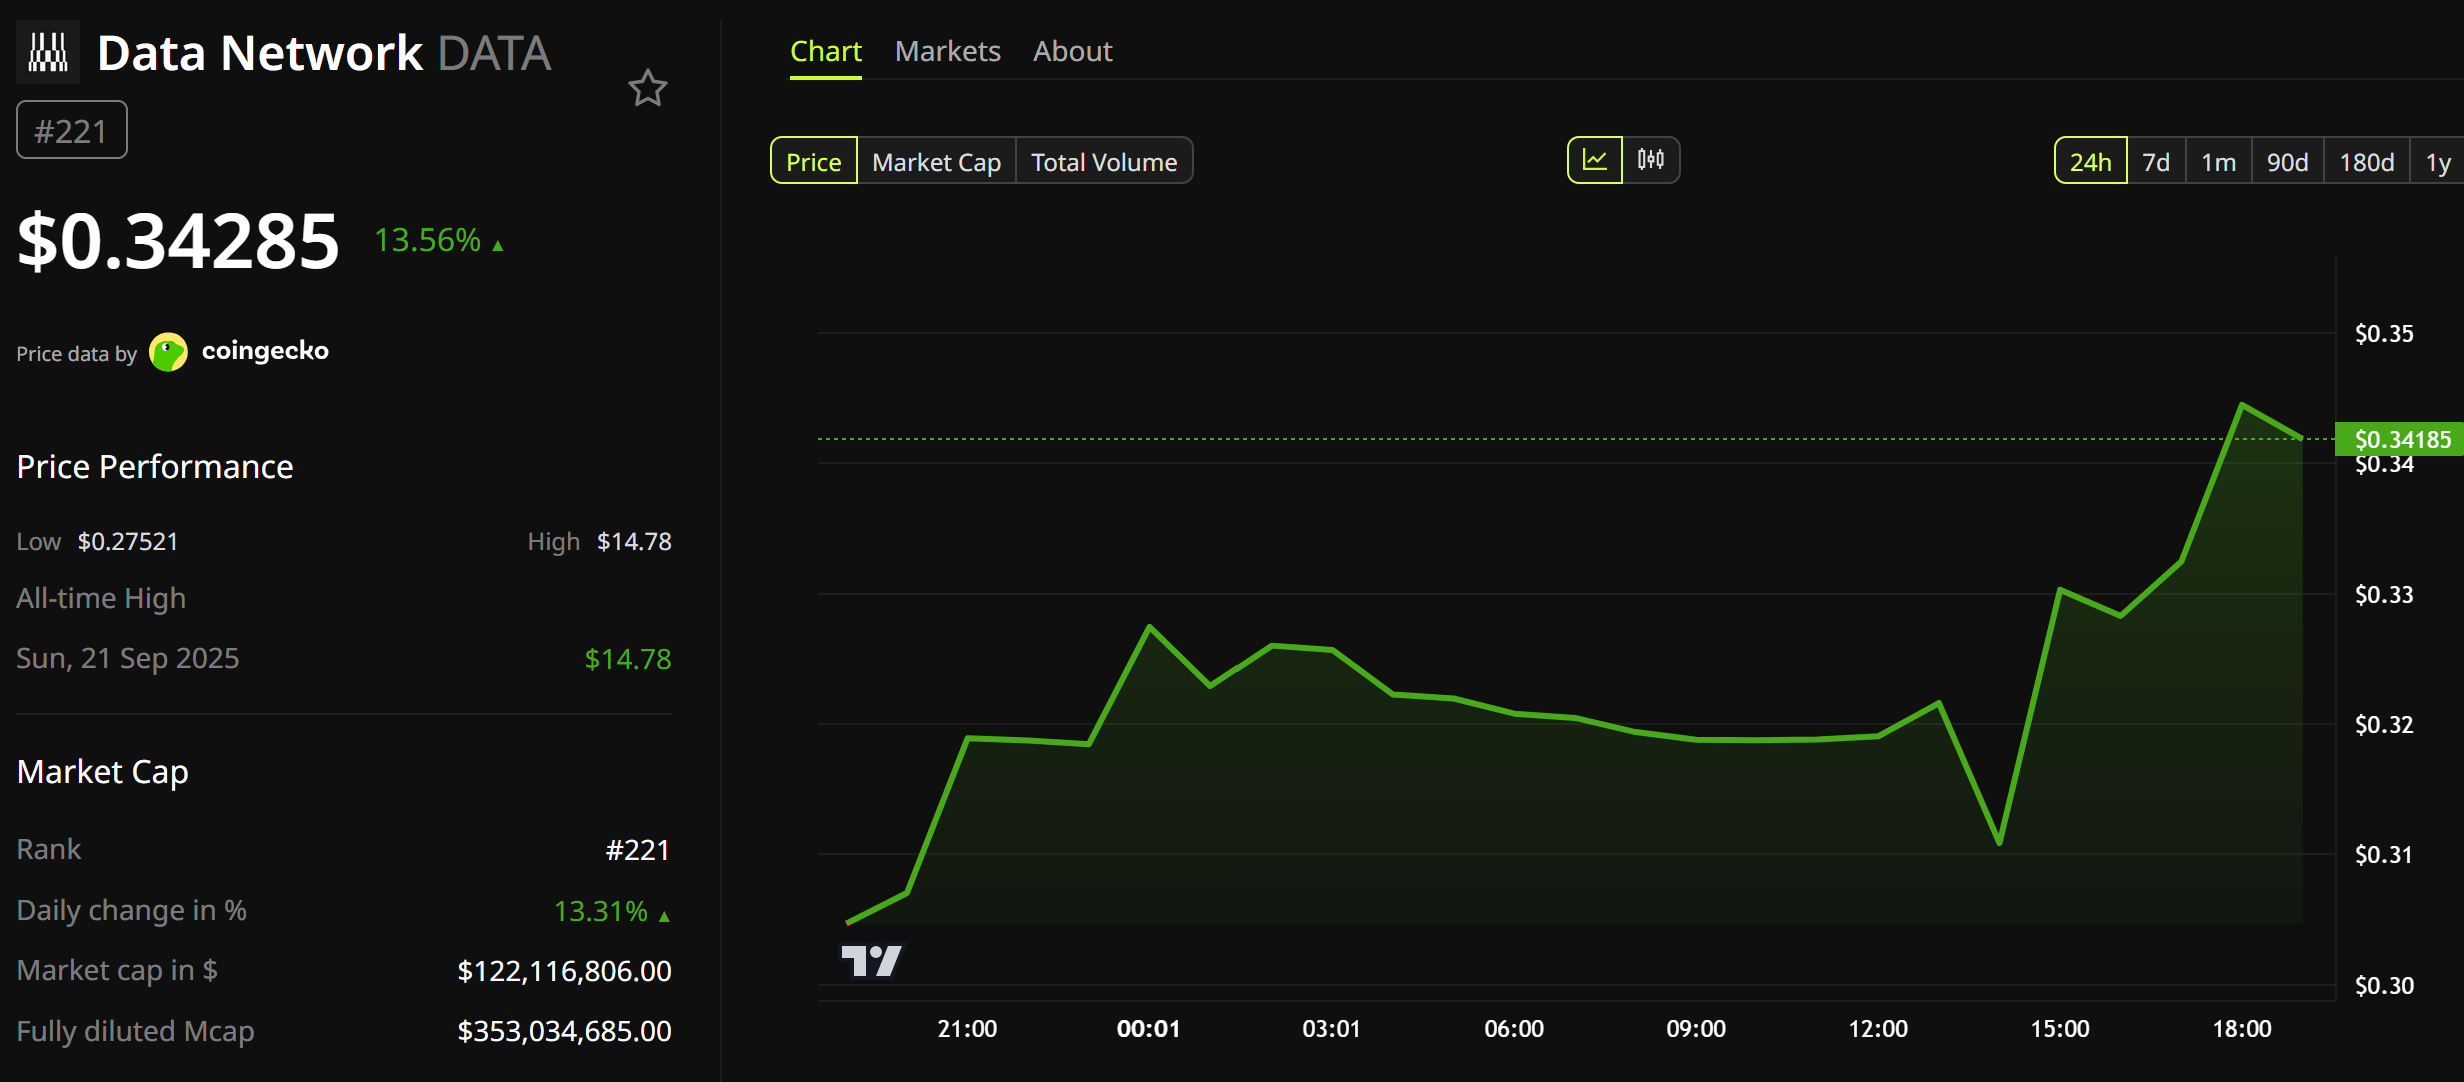
Story Protocol has rebranded as the DATA Foundation, shifting its blockchain toward verified data for training artificial intelligence (AI). The project’s token, which trades as IP rose almost 15 on the news.
The change renames Story Network as DATA Network and converts IP into a new token, DATA, through a one-to-one migration. The foundation said demand for AI training data outpaced its earlier bets on entertainment and gaming.

Why Story Protocol Shifted to Data
The foundation announced the change after concluding that companies behind valuable music, games, and brands guarded their rights and resisted open licensing.
That resistance clashed with Story’s original goal of making all intellectual property programmable. The project had already tokenized music rights from major artists, but most owners stayed cautious.
By contrast, an incubated data project called Poseidon signaled stronger demand. It raised a $15 million seed led by a16z. The same firm backed Story’s roughly $134 million across three funding rounds.
“Labs have effectively run out of internet to scrape,” Andrea Muttoni, the DATA Foundation’s CEO, explained.
Follow us on X to get the latest news as it happens
Muttoni, previously the company’s president, had explored how AI reshapes IP before the rebrand. IP launched in February 2025 and peaked at $14.78 that September, but now trades about 98% lower.
What the Shift Means for Holders
Story Network becomes DATA Network, and the migration requires no immediate action from holders. The foundation said integrations and validators continue without interruption.
The reshuffle follows other recent leadership changes at the project.
The rebrand also brings a partnership with Kled, billed as the largest opt-in human data marketplace. The foundation said Kled adds more than 1.5 billion images, videos, and files to the network. Its founder Avi Patel joins as chief data officer.
Two tools anchor the network, an audit platform called Trace and the Poseidon processing layer. Together they aim to prove where data came from and confirm its quality for buyers.
Meanwhile, Story’s IP token traded near $0.34, a market value of about $121 million on $95 million in daily volume.
Confidential Data Rails are due on mainnet in the third quarter. Whether major AI labs adopt the network will determine if the data pivot can outlast the decline that preceded it.
The post IP Rallies 15% as Story Protocol Abandons Broad Vision for AI Data appeared first on BeInCrypto.


Aave founder Stani Kulechov has rejected reports suggesting Aave would sell AAVE tokens to Kraken at a roughly 70% discount, while confirming that discussions around long-term strategic partnerships have taken place.
Summary
- Stani Kulechov rejected claims that Aave would sell AAVE tokens to Kraken at a roughly 70% discount.
- Kulechov said all Aave Protocol revenue flows to the Aave DAO and revealed plans for an automated AAVE buyback mechanism.
- Grayscale maintained AAVE appears undervalued, with a model-based fair value of up to $175 if tokenized assets expand in DeFi.
Earlier, a report claimed that Kraken is in advanced talks to invest 35,000 ETH in exchange for 250,000 AAVE tokens and a 15% equity stake in Aave Group. The reported transaction was valued at approximately $71 million and implied an Aave Group valuation of about $385 million.
Responding to the report, Kulechov argued that its framing did not accurately describe the discussions. He said there was “no way” Aave would sell AAVE tokens at a 70% discount. While disputing that characterization, he did not deny that negotiations with strategic partners have occurred.
Instead, Kulechov explained that Aave Labs holds an allocation of AAVE tokens that several market participants have expressed interest in purchasing as part of deeper, long-term partnerships. His comments drew a distinction between Aave Labs, which develops the protocol, and the Aave DAO, which governs the ecosystem and controls protocol economics.
Protocol revenue continues flowing to the DAO
Expanding on that structure, Kulechov said every dollar of revenue generated by the Aave Protocol and the GHO stablecoin accrues to AAVE through the Aave DAO. He added that the same arrangement now covers revenue from Aave App, Aave Pro, and swap-related products following the approval of the Aave Will Win governance proposal.
Under that framework, Aave Labs does not keep protocol or product revenue. Instead, the development company receives funding approved by the DAO to continue building the protocol.
Kulechov said Aave is currently generating approximately $134 million in annualized revenue, with those proceeds flowing to the DAO rather than the development company. He also stated that the Aave brand, protocol software, and other intellectual property created for the ecosystem now belong to AAVE under the updated governance model.
Separately, Kulechov revealed that the team is designing Aavenomics 3.0, which he said will introduce an automated, non-discretionary AAVE buyback mechanism. He did not disclose the launch timeline, funding source, or expected size of the program.
Aave already operates a buyback system funded by excess protocol revenue. Based on Kulechov’s comments, the proposed mechanism would automate purchases rather than relying on governance decisions for each buyback.
Tokenized assets remain central to Aave’s valuation case
Looking beyond governance, Kulechov said Aave is expanding its focus beyond crypto lending to include tokenized real-world assets and other financial products.
That strategy aligns with a recent assessment from crypto.news, which reported last week that Grayscale Research considers AAVE undervalued at current prices using a cash-flow model commonly applied to traditional financial companies.
Grayscale estimated Aave could generate roughly $60 million in revenue during 2026 and placed the token’s current fair value between $80 and $100 based on a 20x to 25x fintech earnings multiple.
According to Grayscale Research, a fair value of about $175 could become possible within a year if regulatory clarity accelerates the use of tokenized assets such as Treasury products, private credit, and money market funds as collateral in DeFi lending.
The research noted that the estimate is model-based rather than a guaranteed price target and depends on tokenized assets bringing additional deposits, borrowing activity, and fee generation to the protocol.
Following Kulechov’s comments, AAVE climbed to an intraday high of $87.50 before easing to around $82, while the token continued to receive support from Standard Chartered’s previously published $3,500 price target for the end of 2030.


21Shares has cut several of its 2026 crypto forecasts, saying institutional adoption has continued to grow even as weaker prices and slower enterprise adoption have delayed parts of the industry’s recovery.
Summary
- 21Shares cut several 2026 crypto forecasts despite continued growth in institutional adoption and market infrastructure.
- The firm expects prediction markets to exceed $100 billion in annual trading volume while industry consolidation accelerates.
- 21Shares said ETF holdings remain near record highs, suggesting institutions continue accumulating despite market weakness.
According to 21Shares’ midyear outlook, the digital asset industry has continued to build stronger infrastructure despite a difficult market environment.
The asset manager said progress in areas including exchange-traded funds, stablecoin regulation, tokenization, and prediction markets has exceeded what recent price action suggests. Even so, weaker crypto prices, major decentralized finance exploits, and slower enterprise adoption have prompted the firm to reduce several expectations it had set earlier this year.
The report argues that institutional participation has increased without changing Bitcoin’s long-established market structure. According to 21Shares, Bitcoin reached roughly $126,000 in October 2025 before entering a decline that has largely followed historical post-halving patterns. While larger institutional ownership has reduced the severity of drawdowns, the firm said the four-year market cycle remains intact.
Former 21Shares co-founder Ophelia Snyder, who left the company after its acquisition by FalconX in 2025, recently expressed a similar view in a Substack post.
Snyder wrote that crypto’s investor base has become more institutional and increasingly tied to the wider financial system, making prices more responsive to macroeconomic developments, geopolitical events, and competing investment narratives.
Prediction markets and consolidation stand out
Among the strongest-performing segments, 21Shares identified prediction markets as one of the industry’s fastest-growing sectors. The firm expects annual trading volume in prediction markets to exceed $100 billion this year.
The report also identified consolidation as an accelerating trend across crypto markets. According to 21Shares, several publicly listed companies that hold digital assets on their balance sheets are trading below the value of their crypto holdings, increasing the likelihood of mergers or acquisitions among smaller treasury firms.
A comparable pattern is developing within Ethereum’s layer-2 ecosystem. The report said a small number of leading rollups continue to capture users and liquidity, while many smaller networks have struggled to build meaningful activity.
Institutional investors continue accumulating through volatility
Crypto investment products have also continued attracting institutional capital despite recent market weakness, according to the report.
Although U.S. spot Bitcoin exchange-traded funds have recorded about $3 billion in net outflows this year, 21Shares said ETF holdings remain above 1.25 million BTC, close to a record high. The firm argued that these figures indicate many investors have maintained or quietly increased positions instead of exiting the market during the downturn.
Recent market volatility has nevertheless weighed on sentiment. As crypto.news reported earlier, a stronger-than-expected U.S. PCE inflation reading renewed concerns that the Federal Reserve could keep monetary policy tighter for longer, triggering nearly $1.5 billion in crypto liquidations and pushing Bitcoin, major altcoins, and crypto-related equities lower.
Earlier this week, Bank of America also revised its outlook to forecast three 25-basis-point Federal Reserve rate hikes this year, citing persistent inflation risks.
Despite the latest selloff, some institutions have maintained their longer-term outlook. As crypto.news reported earlier in June, Standard Chartered’s Geoffrey Kendrick reiterated the bank’s $100,000 Bitcoin and $4,000 Ethereum targets after an earlier market decline.
Kendrick argued at the time that Bitcoin’s drop toward $59,000 likely represented the cycle low, while stronger ETF flows and institutional demand remained key conditions supporting the bank’s longer-term price targets.
Looking ahead, 21Shares said improving regulatory clarity in the U.S. continues to support product launches. The firm pointed to the Securities and Exchange Commission’s generic listing standards, which have accelerated approvals beyond Bitcoin and Ether products.
Hyperliquid was highlighted as one example, with the report noting that U.S. spot ETFs tracking the asset gathered more than $150 million in net inflows within their first month, signalling continued institutional interest in digital assets.
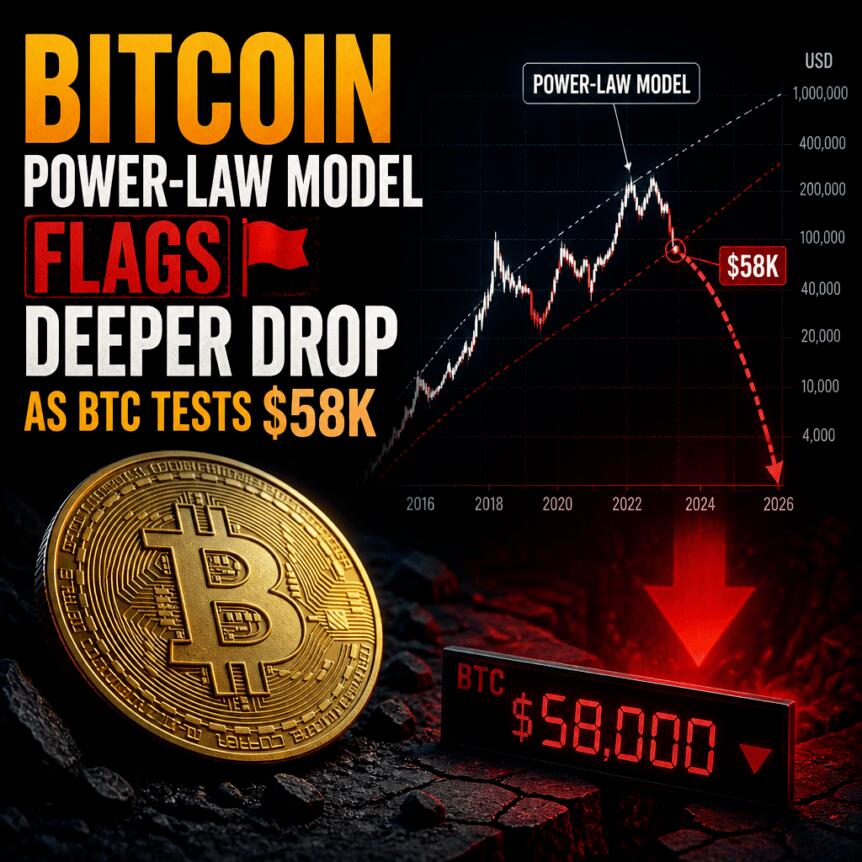
Bitcoin has slipped to around $58,000, a level that long-term power-law analyses have historically associated with major cycle lows. While the data stops short of confirming a precise “bottom,” several widely referenced support and quantile signals suggest BTC is trading in a statistically familiar drawdown zone rather than clearly breaking from its long-run behavior.
Derivatives pricing and liquidation maps add another layer to the picture. Traders are watching $55,000 for the next support magnet, while the $65,000–$68,000 area is emerging as a major upside liquidity pocket if downside momentum fades.
Key takeaways
- Power-law modeling cited by analyst Giovanni places BTC’s long-term trend near ~$135,000, putting $58,000 about 54% below the trend and within a historically “cycle-low-like” deviation band.
- The same framework points to a near-$68,000 “-1σ” support estimate, with a stronger long-run floor closer to ~$55,000.
- On the derivatives side, liquidation clustering shows roughly $4B of shorts near $65,000 versus about $1B below $55,000, implying a potential relief rally could run into $65,000–$68,000.
- Technical read-throughs hinge on whether BTC can reclaim $60,000 on a daily basis; a daily close above it would help preserve bullish RSI divergence across multiple time frames.
- Realized price levels near $54,000–$55,000 are highlighted as another historically reliable bear-market support zone going back to prior cycle bottoms.
Why $58,000 is getting attention from power-law models
The market’s latest move is being interpreted through a long-running statistical lens: power-law models designed to map Bitcoin’s historical trend and the distribution of deviations over multiple cycles.
According to Giovanni’s Bitcoin power-law model, the network’s long-term trend price sits near $135,000. With BTC at roughly $58,000, the drawdown is about 54% from the all-time high reference point used in the model’s framework and roughly 1.22 standard deviations below the estimated trend.
The key point for cycle context is that Giovanni’s model suggests past bear-market lows—in 2012, 2015, 2019, 2020, and 2022—arrived within a similar statistical range. In that view, the current decline fits a pattern consistent with prior deep lows rather than an abrupt break from Bitcoin’s longer-term growth path.
Support bands: $68,000 as a checkpoint, $55,000 as the bigger line
Giovanni’s estimates place a commonly referenced “-1σ” support zone near $68,000. However, the analyst also emphasizes that a more meaningful historical floor appears closer to $55,000. Importantly, Giovanni also noted that the power-law model would only be considered invalid if BTC traded below approximately $17,000 for more than a year—an assumption that, in the present context, remains far from being tested.
A second statistical metric referenced alongside the model also points toward “rarely seen” valuation. Bitcoin’s power-law quantile is cited at 6.2%, which implies the asset is cheaper than roughly 94% of its historical observations measured against the power-law trend. The article ties that pattern to earlier cycle lows, including 2015, 2020, and 2023, suggesting BTC has returned to a historically uncommon valuation band.
Investors should treat these signals as scenario probabilities rather than guarantees. Power-law work can indicate where markets often bottom, but it does not automatically confirm that a cycle bottom has already been printed—especially when short-term liquidity conditions and technical structure are still evolving.
Liquidations, $60,000 reclaim, and where the next liquidity sits
While the long-term math draws a wide “cycle-low” envelope, the near-term tape is being shaped by derivatives positioning. BTC reportedly printed a new yearly low near $58,000 after aggressive selling swept through Binance, according to taker sell volume metrics cited from CryptoQuant.
The flush included an hourly taker sell volume of about $2.1 billion, followed by another $1.9 billion in the next hour after the New York market open—described as Binance’s largest hourly sell pressure since May 4. Following that liquidation event, the move is said to have cleared more than $300 million in long BTC positions before price rebounded toward $60,000.
That $60,000 level is now central to the short-term technical narrative. A daily close back above $60,000 is described as preserving developing bullish RSI divergence across one-hour, four-hour, and daily time frames—an indication that selling momentum may be weakening even as price continues to mark lower lows.
Futures trader Byzantine General offered a related interpretation on social media: the drop to $58,000 allegedly cleared out leveraged longs while attracting fresh short selling. In his view, a daily close above $60,000 would strengthen the argument that a local bottom has been set for now.
Betting the range: upside liquidity near $65,000–$68,000 vs. the $55,000 floor
Derivatives positioning also highlights an asymmetry in where forced buying could emerge in a rebound. The liquidation map described the concentration of short liquidations near $65,000 at more than $4 billion, compared with roughly $1 billion below $55,000—creating a reported four-to-one imbalance. In practice, that means a relief rally might find additional fuel as shorts are forced to cover into rising prices.
Traders are also watching internal liquidity near $68,000, which the article links to a “daily fair-value gap” area of interest. The implication is that if BTC can recover from the current zone, upside pathways may be supported not only by technical recovery but also by derivative settlement dynamics.
On the other hand, a daily close below $60,000 would reinforce a bearish read across both short-term and longer-horizon charts. In that case, attention would likely shift back toward the $55,000 area—where multiple value frameworks converge.
The article adds another support argument by pointing to Bitcoin’s realized price. Realized price, which tracks the average cost basis of onchain coins, is described as having historically provided support at major Bitcoin bear-market bottoms since 2014. That historical relationship is used to frame the $54,000–$55,000 region as a key level to monitor if selling pressure continues.
For now, the market’s next decision point looks tied to whether BTC can hold and reclaim $60,000 on a daily basis; that would keep the door open for a move into the $65,000–$68,000 liquidity pocket. If it fails, the focus likely returns to the $55,000 and $54,000–$55,000 realized-price convergence, where historical cycle behavior suggests the most important support test may be underway.

Strategy’s options market has remained below historical crisis levels even as defensive Bitcoin positioning has climbed into the top fifth of historical readings, according to new research from Anchorage Digital.
Summary
- Anchorage Digital says Strategy’s options market is not signaling a severe crisis despite elevated downside hedging.
- Bitcoin and IBIT options show strong demand for protection, with put skew near historical highs.
- Legal scrutiny, insider share sales, and stock weakness have increased pressure on Strategy, but options traders are not pricing forced deleveraging.
According to a June 25 report by Anchorage Digital head of research David Lawant, traders across Bitcoin options, BlackRock’s iShares Bitcoin Trust (IBIT), and Strategy (MSTR) continue to pay a premium for downside protection, yet Strategy’s options market is not signaling fears of a severe company-specific breakdown.
The research examined options activity on Deribit alongside IBIT and MSTR, arguing that the combination offers a more complete picture of sentiment across crypto-native participants, institutions, and retail investors than any single market on its own.
The Put skew remained elevated in both Deribit and IBIT options, indicating that investors have preferred hedging against losses instead of chasing additional upside. According to the report, defensive positioning ranked in the 82nd percentile of IBIT’s history and the 84th percentile of Deribit’s five-year record.
Lawant also found that Bitcoin options have spent nearly half of 2026 pricing one-week implied volatility above one-month implied volatility. The report attributed the unusual pattern to repeated macroeconomic events, geopolitical developments, and crypto-specific catalysts that have kept traders focused on immediate uncertainty.
Lawant wrote that a return to one-month implied volatility trading above one-week levels would suggest investors are becoming more comfortable looking beyond current risks.
Strategy options remain below historical stress levels
Although Strategy has come under growing pressure in recent weeks, Anchorage Digital said its options market has not reached the conditions that accompanied previous periods of severe market stress.
According to the report, traders continue to buy downside protection, but put skew has not climbed to levels that typically signal expectations of forced deleveraging or a broader crisis surrounding the company.
The assessment comes as Strategy’s capital structure has faced fresh strain. The company’s perpetual preferred stock, STRC, dropped to $82.53 on June 22, about 17% below its $100 par value, before recovering after Strategy disclosed that it had increased its fiat reserves to $1.3 billion. By Thursday, STRC was trading near $75, leaving it roughly 25% below par.
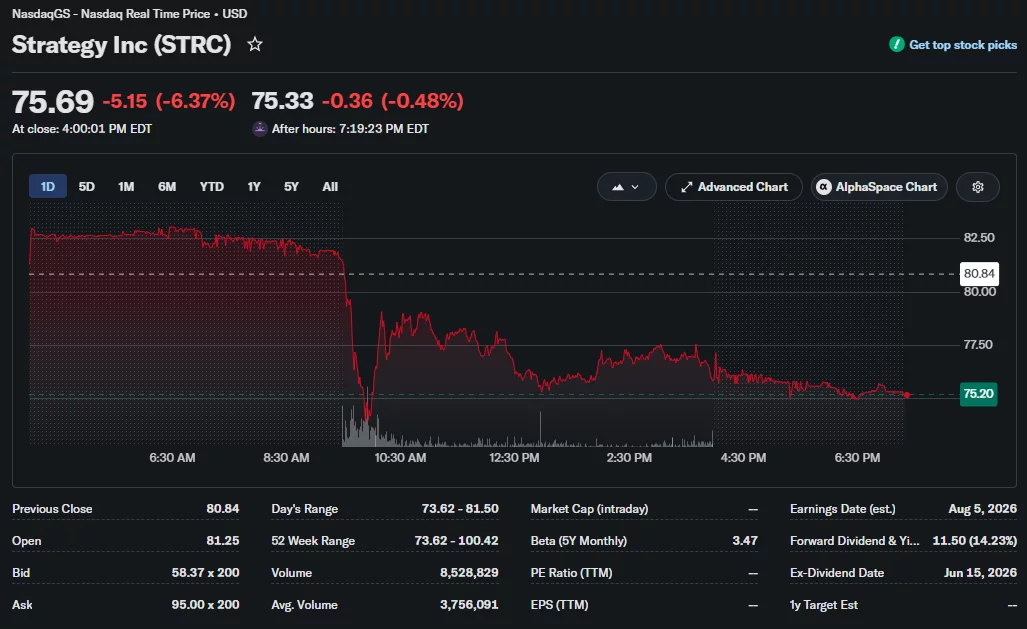
Pressure has also spread to the company’s common stock. Yahoo Finance data showed MSTR shares were trading around $85 on Thursday after falling about 78% over the past year and reaching a fresh 52-week low.
Legal scrutiny has intensified alongside stock weakness
Outside the options market, Strategy has encountered increasing legal and investor scrutiny.
Rosen Law Firm recently announced that it is investigating whether the company made materially inaccurate business disclosures. The firm said it is evaluating potential securities claims and considering a possible class action on behalf of shareholders who suffered losses.
The investigation followed public comments from Bitcoin critic Peter Schiff, who argued that investors in Strategy’s STRC preferred shares could have legal grounds to pursue claims if they purchased the security based on Michael Saylor’s promotion of the company’s Bitcoin treasury strategy. Schiff made those remarks before any law firm publicly disclosed an investigation into potential shareholder claims.
Adding to investor attention, Strategy director Jarrod Patten recently sold another 1,500 MSTR shares as the stock continued its decline.
Despite those developments, Anchorage Digital’s analysis indicates that options traders are preparing for additional volatility rather than pricing in a severe breakdown.
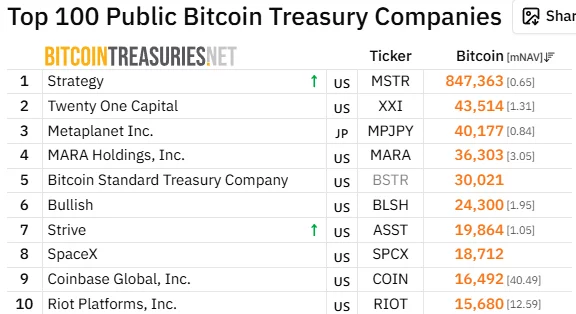
Strategy, led by Executive Chairman Michael Saylor, remains the world’s largest corporate holder of Bitcoin with 847,363 BTC on its balance sheet after pioneering the corporate Bitcoin treasury model in 2020.
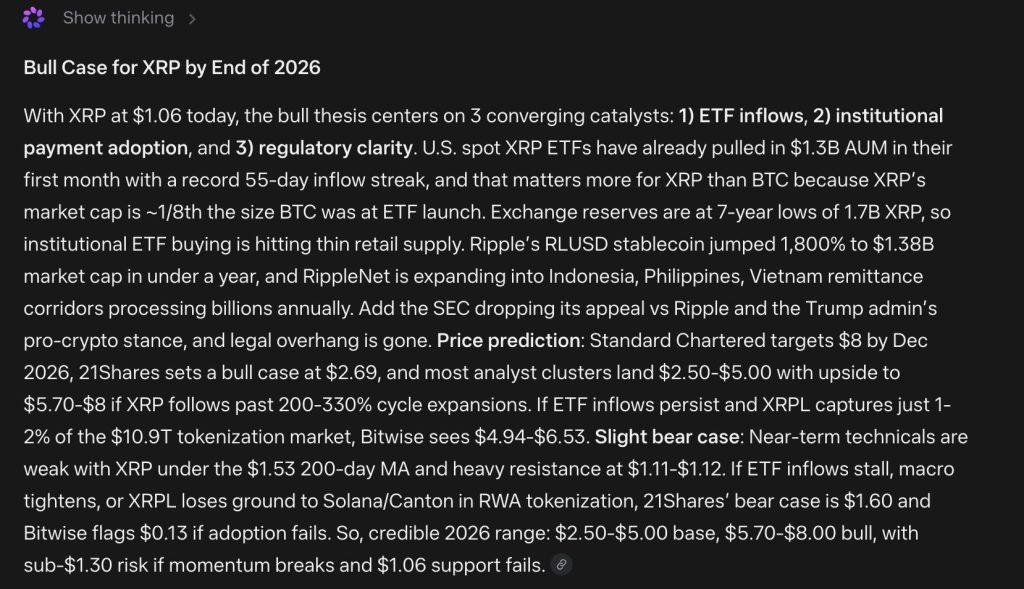
Mark Zuckerberg Meta AI just built a 2026 predicts for XRP price prediction that reads less like a single number and more like three different doors that could all open at once.
The model lands on a base range of $2.50 to $5.00, with a bull case stretching to $5.70 or even $8.00 if everything breaks the right way.
The bull case rests on three catalysts converging together rather than any single headline. XRP sits near $1.06 today, and the thesis starts with ETF inflows, since US spot XRP ETFs already pulled in 1.3 billion dollars in assets under management in their very first month, backed by a record 55-day inflow streak.
That matters more for XRP than it did for bitcoin, since XRP’s market cap is roughly one-eighth the size bitcoin was at when its own ETFs launched, meaning the same dollar inflow has a much bigger relative impact here.

Exchange reserves are also sitting at seven-year lows near 1.7 billion XRP, so institutional ETF buying is running into thin retail supply, which tends to amplify price moves. On the institutional payment side, Ripple’s RLUSD stablecoin jumped 1800% to a $ 1.38 billion market cap in under a year, while RippleNet continues to expand into remittance corridors across Indonesia, the Philippines, and Vietnam that process billions annually.
Add regulatory clarity to the mix: with the SEC dropping its appeal against Ripple and the Trump administration maintaining a pro-crypto stance, the legal overhang that weighed on XRP for years is essentially gone.
Wall Street price targets reflect that optimism too, with Standard Chartered calling for $8 by December 2026 and 21Shares setting a bull case at $2.69, while Bitwise sees $4.94 to $6.53 if XRPL captures just 1% to 2% of the 10.9 trillion dollar tokenization market.
The bear case is sharper than usual here. Near-term technicals are genuinely weak, with XRP trading under its $1.53 200 day moving average and running into heavy resistance at $1.11 to $1.12. If ETF inflows stall out, macro conditions tighten, or XRPL keeps losing ground to competitors like Solana or Canton in real-world asset tokenization, 21Shares puts its bear case at $1.60, while Bitwise flags a much grimmer $0.13 if adoption simply fails to materialize.
Momentum breaking down and the $1.06 support level failing would open the door to that kind of outcome.
XRP Price Prediction: Sits Below Its Own Ceiling Waiting For A Reason To Climb
The weekly chart shows XRP at $1.07009 after a long, steady decline from highs above $3.65 set back in mid 2025. That drop has been one of the more relentless downtrends in this entire series, with very few real bounces interrupting the slide.
The 200-day moving average mentioned in the prediction sits at $1.53, which is a long way above the current price and underscores just how far XRP has fallen below its own longer-term trend.
Resistance sits first at $1.11 to $1.12, the exact zone flagged as the immediate ceiling holding price down right now, then a heavier wall further up near $1.60 where multiple rejections have piled up historically.
Support is harder to define on pure price structure alone, but the current $1.06 level marked on this candle lines up directly with the support level called out as the line in the sand for the bear case. The chart shows a clean series of lower highs and lower lows for almost a full year, which is about as textbook a downtrend as it gets.
Momentum on the candles themselves looks weak, with red weeks dominating the recent stretch and very little follow through buying on the occasional green candle.
Overall, this chart looks like an asset still searching for a bottom rather than building toward a breakout. If XRP can reclaim that $1.11 to $1.12 resistance zone and eventually fight back above its 200 day average, the kind of catalyst driven move Meta AI is describing finally has a technical foundation to build on instead of just a fundamental story sitting on top of a weak chart.
LiquidChain May Be The XRP of This Cycle, Here is Why Retail & Meta AI Predicts Loving It
When market leaders stall, smart money looks elsewhere.
BTC, ETH, and XRP are all grinding under resistance. The catalysts that unlock the next leg, macro relief and institutional inflows, have not arrived. Waiting on them means waiting on things you cannot control.
Early-stage infrastructure plays exist in a different universe entirely. The upside is not priced in yet, which means a relatively small amount of capital can move the needle significantly.
LiquidChain is solving exactly that problem. Bitcoin, Ethereum, and Solana liquidity currently sits in isolated silos, costing users money and time on every cross-chain move. LiquidChain collapses all 3 into a single execution layer. Developers deploy once. Users move across ecosystems without ever feeling the seams.
The presale sits at $0.01454 with just over $850,000 raised. Ground floor, not a late entry.
Adoption, liquidity depth, and execution are all unproven. That risk is real. The question is whether the potential justifies it.
Established assets offer a smoother ride toward a ceiling that is already visible. LiquidChain offers an earlier seat at a table that has not been set yet.
Explore the LiquidChain Presale
The post Mark Zuckerberg Meta AI Predicts Eye-Opening XRP Price by End of 2026 appeared first on Cryptonews.


A CoinShares survey has found that 52% of UK financial advisers cannot see most of their clients’ cryptocurrency holdings because of firm-level restrictions.
Summary
- CoinShares found that 52% of UK financial advisers cannot see most of their clients’ crypto holdings.
- The survey says firm policies, not investor demand, are the main barrier to crypto oversight.
- Ripple executives and regulators point to growing crypto payment use and tighter oversight of digital assets.
According to a survey released by digital asset investment firm CoinShares on Thursday, more than half of UK financial advisers say most of their clients’ cryptocurrency holdings sit outside their view, even as digital assets become more common in investment portfolios.
The survey covered 261 wealth management professionals across Europe and found that 52% of advisers in the UK said the majority of their clients’ crypto exposure was effectively “invisible” to them.
Across the wider group of countries surveyed, including France, Germany, Italy, and Switzerland, the figure fell to 25%. CoinShares also found that 61% of respondents worked at firms that either restricted digital assets or had no clear internal policy on handling them.
Firm policies are limiting adviser visibility
Commenting on the findings, CoinShares co-founder and CEO Jean-Marie Mognetti argued that internal company rules, rather than investor demand or adviser knowledge, are preventing wealth managers from understanding their clients’ complete financial positions.
According to Mognetti, clients have already committed capital to digital assets, but advisers often cannot factor those holdings into portfolio management because firm policies stop them from discussing or overseeing them. He said this creates what he described as a “wrong-way risk,” where advisers are expected to manage wealth without access to a complete picture of client assets.
Mognetti also argued that advisers cannot properly allocate investments, manage risk, or build trust unless they first have visibility into those digital asset holdings.
“The capital has already been allocated. The people entrusted with managing it simply cannot see it, and in most cases not because clients are unwilling to engage, but because firm policy prevents them from doing so. This is not a knowledge problem. It is not a demand problem. It is a firm-policy problem becoming a wrong-way risk.”
The findings arrive as crypto ownership continues to grow in the UK. According to the UK’s Financial Conduct Authority, around 8% of adults in the country owned cryptocurrency as of its December report.
More recently, the regulator proposed allowing authorized investment funds to allocate up to 10% of their assets to cryptocurrency exchange-traded notes, signalling continued regulatory engagement with the sector.
Payment infrastructure is expanding alongside regulation
The survey comes as industry executives continue to argue that crypto’s next stage of adoption will be driven by payments rather than speculation.
As previously reported by crypto.news, Ripple executive Reece Merrick compared today’s crypto payments market with the early years of e-commerce, when online shopping represented only a small share of retail activity despite the underlying technology already being developed.
Merrick said improvements such as secure payment gateways, wider internet access, and smartphones eventually made e-commerce part of everyday life, and he believes scalable blockchains, stablecoins, regulated fiat on-ramps, and user-friendly wallets now play a similar role in crypto payments.
Separately, crypto.news previously reported that Ripple CEO Brad Garlinghouse said stablecoins are increasingly attracting interest from corporate finance teams and treasury departments evaluating blockchain-based payment systems and treasury management.
Regulators are also paying closer attention to how crypto transactions move through financial markets. In India, the Financial Intelligence Unit has asked at least three major cryptocurrency exchanges to provide records of over-the-counter crypto transactions exceeding $10,000, with the request covering data that exchanges must preserve from January 2026 onward.
The directive focuses on private OTC trades, which allow large transactions to avoid public order books but can make beneficial ownership harder to verify when intermediaries or closely held entities stand between exchanges and the original source of funds.


BitGo is reducing its workforce by nearly 15% as the digital asset custodian narrows its focus to security, trading, stablecoins, settlement, and AI-powered infrastructure. CEO Mike Belshe described the cuts as a one-time action with no further reductions planned.
The move makes BitGo the latest crypto company to trim staff in 2026, with peers tying similar cuts to AI. The custodian went public in January as the first major crypto listing of the year.
A Sharper Focus After Going Public
BitGo priced its public market debut at $18 a share in January, putting its strategy under fresh shareholder scrutiny. It counted about 565 full-time employees as of mid-2025 in its prospectus, so the cut points to roughly 85 jobs.
The numbers show why. BitGo’s 2025 results listed $16.2 billion in revenue, up more than fourfold, yet most came from low-margin digital asset sales. Adjusted EBITDA reached just $32.4 million, and a drop in its Bitcoin (BTC) treasury left a $14.8 million net loss.
Belshe wants the leaner team on higher-value institutional crypto services. BitGo won a federal trust bank charter from the OCC in December.
In April, it launched a minting tool aimed at the fast-growing stablecoin sector, a higher-margin line it wants to grow.
“To keep winning for our clients, we need to be sharper, more focused, and concentrate our people and energy on the areas that matter most…” Mike Belshe, BitGo CEO, explained.
Follow us on X to get the latest news as it happens
Layoffs Spread Across the Crypto Sector
The cut tracks a broader retrenchment. In May, Coinbase shed about 700 staff, or 14% of its workforce, in a restructuring aimed at optimizing operations for the AI era, according to a securities filing. BitGo is betting its own savings will fund more AI-powered financial infrastructure.
Not everyone credits strategy. Thomas Braziel, founder of distressed-crypto firm 117 Partners, tied the move to the cost of BitGo’s Bitcoin custody.
“I mean – BitGo is the highest cost operator for BTC storage on the planet so I get it,” Braziel said in a post.
Whether a leaner BitGo can turn its scale into real profit should become clearer in its next earnings report.
The post BitGo Cuts 15% of Workforce to Focus on Stablecoins and AI appeared first on BeInCrypto.
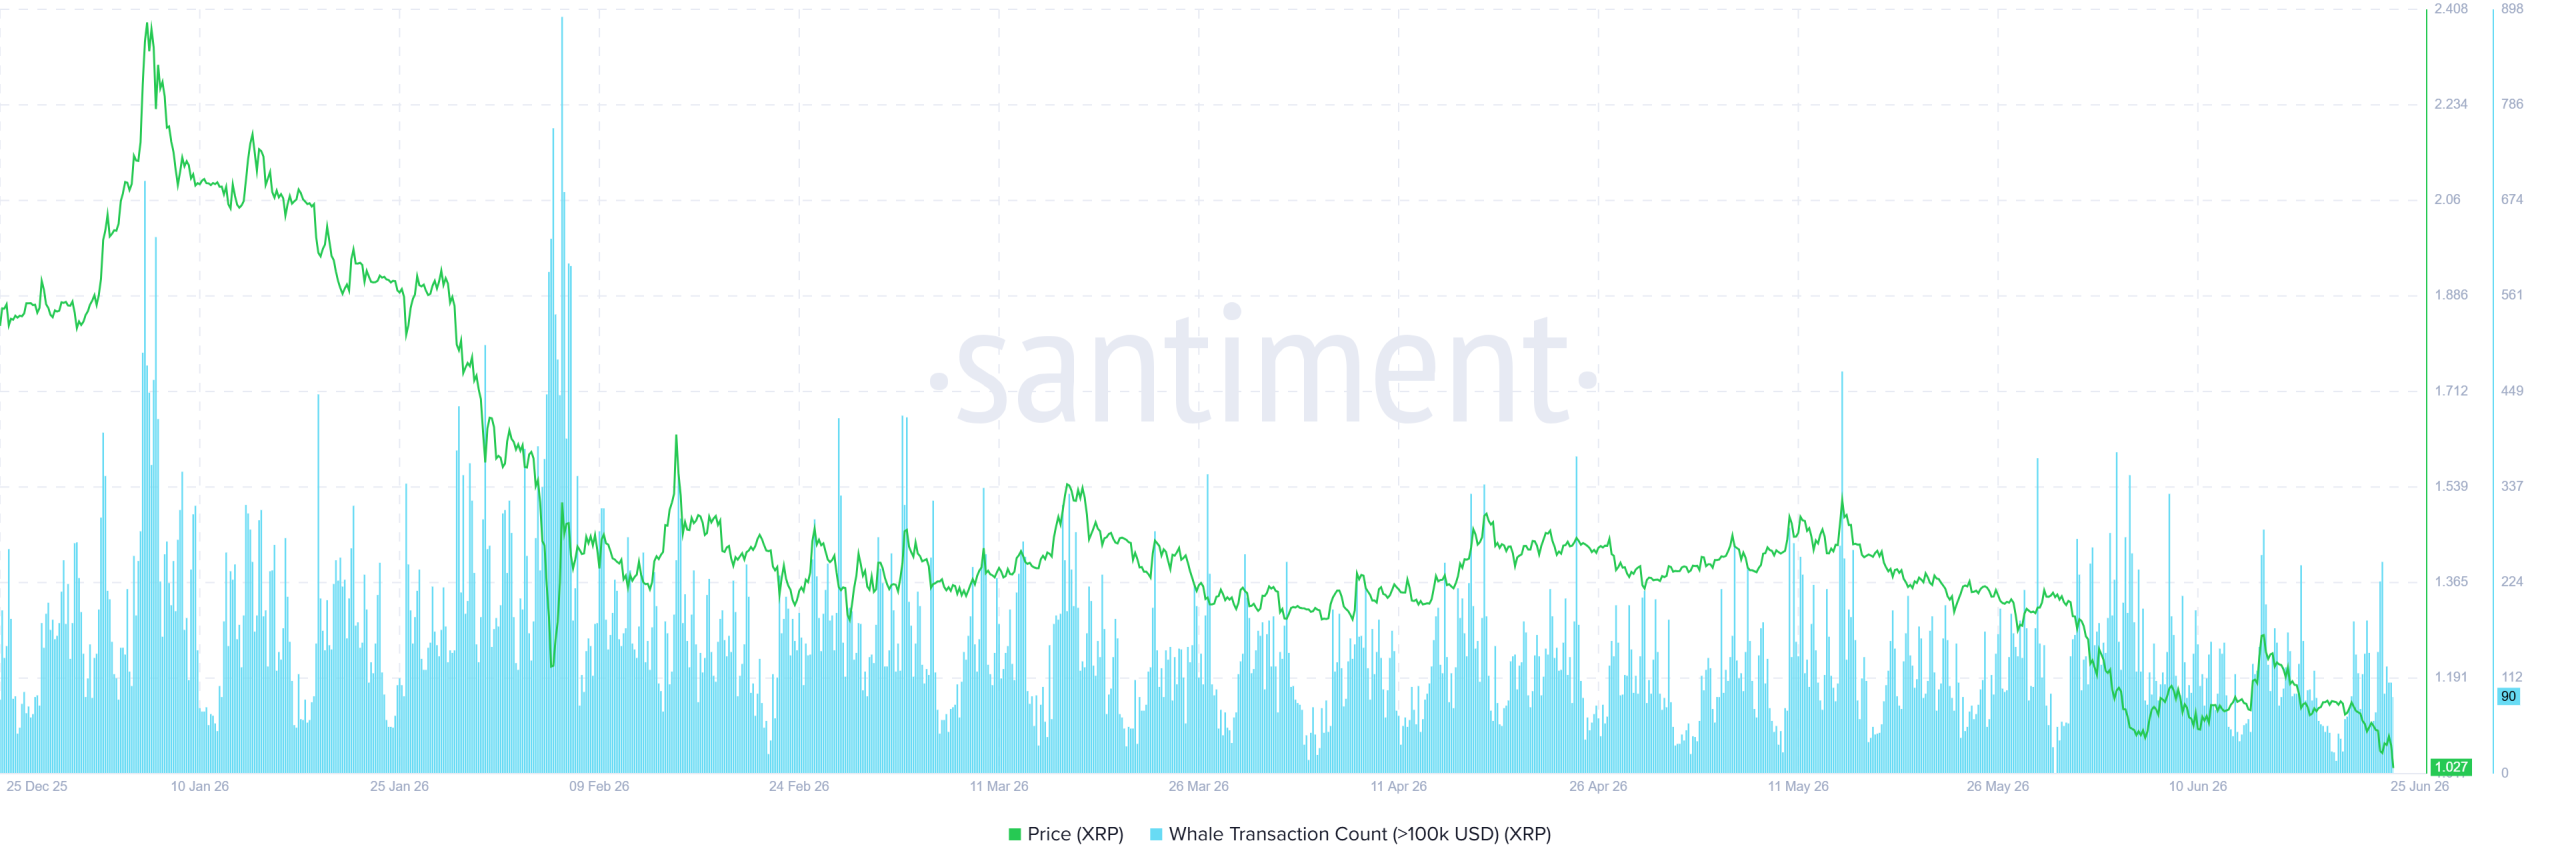
XRP is sliding toward its last major support near $1.04 as its weekly Relative Strength Index sinks into oversold territory unseen since 2022.
The XRP price trades around $1.04, down roughly 3.7% over the past 24 hours and more than 11% on the week. Both technical and on-chain readings now point in the same direction.
On-Chain Activity Offers No Rescue
Whale transaction counts above $100,000 have thinned toward the low end of their range. Santiment data shows the metric near 90, far below the early-February peak around 898.
Fewer large transfers point to weak conviction among major holders. Recent on-chain reports also show top whales trimming positions rather than buying the dip.

Social dominance tells a similar story. The metric sits near 0.259%, well below its spring spikes in late March and mid-May.
Those attention spikes failed to halt the decline. Chatter flared as the price fell, then faded, signaling little fresh demand from retail holders.

Both metrics fall together as the price drops. That combination often accompanies distribution, not accumulation, and removes a key prop for any recovery.
On-chain reports for early June describe the same shift. The largest whale cohort trimmed its share of supply through late May rather than adding to positions.
XRP Price and Weekly RSI Both Break Down
On the weekly chart, the XRP price trades below a descending resistance line drawn from the $3.66 top. Sellers have rejected the price at that line four times.
XRP has now fallen more than 50% from that July 2025 record high. The trend has produced a steady stair-step lower since then.
The structure shows consistently lower highs and lower lows. Price also broke down from a symmetrical triangle, projecting a measured target near $0.73.
XRP is now losing its last major support near the 0.786 Fibonacci level around $1.17. Weekly volume continues to decline, suggesting buyers lack conviction.
Below $1.17, the chart shows little structural support before the $0.73 target. A weekly close under the level would confirm the breakdown.

The weekly RSI confirms the weakness. It had ridden an ascending support line since 2022, holding in July 2024 and again in late 2025.
That line broke early in 2026. RSI retested it from below in May, met resistance, and then slid toward oversold readings near 28.
Levels below 30 last appeared in 2022. The reading suggests momentum favors sellers for now.

XRP Outlook Stays Bearish Without a $1.17 Reclaim
The combined picture keeps the near-term bias bearish. The setup may keep XRP under pressure for at least a couple of months.
Deep oversold readings can sometimes precede short-term bounces. Yet the broken trendline and fading demand keep the larger trend pointed lower.
A weekly close back above $1.17, paired with RSI reclaiming its broken trendline, would weaken the bearish case. Until then, the path of least resistance points toward $0.73.
For now, XRP sits on the edge of its last support, and the next weekly close could decide the trend.
The post XRP Quietly Loses Its Last Line of Support appeared first on BeInCrypto.
Bitcoin slid sharply over the past several sessions, briefly testing levels last seen in September 2024 and triggering a wave of leveraged liquidations. While broader risk assets steadied after a key US inflation print, crypto-specific flows and derivatives positioning pointed to waning demand and a market that may be primed for further volatility.
At the same time, institutional indicators are sending mixed signals: spot Bitcoin ETFs saw meaningful net outflows, and an upcoming options expiry appears structurally bearish. With traders increasingly reassessing risk-reward against interest-bearing alternatives, the near-term question for Bitcoin is no longer just whether the macro backdrop improves, but whether crypto can generate its own catalyst.
Key takeaways
- Bitcoin fell about 9% in three days, reaching its lowest level since September 2024 and sparking over $1 billion in liquidations on leveraged long positions.
- Spot Bitcoin ETF activity deteriorated, with $469 million in net outflows reported for Wednesday—an oft-cited proxy for institutional demand.
- Friday’s Bitcoin options expiry is heavily skewed toward puts, with Deribit put open interest expected to exceed calls by $3.4 billion.
- Rising confidence in a cooling inflation trend helped stocks and pressured demand for non-yielding assets like Bitcoin, while 5-year US Treasuries yielded about 4.15%.
Bitcoin’s sharp drop and the forced unwinds
Bitcoin traded down roughly 9% across three days, hitting a low not seen since September 2024. The subsequent retest of the $58,000 area proved painful for bulls: more than $1 billion in liquidations were recorded across bullish BTC leveraged positions. Although BTC recovered modestly to around $59,500, the move left traders cautious rather than confident.
Part of the timing lined up with the release of the US Personal Consumption Expenditures (PCE) index. The data showed May inflation rising 4.1% year over year. Even so, the market response suggested investors believed inflation pressures had begun to cool—especially as crude Brent retreated from roughly $95 earlier to around $75 more recently.
That easing in energy prices appears to have helped equities. The article notes that the S&P 500 and gold had erased their intraday losses, indicating that traders were willing to rotate back into risk assets after digesting macro updates.
Why crypto’s correlation story is breaking
Even when Bitcoin moves in tandem with broader markets, investors often look to whether the “risk-on” tailwind is actually benefiting crypto. Here, several crypto-specific signals suggest BTC is not simply lagging equities—it may be diverging.
The piece highlights a shift in how traders may be framing opportunity costs. It points to stronger performance in parts of the tech sector, referencing notable stock moves such as Micron’s 16% jump and a similar surge in Sandisk, alongside gains in chipmaking equipment. In that environment, Bitcoin can lose relative appeal if capital is finding stronger payoff in equities.
Beyond stock action, the article ties the broader risk appetite to shifting government emphasis on areas that support infrastructure and computing capacity. It also references a set of policy angles—such as a stake in Intel and proposals and frameworks related to quantum computing and “frontier models”—which are presented as supporting factors for the tech and data infrastructure narrative.
For Bitcoin traders, the key implication is straightforward: if equities are offering both momentum and an improving macro narrative, then BTC needs more than soft correlations to attract incremental risk capital.
Fixed income turns into a more competitive hedge
One of the article’s central arguments is that the balance of hedging tools may be changing. When rates are rising or expected to rise, investors often prefer assets that can generate yield—particularly in uncertain regimes where non-yielding assets like Bitcoin face more headwinds.
According to the coverage, traders may be pricing in an elevated probability of US rate increases into year-end. It cites the CME FedWatch Tool showing an 80% chance of US interest rate hikes by December, up from 68% a month earlier. In the same vein, it points out that 5-year US Treasuries were yielding about 4.15%, providing an alternative “parking place” for capital compared to Bitcoin.
That matters because the attractiveness of Bitcoin frequently hinges on whether investors believe they can finance exposure cheaply or whether cash is earning too much elsewhere. If Treasury yields remain competitive, the burden shifts to crypto-specific demand drivers—ETF flows, onboarding, or derivative positioning that reflects genuine upside conviction.
ETF outflows and options skew reinforce caution
Two of the most immediately actionable signals in the report come from flows and derivatives.
On the spot ETF side, the article says Bitcoin’s outlook took a hit from $469 million in net outflows on Wednesday. It frames this metric as a proxy for institutional demand—meaning persistent negative flows can signal that large allocators are not actively adding to exposure at current prices.
Derivatives are sending a similar cautionary message. The coverage points to Friday’s upcoming Bitcoin options expiry of about $13 billion, stating that the distribution of open interest favors put instruments. It reports that put open interest on Deribit is expected to exceed call open interest by $3.4 billion.
It also adds that most neutral-to-bullish options structures are likely to expire worthless, because 78% of call options are priced at $72,000 or higher. Taken together, the options market suggests the crowd is paying for downside protection—or positioning for reduced upside.
The article further notes deterioration in the Strategy (MSTR) position, referencing “huge unrealized loss” after buying $64.1 billion worth of Bitcoin since 2020. While equity-linked narratives can influence trader sentiment, the bigger takeaway is that corporate exposure does not automatically translate into stable support for spot demand, especially when ETF flows are negative.
What to watch next
With liquidations behind BTC for now but ETF outflows and a put-heavy options expiry still in focus, traders should look for evidence that spot demand returns—either through improved ETF flow trends or a shift in derivatives positioning as the expiry passes. Until then, Bitcoin’s ability to reclaim strength may depend less on macro tailwinds and more on whether crypto-specific demand reappears.
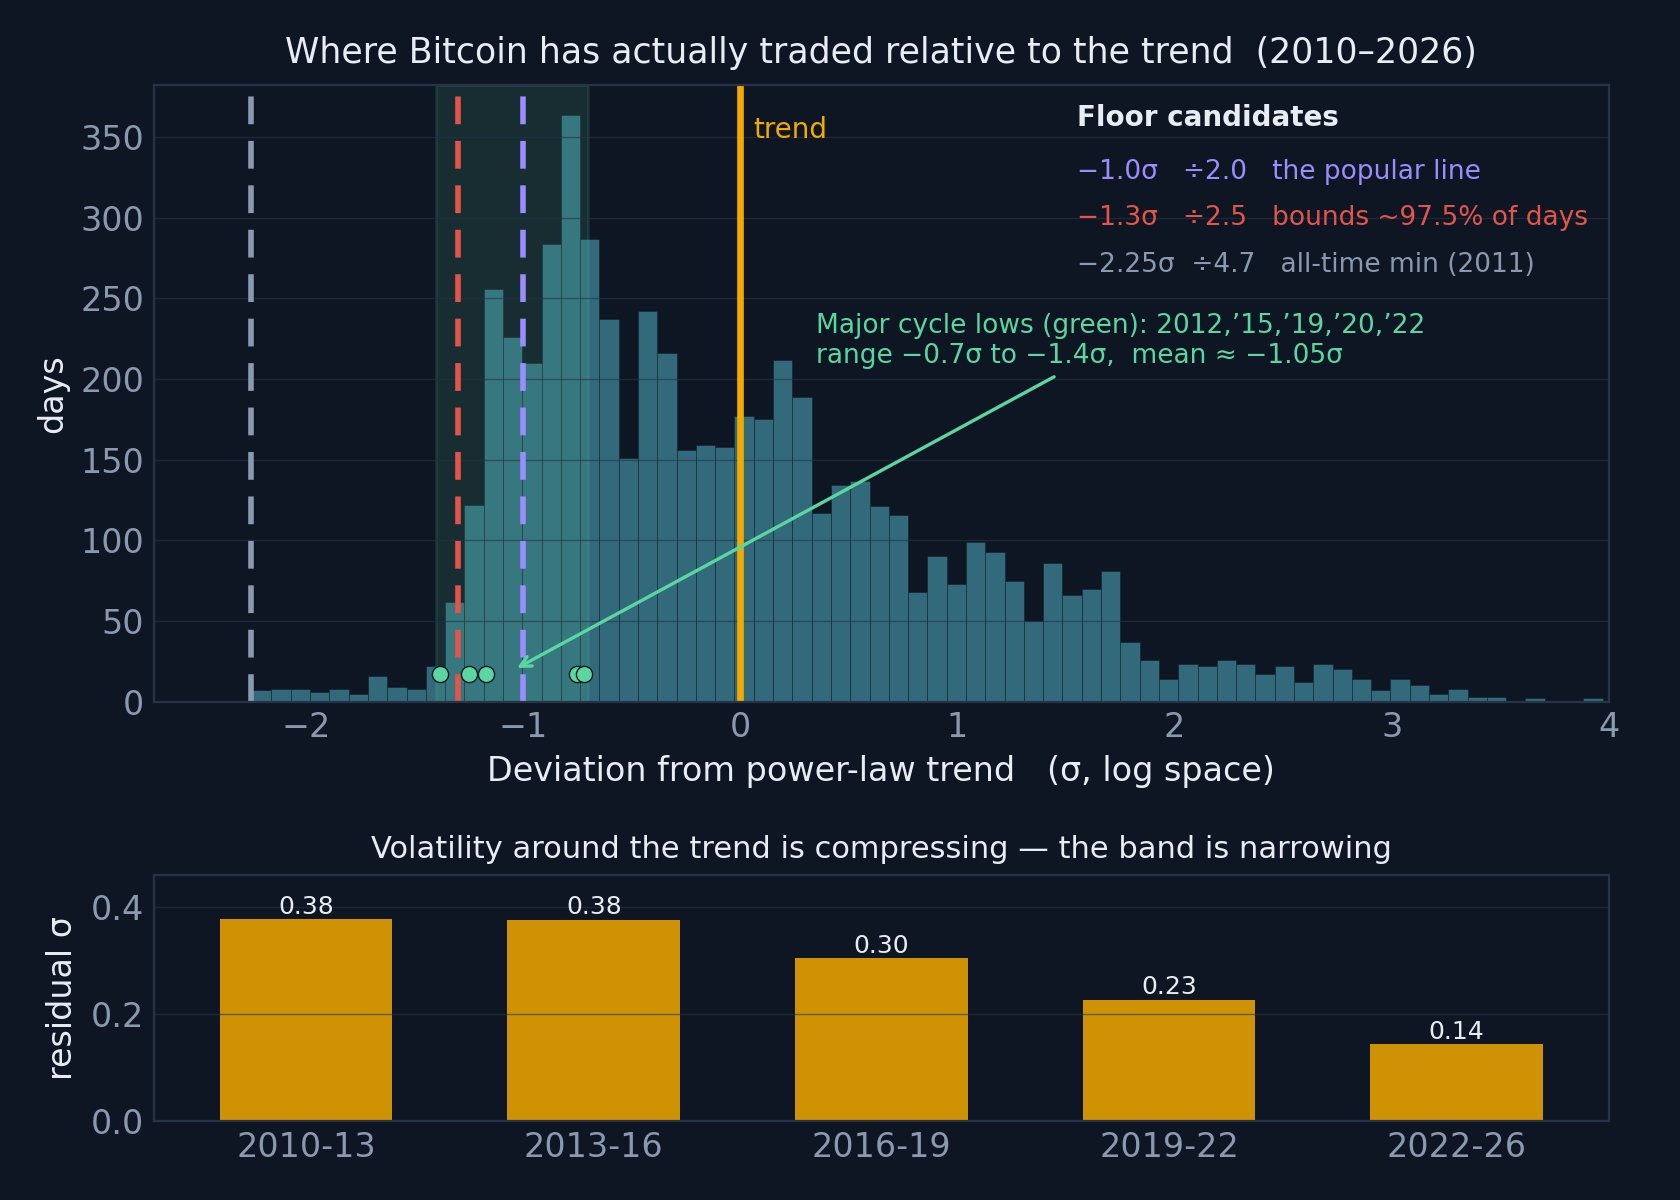
Bitcoin’s (BTC) drop to $58,000 has pushed the price into a zone that long-term power-law models have historically associated with cycle bottoms. The data does not confirm a bottom range, though it shows BTC trading in a price range that has repeatedly marked major lows since 2014.
Derivatives data and liquidation levels highlight $55,000 as the next key support level and the $65,000-$68,000 range as the next major upside area of interest.
Bitcoin power-law puts $58,000 in historical range
Giovanni’s Bitcoin power-law model places the network’s long-term trend price near $135,000, making the recent drop to $58,000 roughly 54% below the all-time high and 1.22 standard deviations beneath that trend.
According to the analyst, the key takeaway is straightforward: the previous cycle lows in 2012, 2015, 2019, 2020, and 2022 all fell within a similar statistical range. By that measure, the latest decline falls within a territory that has historically marked the deep bear-market lows rather than a break in Bitcoin’s long-term growth path.

Bitcoin price deviation based on the power-law trend. Source: X
The model estimates the commonly referenced “-1σ” support near $68,000, while the stronger historical floor sits closer to $55,000. Giovanni also noted that Bitcoin would need to trade below roughly $17,000 for more than a year before the power-law itself could be considered invalid.
A second metric points in the same direction. Bitcoin’s power-law quantile has fallen to 6.2%, indicating the asset is cheaper than roughly 94% of its historical observations when measured against the power-law model. The chart highlights similar readings during the 2015, 2020, and 2023 cycle lows, with the current market now revisiting that historically rare valuation zone.
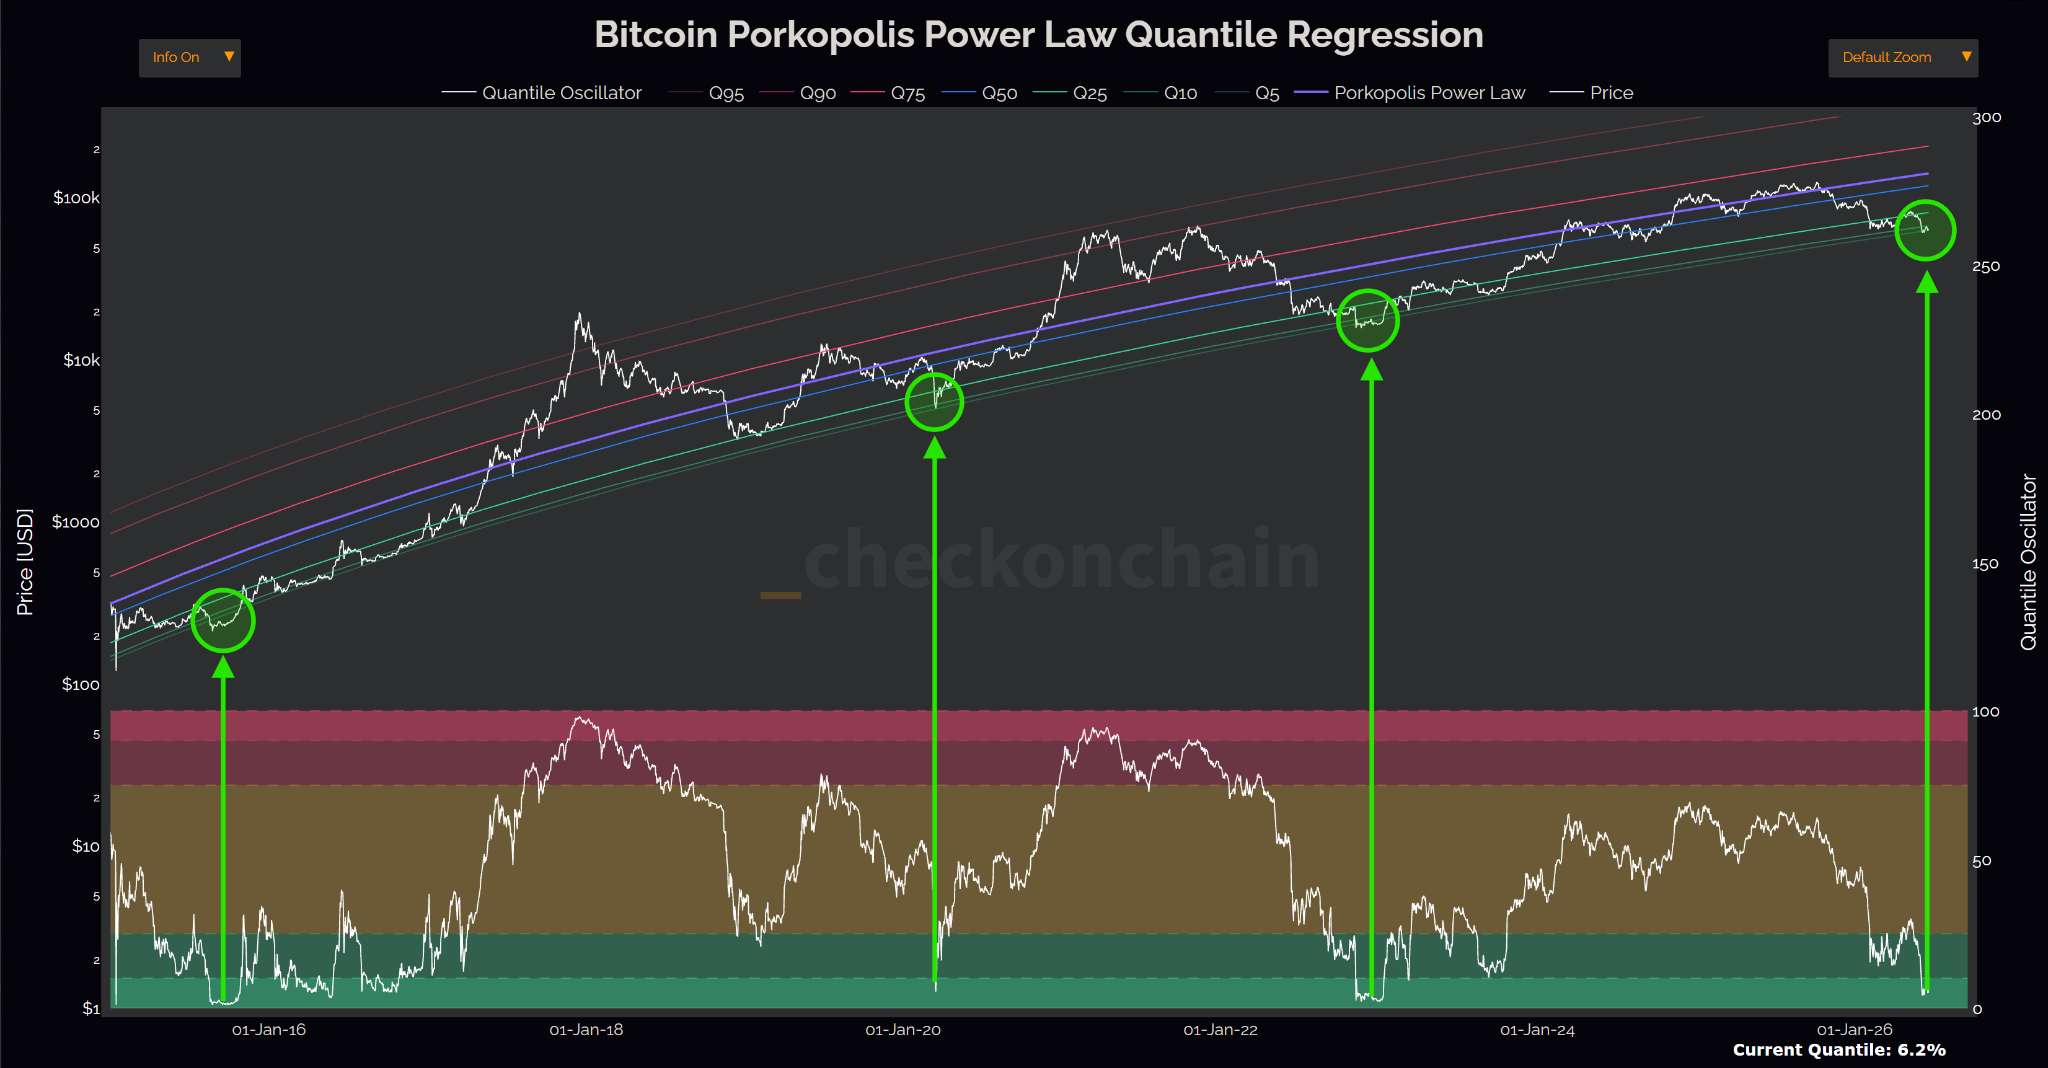
Bitcoin power-law quantile regression chart. Source: Checkonchain
Related: Bitcoin drops to $58K on high US PCE inflation as trader sees ‘manipulation’
Key BTC price levels to watch
Bitcoin fell to a new yearly low of $58,000 after aggressive selling swept through Binance. The hourly taker sell volume reached $2.1 billion, followed by another $1.9 billion in the next hour after the New York market open, marking the exchange’s largest hourly sell pressure since May 4.
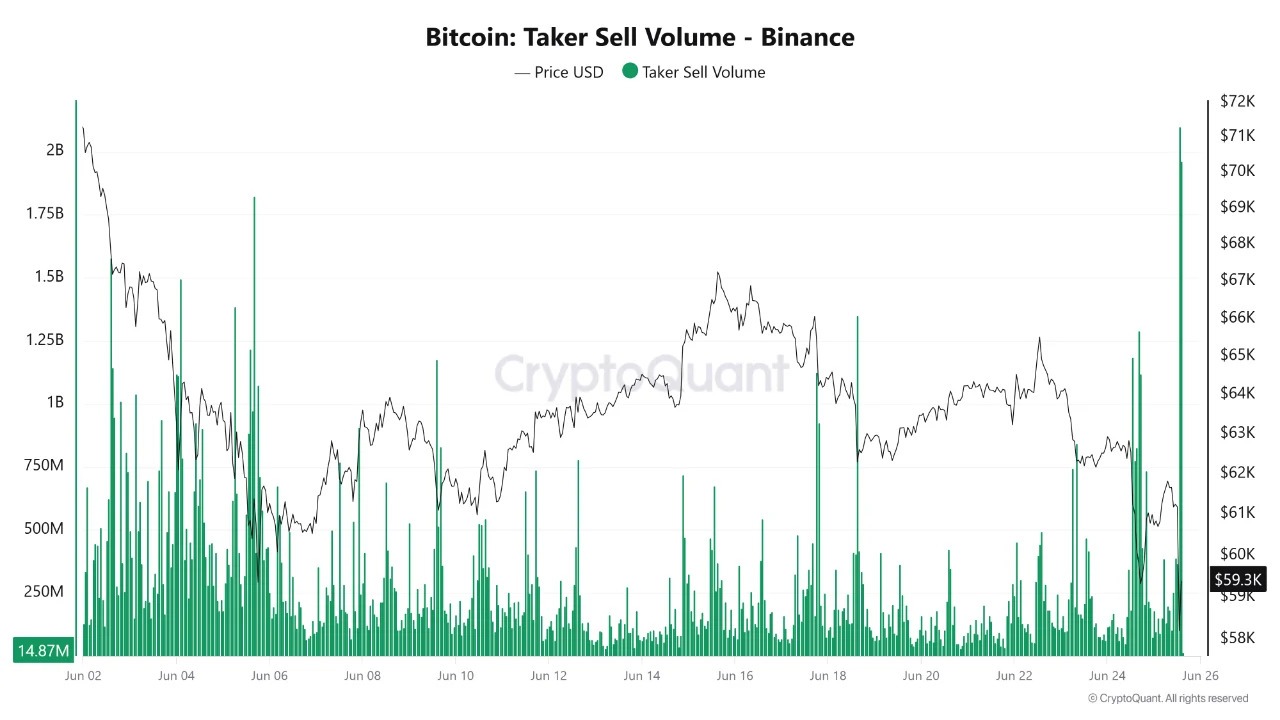
Bitcoin taker sell volume on Binance. Source: CryptoQuant
The flush liquidated more than $300 million in long BTC positions before the price rebounded toward $60,000. That level now carries added significance. A daily close back above $60,000 preserves the developing relative-strength index (RSI) bullish divergence across the one-hour, four-hour, and daily time frames which signals that selling momentum is fading even as the price prints lower lows.
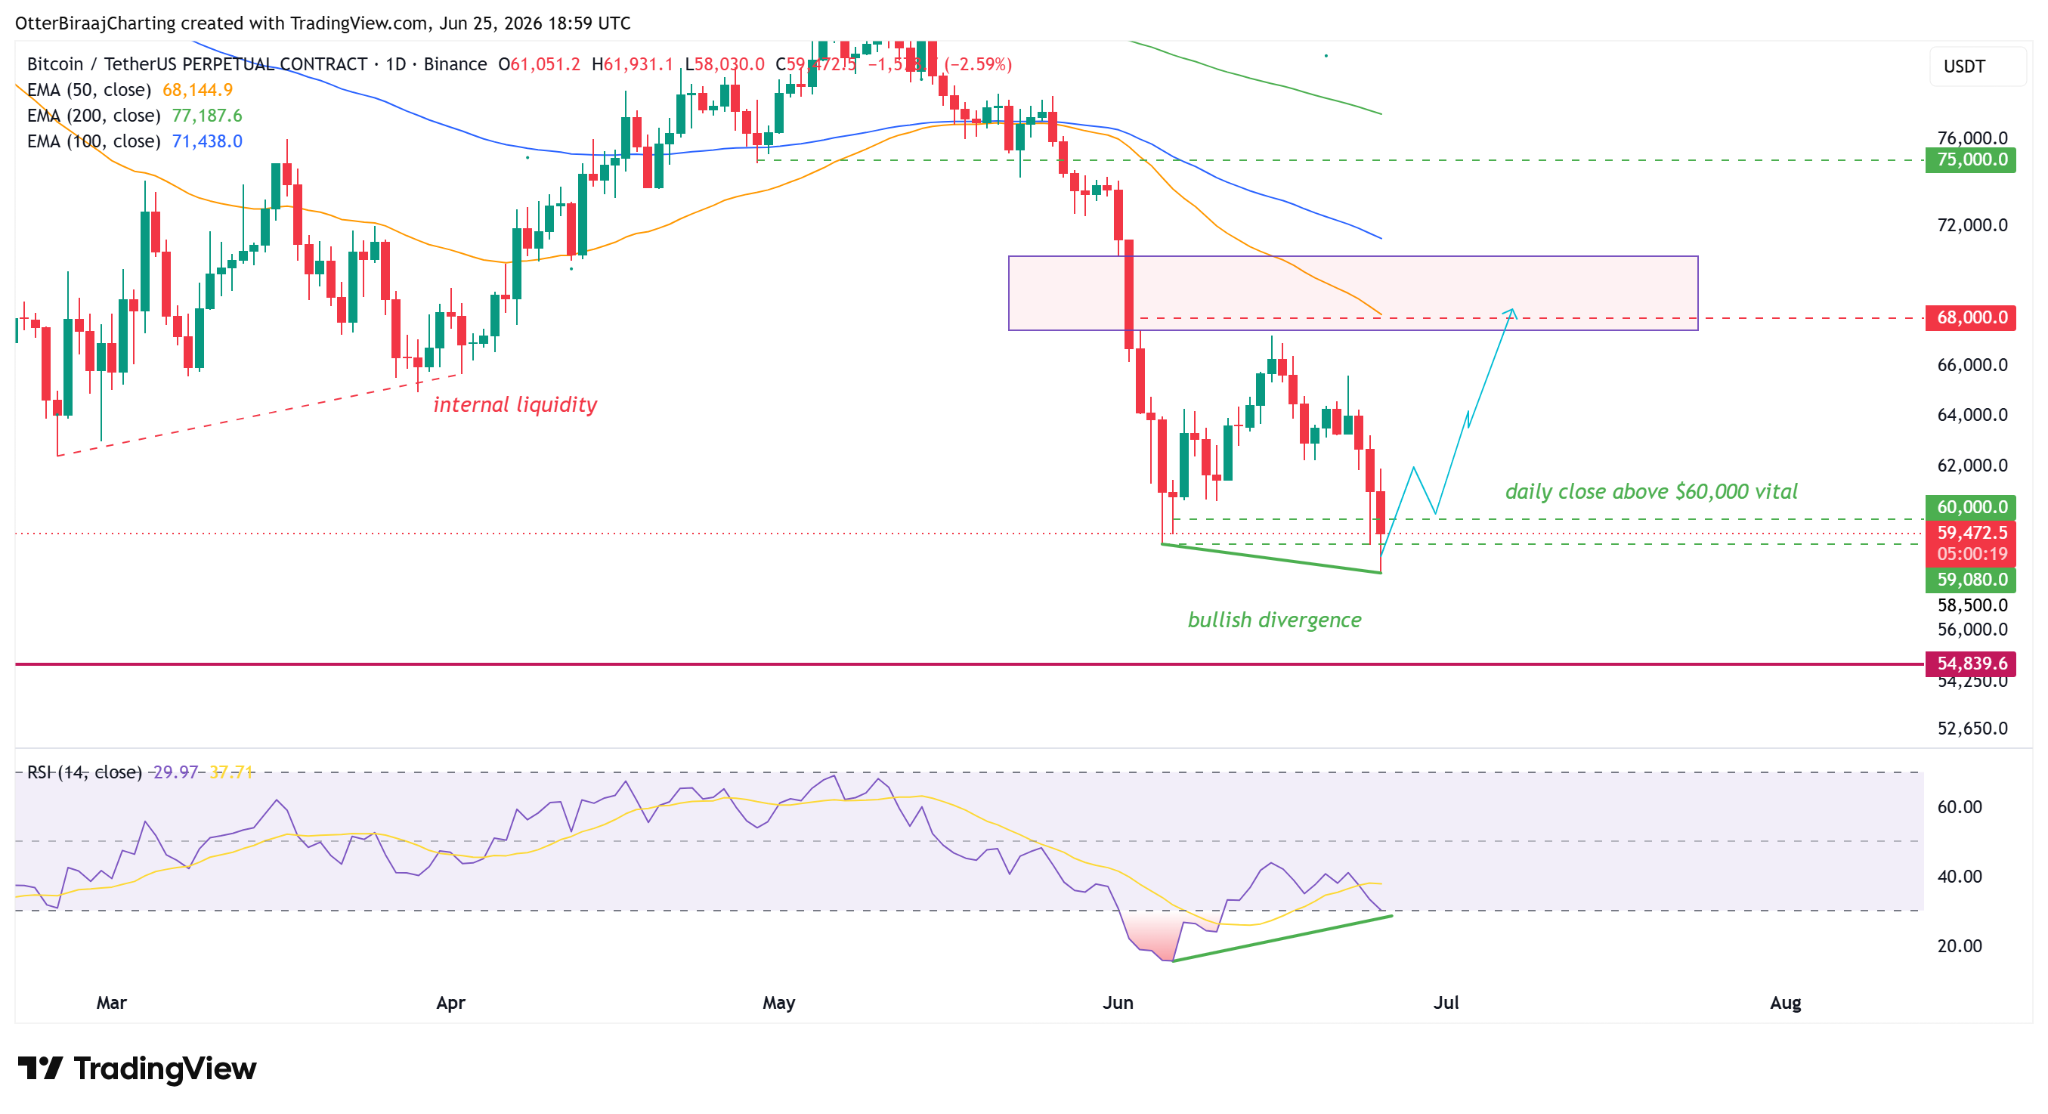
BTC/USDT, one-day chart. Source: Cointelegraph/TradingView
Futures trader Byzantine General shared a similar outlook, saying the move to $58,000 cleared out leveraged longs while drawing in fresh short sellers. In his view, a daily close above $60,000 would strengthen the case that Bitcoin has printed a local bottom for now.
That would also shift attention toward a large pocket of upside liquidity. More than $4 billion in short liquidations cluster near $65,000, compared with about $1 billion below $55,000, creating a four-to-one imbalance. A relief rally could then target internal liquidity near $68,000, where a daily fair-value gap adds another area of interest for traders.
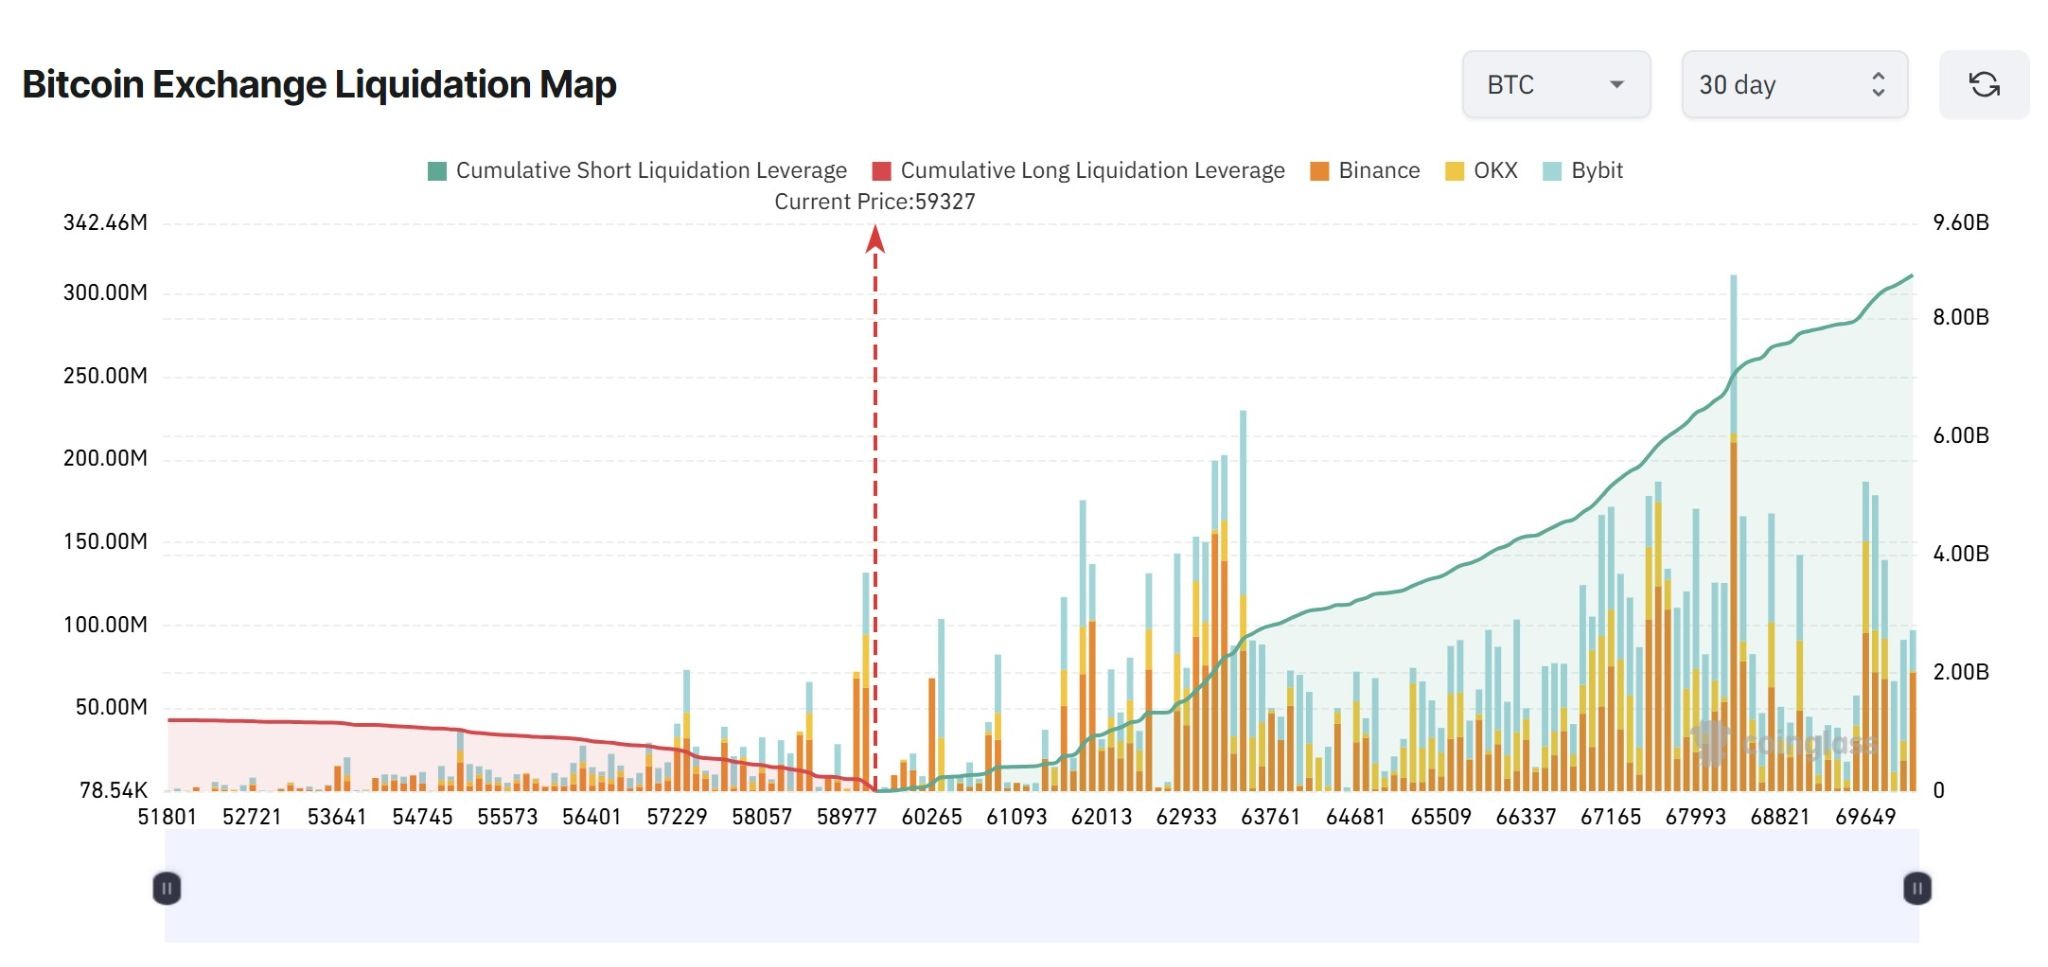
BTC liquidation map. Source: CoinGlass
Meanwhile, a daily close below $60,000 reinforces the bearish bias on both the short-term and long-term charts. The next area of interest then shifts to $55,000, where Bitcoin’s September 2024 weekly range low converges with its realized price near $54,000.
The realized price, which tracks the average cost basis of all onchain coins, has historically provided support at every major Bitcoin bear-market bottom since 2014. That trend makes the $54,000-$55,000 region a key level for traders to watch if selling pressure continues.
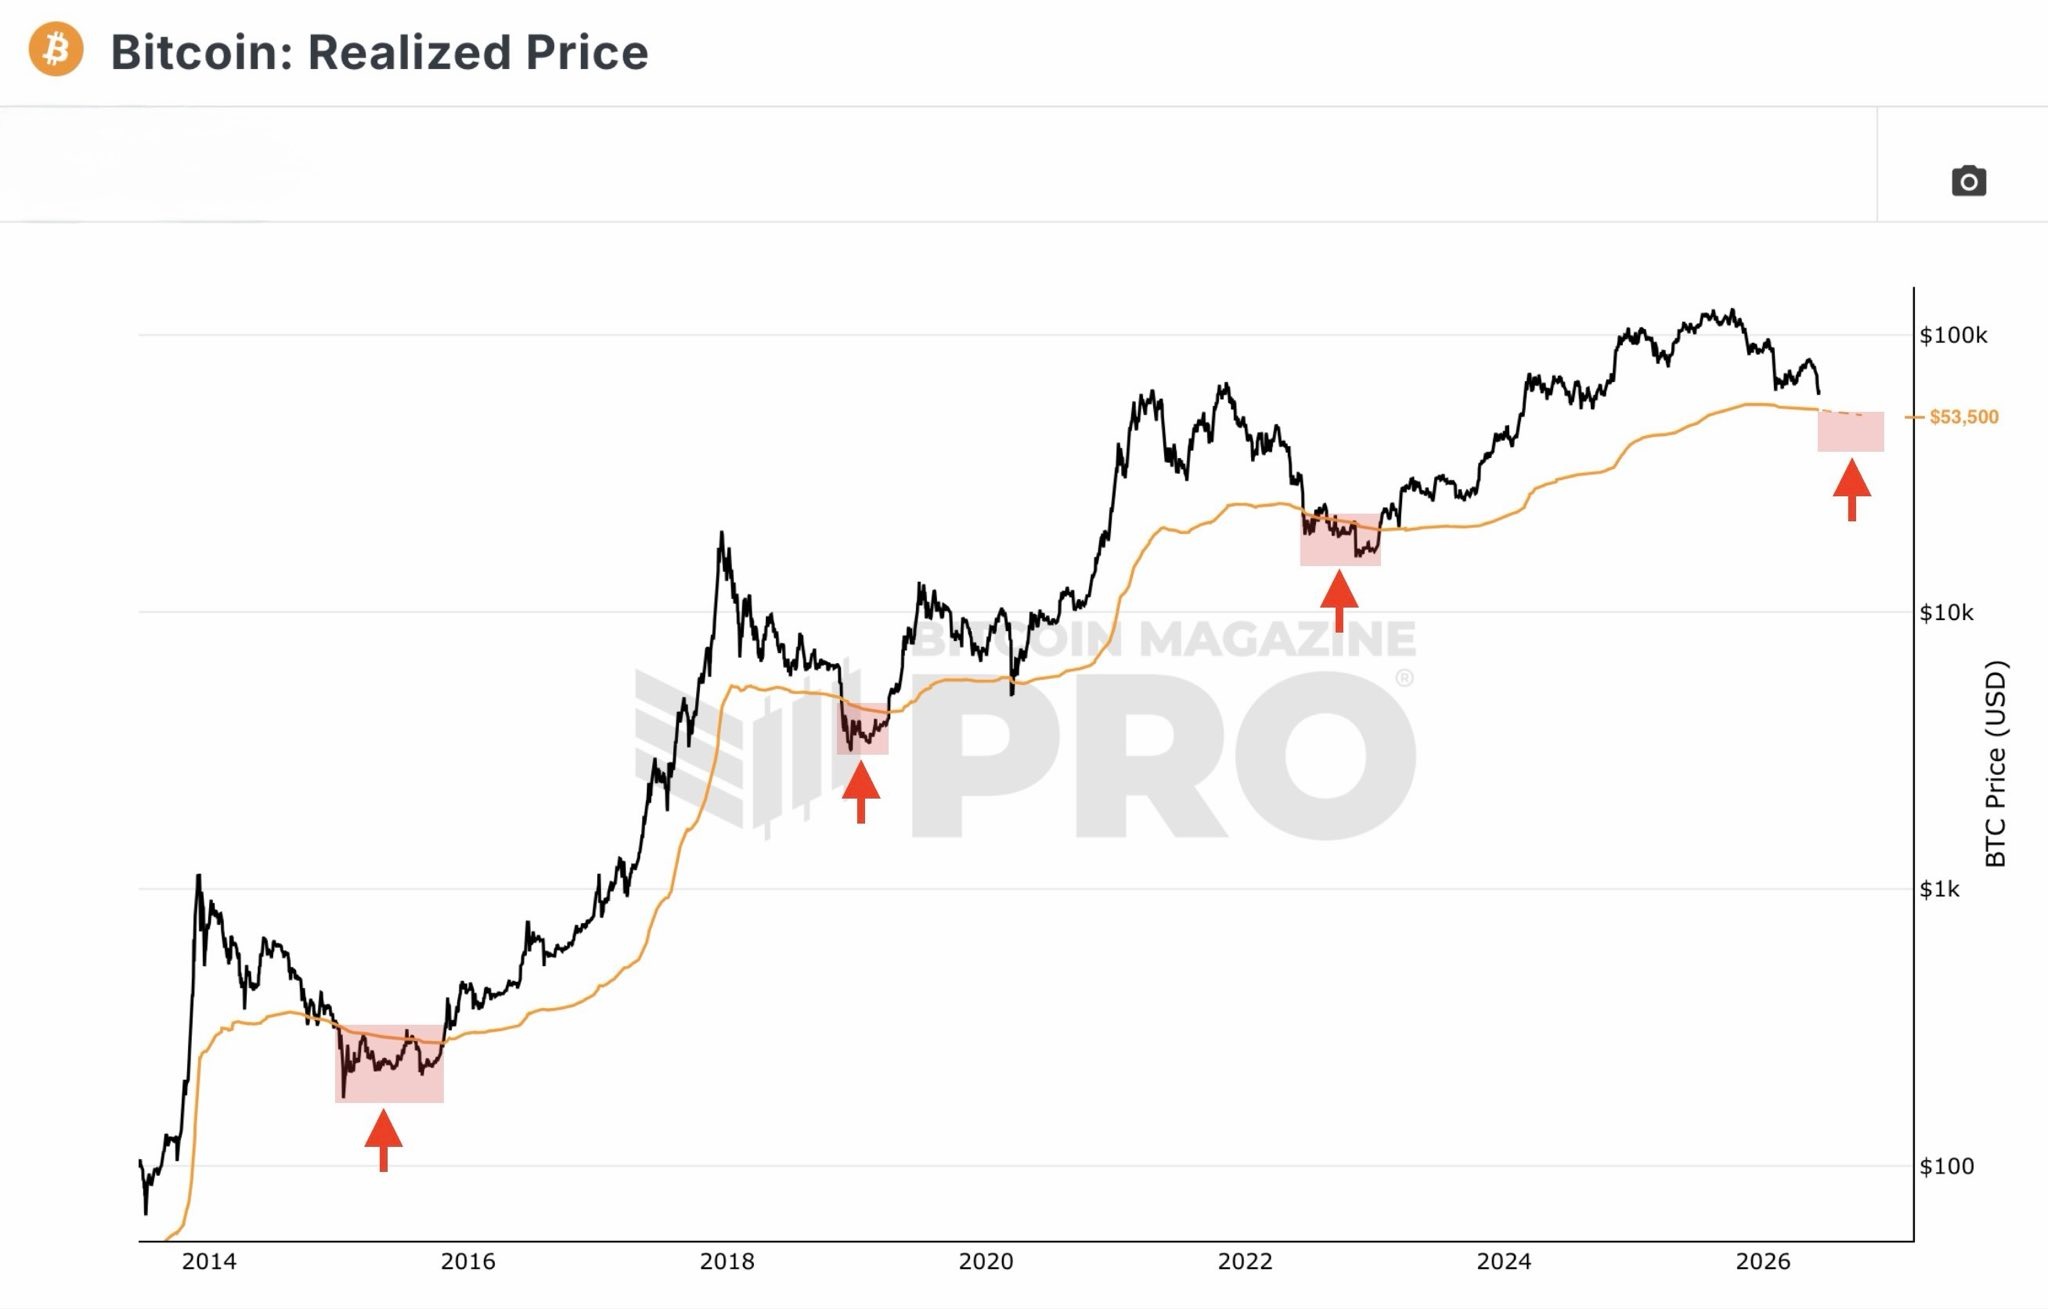
Bitcoin’s realized price. Source: X
Related: Bitcoin drop to $58K brings out bears: Is BTC’s next stop below $50K?

The real reason Germany are running out of time after World Cup setback

Building a PC? MSI has two top motherboard deals for Prime Day

Dad-of-three dies after Manchester Airport incident


-

 Fashion6 days ago
Weekend Open Thread: Miami – Corporette.com
-

 Entertainment5 days ago
Renter of Home in Anne Heche Crash Denies Settlement With Son
-
Sports2 days ago
Two goals and an assist by sheer aura: Cristiano Ronaldo just entered the World Cup chat
-

 Tech3 days ago
Microsoft accidentally kills epic Outlook email threads
-

 Business5 days ago
Soccer-U.S. defends Iran World Cup travel restrictions, says discussions ongoing
-

 Politics6 days ago
Andy Burnham and the meaning of Makerfield
-

 NewsBeat6 days ago
Keir Starmer Allies Question His Chances For No 10
-

 Tech4 hours ago
A Look At A Gaggle Of Transputer Boards
-
Crypto World2 days ago
Bitcoin (BTC) Dips Below $62K, Ethereum (ETH) Plunges 6% Daily: Market Watch
-

 Crypto World2 days ago
Securitize Wraps Roubini's SEC-Registered ETF as Dubai VARA Digital Security
-
Business2 days ago
Entergy settles forward sale agreements, raises $672 million in cash proceeds
-
 Business6 days ago
Wall Street Week Ahead: Investors see Micron earnings as pulse check of AI rally momentum
-
 Crypto World6 days ago
Can Charles Hoskinson Really Rescue Cardano?
-

 Crypto World6 days ago
HIVE shares jump as $220M AI deal speeds Bitcoin mining pivot
-

 Crypto World6 days ago
Jake Chervinsky accuses CME of protecting derivatives monopoly
-

 Entertainment6 days ago
Jose Alvarado Wants Taylor Swift at More Knicks Games
-
 Tech4 days ago
Signal’s Meredith Whittaker says AI chatbots ‘are not your friends’ and calls Copilot agents a backdoor
-

 Sports11 hours ago
India vs Bangladesh LIVE Score, Women’s T20 World Cup: Bangladesh Opt To Bat; India Enter ‘Do-Or-Die’ Stage As Semi-Final Race Heats Up
-

 Tech3 days ago
Nearly 7,000 fake Amazon domains registered ahead of Prime Day 2026, researchers warn
-

 Sports7 days ago
FIFA World Cup 2026: Canada beat 9-men Qatar 6-0 to register first ever win | FIFA World Cup 2026
You must be logged in to post a comment Login