

Crypto World
JasmyCoin Signals Potential Breakout as Multi-Year Accumulation Nears Key Resistance

TLDR:
- JasmyCoin shows repeated falling wedge patterns, often linked with weakening bearish momentum.
- Multi-year consolidation reflects a balance between buyers and sellers before a possible trend shift.
- Current price compression near wedge support suggests a potential buildup toward a breakout move.
- A projected move toward $0.2785 depends on confirmed resistance breakout and sustained momentum.
JasmyCoin is drawing renewed attention after a technical analysis projected a potential long-term breakout toward higher price levels.
The outlook is based on multi-year chart structures that show extended consolidation, repeated falling wedge formations, and a possible transition from a prolonged downtrend into a bullish phase.
Multi-Year Structure Signals Gradual Market Shift
A recent tweet by Javon Marks outlined a macro view of JasmyCoin’s price action across several years. The analysis describes a clear transition from a sharp post-2021 decline into a more structured consolidation phase.
During the earlier cycle, the asset recorded consistent lower highs and lower lows, forming descending channels that reflected sustained selling pressure.
As time progressed, the chart began to show signs of stabilization. A falling wedge pattern emerged during the mid-cycle phase, where price action tightened within converging trendlines.
This structure often reflects weakening bearish momentum. A breakout attempt followed, leading to a short-lived upward move, which suggested early accumulation behavior.
After that move, JasmyCoin entered a broader consolidation range marked by sideways price action. The chart indicates multiple swings within this zone, showing a balance between buyers and sellers.
This range also reflects improved structural stability compared to the earlier downtrend phase. Such conditions often precede larger directional moves once market pressure resolves.
Current Compression Points to Potential Breakout Setup
More recently, the chart shows another falling wedge formation developing on the right side. Price action continues to compress toward the apex of this pattern, indicating reduced volatility and tightening market conditions. This setup often attracts attention due to its association with breakout scenarios.
The current price position remains near the lower boundary of the wedge. This area is commonly viewed as a demand zone where buyers may step in.
At the same time, the upper trendline serves as a resistance level that traders monitor for confirmation of a breakout.
Javon Marks’ tweet also pointed to a projected move toward the $0.2785 level. This target represents a large percentage increase from current prices, contingent on a confirmed breakout and sustained market support.
The projection is illustrated by a curved upward path on the chart, suggesting a gradual expansion rather than an immediate surge.
The broader structure suggests a transition from accumulation into a potential markup phase. However, this depends on whether price action can move above resistance levels with consistent momentum. If the asset fails to break out, the chart suggests continued consolidation or further compression within the wedge.
Overall, the analysis presents a technical setup where JasmyCoin approaches a key decision point. The combination of repeated wedge formations and long-term consolidation continues to shape expectations around a possible trend reversal, depending on future price behavior and market conditions.


TLDR:
- A one-of-one DVN configuration on the Kelp rsETH bridge created a single point of failure that attackers exploited.
- The attacker borrowed 82,650 WETH and 821 wstETH using 89,567 stolen rsETH across eight Aave V3 positions.
- DeFi United coordinated over $300 million in recovery commitments from Lido, Ethena, Mantle, and other contributors.
- Aave’s LayerZero OFT adapter was fully refilled across five tranches, restoring 116,131 rsETH backing in full.
The April 18, 2026 rsETH incident exposed a critical vulnerability in third-party bridge infrastructure connected to Aave’s markets.
A forged cross-chain message on the Kelp rsETH LayerZero V2 bridge released 116,500 rsETH on Ethereum without any matching burn on Unichain.
The attacker then used those tokens as collateral across Aave V3 positions. A coordinated recovery effort later restored full backing and returned all affected markets to normal.
The Bridge Vulnerability That Triggered the Exploit
The Kelp rsETH LayerZero V2 bridge from Unichain to Ethereum relied on a single verifier to sign all inbound cross-chain messages.
That configuration, known as a one-of-one Decentralized Verifier Network, created a single point of failure. When that verifier was targeted by an RPC-poisoning attack, the attacker manipulated its view of the source-chain state entirely.
At 17:35 UTC on April 18, the Ethereum endpoint accepted inbound nonce 308 and released 116,500 rsETH from the RSETH_OFTAdapter.
At that same moment, Unichain’s source endpoint still showed only outbound nonce 307. No burn had occurred on the source chain, yet the Ethereum side processed the message as legitimate.
The root cause was not a flaw in Aave’s smart contracts. Instead, it was the bridge’s reliance on a single verifier and that verifier’s susceptibility to external manipulation. That dependency sat entirely outside the Aave protocol.
How the Attacker Moved Through Aave’s Markets
Once the 116,500 rsETH was released, the attacker moved fast. The stolen tokens were dispersed across seven recipient addresses within minutes of the exploit. From there, 89,567 rsETH was deployed across eight Aave V3 positions on Ethereum Core and Arbitrum.
Against that collateral, the attacker borrowed 82,650 WETH and 821 wstETH. Health factors across the eight positions were kept between 1.01 and 1.03, just above liquidation thresholds. That positioning allowed the attacker to hold the borrowed assets while avoiding automatic liquidation.
Aave’s exposure came from rsETH being listed as collateral on its markets under standard overcollateralization terms. That listing created a direct dependency on the bridge’s verification path, infrastructure that Aave does not control.
The Immediate Containment Steps That Followed
The Aave Protocol Guardian responded within hours. By 19:00 UTC on April 18, rsETH and wrsETH were frozen across Aave V3, and LTV was set to zero.
On Aave V4, the Kelp Spoke was fully frozen across both WETH and rsETH reserves, and WETH borrowing on the Spoke was deactivated immediately.
Between 18:00 and 19:00 UTC, Kelp paused 43,373 rsETH connected to the exploit. That action prevented further movement of those specific tokens and limited additional damage during the early response window.
Over the following two days, additional protections were layered across the affected markets. WETH was frozen across Ethereum Core, Ethereum Prime, Arbitrum, Base, Mantle, and Linea on April 20.
The Arbitrum Security Council then froze 30,766 ETH linked to the attacker on April 21. By April 23, rsETH reserves were fully paused across multiple deployments, preserving the ability to liquidate attacker positions and recover assets for affected users.


Retail investing platforms have spent a number of years racing to become “everything apps” for finance, piling on stocks, crypto, banking and payments in a bid to keep users inside a single ecosystem.
But for moomoo, the next battle isn’t about who offers the most assets.
It’s about who gives retail investors the same level of intelligence and execution long reserved for Wall Street institutions.
“We want to democratize access to the best tools that have historically only been available to institutional investors,” Albi Mema, director of crypto operations at moomoo U.S., told CoinDesk in an interview. “A decade ago the issue was access. Now it’s the quality of access.”
“Moomoo is built for the retail investor who has outgrown basic trading apps. Today’s retail investors are more informed, more engaged, and more demanding than ever,” according to Mema. “They do not just want access to markets, they want better data, better tools, better education, and more context around the decisions they make,” he added.
Global platform
Moomoo is a global trading platform that offers retail investors access to stocks, options, exchange-traded funds (ETFs) and cryptocurrencies through a single app. The company focuses on combining low-cost trading with institutional-grade market data, analytics and investing tools for self-directed traders.
The New York-based firm, which says it has more than 30 million global users, $156 billion in client assets and nearly $1.9 trillion in annual trading volume, is betting that retail traders increasingly want sophisticated analytics, AI-assisted trading and institutional-style execution tools rather than simply another crypto venue.
That positioning comes as brokerages across both crypto and traditional finance push toward the “one-stop shop” model. Robinhood (HOOD), Kraken and Coinbase (COIN) have all expanded beyond their original products in recent years, blending equities, derivatives, payments and digital assets into broader financial platforms.
Mema argues moomoo’s differentiator is not aggregation alone, but the depth of tooling layered on top of it.
“The next generation of retail investors won’t be defined by who offers the most assets,” he said. “It will be about who helps investors make the best decisions across those assets.”
Retail traders
Retail investors are increasingly seeking institutional-grade analytics, execution capabilities, and AI-powered trading tools which drive trading assistance into the platform.
“Retail investors are building positions, measuring volatility and thinking long term,” he said. “They’re trading alongside some of the best and brightest.”
The company’s no-code algorithm builder allows users to scan markets for technical patterns, backtest strategies and automate trading signals.
Traders can also share strategies with the broader community, creating what Mema described as a collaborative “trading floor” dynamic for over 30 million retail participants.
Mema says retail crypto traders often experience significantly worse execution speeds and slippage than institutions, with some retail orders taking hundreds of milliseconds to settle compared with institutional systems that operate in tens of milliseconds or faster.
“If you’re getting rinsed on slippage, that puts you at a disadvantage as a crypto user,” he said. “We are bringing institutional-level execution to retail.”
The firm is also pushing deeper into tokenization. Moomoo recently joined Figure Markets’ onchain public securities initiative and partnered with Figure (FIGR) and BitGo (BTGO) on tokenized secondary market offerings.
“We think the future is hybrid. Traditional markets are not disappearing. Blockchain-native markets are not replacing everything tomorrow,” Mema says. “But the two are starting to converge, and platforms that can bridge those worlds responsibly will be well positioned,” he added.
Read more: Gemini taps SpaceXAI to build a personalized prediction markets feed

Key Takeaways
- Rocket Lab has evolved from a pure launch provider into a comprehensive space systems company with satellite production capabilities and government partnerships, earning 8 Buy and 4 Hold ratings from analysts
- AST SpaceMobile aims to deliver space-based cellular connectivity to standard mobile devices through strategic alliances with major carriers including AT&T and Verizon
- Redwire operates across multiple space infrastructure segments, providing satellite technology, manufacturing solutions, and engineering services to NASA and defense customers
- Each company maintains analyst consensus favoring buy recommendations, yet all three present significant risk profiles with ongoing losses
- Accelerating public and private sector investment in satellite technology, defense applications, and space-based systems continues fueling market enthusiasm
As the commercial space sector gains momentum, Rocket Lab, AST SpaceMobile, and Redwire have emerged as three closely monitored investment opportunities spanning satellite technology, national security, and orbital infrastructure development.
Rocket Lab: Evolving Into a Full-Spectrum Space Company
Rocket Lab has transformed from its origins as a launch services provider into a multifaceted space enterprise.
While the Electron launch vehicle remains central to operations, the organization has broadened its scope to encompass satellite production, integrated space systems, and substantial government contracting work. Wall Street increasingly recognizes the company as a comprehensive space infrastructure provider rather than merely a rocket manufacturer.
The firm maintains revenue streams from both private sector clients and federal agencies. This balanced customer portfolio has strengthened earnings predictability and drawn institutional capital.
Development continues on the Neutron vehicle, a larger-capacity rocket engineered for substantial payload requirements. Successful deployment would significantly expand the company’s addressable mission profile.
National security and defense appropriations have provided additional momentum. Current analyst sentiment reflects 8 Buy recommendations, 4 Hold positions, and zero Sell ratings.
AST SpaceMobile: Ambitious Vision Meets Execution Challenge
AST SpaceMobile ranks among the most discussed equities within the space investment landscape.
The enterprise is constructing a satellite constellation designed to provide cellular broadband service. The innovative approach enables standard smartphones to connect directly with orbital assets, eliminating ground-based infrastructure requirements.
Collaborations with telecommunications giants AT&T and Verizon underscore commercial validation. The company has been progressively launching satellites to validate technology and expand network coverage. These operational milestones have generated considerable market enthusiasm.
Share price volatility remains pronounced. Market participants respond aggressively to launch schedules, capital raises, and technical achievements. Critics highlight execution uncertainty and the substantial funding requirements necessary to complete the constellation.
Believers envision AST potentially operating among the planet’s most extensive space-based communications platforms. Analyst coverage shows 5 Buy ratings, 1 Hold, and no Sell recommendations.
Redwire: Infrastructure Provider Behind the Scenes
Redwire operates with less fanfare than Rocket Lab or AST SpaceMobile, yet has established meaningful traction across the space economy.
The organization specializes in satellite subsystems, orbital infrastructure, digital engineering platforms, and manufacturing capabilities for the space environment. Client relationships span NASA programs, military applications, and commercial space ventures.
This diversified business model reduces dependence on any single revenue source or mission category. Income generation flows from varied contracts across distinct segments of the space marketplace.
Analysts express measured optimism regarding the path to sustained profitability. Coverage currently stands at 4 Buy ratings, 2 Hold positions, and zero Sell recommendations.
Understanding the Risk Profile
None of these three companies currently generates net profits. Valuations depend heavily on projected growth trajectories and continuing success in contract acquisition.
Mission postponements, capital constraints, or contract losses can trigger sharp downward price movements. Prospective investors must acknowledge and accept substantial volatility.
Nevertheless, global government agencies and commercial entities continue expanding budgets allocated toward satellite systems, defense technologies, and space-based infrastructure, sustaining long-term sector demand fundamentals.

Bitcoin (BTC) is staging a technical rebound after testing a critical on-chain support zone tied to the realized price of coins held by short- to mid-term investors. The pop back toward the mid-$70,000s comes as the market eyes whether the 3–6 month realized price around $71,400 can act as a durable floor, potentially paving the way for a move back toward higher levels, including a suggested target near $78,200 and, in a more bullish scenario, a possible climb toward $100,000 by year-end.
Key takeaways:
- Bitcoin is eyeing a rebound toward $78,200, the realized price for BTC held 3–6 months, which could mark a pivotal turning point if breached.
- A sustained move above this cost basis could set the stage for a potential rally toward $100,000 by year-end, according to on-chain and technical readings.
- On-chain data place the 3–6 month realized price near $71,400, a level described by analysts as a strong near-term support that has historically underpinned medium-term conviction.
- Past breakouts above the 3–6 month cost basis have tended to precede stronger gains over longer horizons, though the near-term path remains constrained by a bear-flag pattern.
On-chain support under the microscope
Bitcoin’s weekend rebound was modest but notable, advancing roughly 2.5% to hover near the $74,000 mark after touching a local trough just above $72,500. The move reflects a familiar dynamic: a bounce from a price zone that coincides with the realized price of coins held for three to six months. This cohort is widely watched because it represents capital that has remained in the market long enough to reflect genuine medium-term conviction.
Glassnode’s analysis of realized prices across different aging cohorts shows that the 3–6 month group sits around $71,400. In a Sunday note, analyst Marcus Corvinus described this level as Bitcoin’s “strongest near-term support,” arguing that holders within this band may defend the area to avoid a broader pullback.
“This cohort is still holding profits, creating a strong incentive to defend the level,” Marcus Corvinus said in a Sunday post.
The near-term target around $78,200 aligns with the same 3–6 month realized price, a level sometimes invoked by traders as a gauge for the next phase of upside. The rationale is that regaining the cost basis of this cohort could restore confidence among holders who have been sitting on unrealized gains as BTC navigates a choppy macro environment. Analysts have pointed to the $78,200 mark as a potential hurdle that, once cleared, could reframe the path toward higher targets.
For perspective, this threshold sits not far from a historical point of reference: the time when BTC briefly cleared the 3–6 month realized price in previous cycles often preceded more extended periods of strength. A prior technical breakdown that saw BTC slice through the $78,000 area in October 2025 is cited in market commentary as a reminder that structure and price discipline often dictate the next leg of the journey.
In addition to the on-chain picture, recent coverage from Cointelegraph has highlighted the significance of this level within broader narratives around reclaiming psychological milestones, including the idea that BTC does not necessarily require a fresh narrative to retake $100,000, a view echoed by several analysts this year.
What the numbers imply for upside potential
Beyond the immediate price action, the signal from the 3–6 month realized-price breakouts has, historically, translated into meaningful upside over longer horizons. Data points compiled by Glassnode suggest a pattern: after similar breakouts, BTC has averaged a 2.3% gain over the next 30 days, a 21.9% gain after 90 days, and roughly a 36.6% gain after six months. While past performance does not guarantee future results, the sequence underscores how on-chain dynamics around holder cost bases can foreshadow multi-week to multi-month cycles of upside.
Applying this framework to Bitcoin’s current setup, the implication is that a sustained move above $71,400 and then $78,200 could imply a broader re-rating of prices over the coming months. With Bitcoin hovering near $74,000, even moderate alignment with these historical patterns would translate into notable upside over the next several weeks to months.
Yet the market is navigating a delicate balance. The analyst view is that the signal is strongest when the price sits above the 3–6 month realized price and remains above it for a meaningful period, confirming a shift in holder sentiment. In practice, that means watching not just the level itself but the price action around it—especially as a dynamic bear-flag pattern develops on the daily chart.
Bear flag reality checks: upside capped or vulnerable to a deeper decline?
On the technical side, Bitcoin’s rebound is taking place near the bear-flag’s lower boundary, a configuration that has become a point of cautious optimism for bulls but also a source of downside risk if the pattern fails.
The bear flag formed after BTC’s retreat from the late-2026 highs around $98,000. The price is now testing the rising support line associated with the flag, with the upper boundary near $90,000 serving as a nearby probe for bulls. If price can sustain a move toward that upper limit, the chart would align with a bullish reversion scenario in the months ahead.
Analysts point out that the $90,000 zone sits at a confluence of technical factors, including proximity to the 0.786 Fibonacci retracement level and the 3–6 month holder cost basis. A successful push past the flag’s upper boundary could renew momentum toward higher targets, while any daily close below the lower trend line would rekindle bearish pressure and leave a path toward a much deeper pullback—potentially into the $50,000–$60,000 range, depending on the exact breakdown point and the market’s reaction to it.
In this context, the balance of probabilities favors careful risk management. The scenario that holds the line at or above the lower boundary and pushes toward or through $90,000 would imply a meaningful shift in sentiment, especially if on-chain indicators confirm sustained demand among holders who benefited from the recent bounce. Conversely, a decisive break lower would reframe the narrative around the durability of on-chain support levels and could signal a renewed phase of volatility as traders reassess risk exposure.
Market observers are also watching how macro factors—rates, liquidity conditions, and risk appetite—interact with this on-chain signal. While the analytics point to a potentially constructive path if fundamentals align, the immediate horizon remains sensitive to trend-line dynamics and the price’s ability to defend the current support area.
For readers seeking a cross-check on the latest thinking, Cointelegraph’s coverage in related pieces has highlighted that patience and clarity around price action, rather than chasing a single target, may define the next phase for Bitcoin. In particular, analyses discussing whether a fresh narrative is necessary to reclaim $100,000 have noted that existing on-chain and technical signals can be sufficient to sustain a longer-term uptrend if they cohere with favorable market conditions.
What to watch next: the day-to-day price action around the $71,400–$78,200 zone will be telling. A clear close above $78,200 would strengthen the case for a continued rally toward the $90,000–$100,000 region, while a sustained break below the lower bear-flag line would raise the odds of a deeper retracement toward the $50,000–$60,000 area. Traders and investors should monitor on-chain metrics, especially the behavior of the 3–6 month cohort, and remain mindful of the broader macro backdrop that could amplify or dampen the next phase of BTC’s trajectory.
As outlined in recent market notes, the path forward remains nuanced. The indicator suite suggests a potential for upside, but the bear-flag framework keeps downside risk in play. The coming weeks should reveal whether on-chain support can translate into a durable uptrend or if the market will test lower levels before finding a more convincing leg higher.

XRP had a weak start to 2026 from a market view, but activity on the XRP Ledger rose sharply during the same period, according to Messari’s State of XRP Q1 2026 report.
Summary
- XRP price fell 27% in Q1, but XRPL daily transactions rose 35.3% to 2.48 million.
- RLUSD reached $340.3 million on XRPL, making it the network’s largest stablecoin by quarter-end.
- XRPL’s RWA market cap jumped 124.1% QoQ to $2.25 billion, reaching a new quarterly high.
XRP price fell as trading cooled
Messari said XRP ended Q1 as the fourth-largest non-stablecoin crypto asset by market value, behind Bitcoin, Ethereum and BNB. Even so, the token followed the wider market lower during the quarter.
XRP’s market cap fell 26.3% quarter-over-quarter to $82.21 billion. Its price also dropped 27.1% to $1.34, while circulating supply rose 1.1% to 61.34 billion XRP.
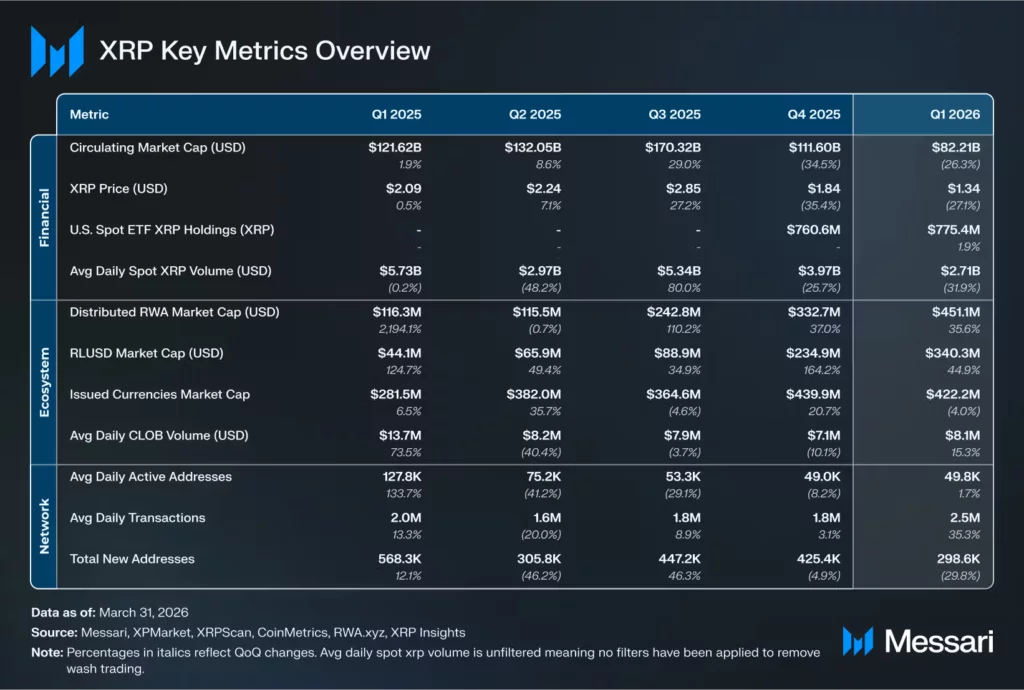
Trading activity also slowed. Messari said average daily spot volume fell 32%, while perpetual futures volume declined 28.6% during the quarter.
The report said U.S. spot XRP ETFs ended Q1 holding 775.4 million XRP. That represented 1.26% of circulating supply and was up 1.9% from the previous quarter.
XRPL transactions moved higher
While XRP price weakened, network activity moved in the opposite direction. Messari said average daily transactions on the XRP Ledger increased 35.3% quarter-over-quarter.
Daily transactions rose from 1.83 million to 2.48 million. The increase suggests that XRPL usage expanded even as token price and trading activity cooled.
The report tied that growth to the network’s wider feature set. XRPL continues to support payments, token issuance, decentralized liquidity, real-world assets and stablecoins.
Messari also noted that XRP remains tied to network use through transaction fees, account reserves, liquidity, asset ownership and bridging across currencies.
RLUSD and tokenized assets lead growth
Ripple’s RLUSD stablecoin grew during the quarter. Messari said RLUSD closed Q1 with a $340.3 million market cap on XRPL, up 44.9% quarter-over-quarter.
That made RLUSD the largest stablecoin on the XRP Ledger. The report also said RLUSD had more holders on XRPL than Ethereum by quarter-end, although Ethereum still handled larger transfer volume.
XRPL’s real-world asset market cap also rose sharply. Messari said RWA market cap on the network climbed 124.1% quarter-over-quarter to $2.25 billion.
The growth pushed XRPL into the top group of public blockchains for tokenized assets. The report said the network ranked seventh by RWA market cap at the end of Q1 and fourth by the time of publication.
Institutional finance tools expand
Messari said new institutional finance tools also moved forward during the quarter. Permissioned Domains, Permissioned DEX and Token Escrow went live on XRPL.
Native lending and asset vault features remained in voting. If approved, those tools could support lending, borrowing and more structured use of XRP and other assets on the network.
As previously reported by crypto.news, Morgan Stanley recently disclosed small positions in two XRP-focused ETFs. XRP funds also attracted $85.8 million in inflows over three weeks, showing continued demand through regulated products.
Separate coverage has also noted a key market tension. RLUSD can help grow XRPL usage, but stablecoin settlement does not always create the same direct demand for XRP as a bridge asset.
Messari said its report was commissioned by Ripple, while Messari retained editorial control. The report still shows a clear Q1 split: XRP price and trading activity fell, while XRPL transactions, RLUSD adoption and tokenized asset growth moved higher.
Crypto World
Three AI Powerhouses to Monitor: Nvidia (NVDA), Microsoft (MSFT), and AMD Stock Analysis

Quick Overview
- Nvidia commands the AI semiconductor sector with overwhelming analyst backing and price targets spanning $245–$300
- Microsoft’s comprehensive AI integration spans its entire ecosystem, fueled by Azure infrastructure and OpenAI collaboration
- AMD emerges as a formidable challenger in AI chips with increasing institutional confidence
- Analyst communities overwhelmingly rate all three as “Buy” opportunities
- Corporate AI infrastructure investments remain robust, sustaining demand for processors and cloud platforms
The artificial intelligence revolution continues reshaping equity markets. Corporate expenditure on AI infrastructure, cloud platforms, and specialized processors reaches unprecedented levels. Three companies consistently dominate analyst watchlists: Nvidia, Microsoft, and AMD.
Nvidia: Semiconductor Supremacy in AI Computing
Nvidia stands as the undisputed symbol of artificial intelligence expansion.
The company’s GPUs serve as the foundation for leading AI systems, deployed across hyperscale cloud environments, corporate data centers, and emerging AI ventures. Nvidia maintains unchallenged superiority in extreme-performance machine learning hardware.
Wall Street sentiment strongly validates this dominance. Leading financial institutions predominantly assign Buy recommendations, establishing price objectives between $245 and $300. Among 54 professional assessments, 51 recommend buying, 3 suggest holding, and zero advise selling.
Nvidia’s competitive moat extends beyond silicon. The CUDA programming ecosystem creates substantial switching costs that retain customers. Strategic expansion encompasses robotics applications, self-driving technology, networking infrastructure, and corporate AI solutions.
Microsoft: Comprehensive AI Platform Integration
Microsoft represents perhaps the most underestimated AI opportunity relative to market capitalization.
Artificial intelligence permeates the company’s portfolio across Microsoft 365, Azure cloud services, GitHub development tools, Teams collaboration, LinkedIn networking, and Dynamics business applications. Strategic alignment with OpenAI positions Microsoft centrally within corporate AI adoption patterns. Azure experiences accelerating consumption of AI-optimized cloud resources.
Microsoft’s financial foundation differentiates it from speculative AI investments. Substantial operating cash flow from established revenue streams enables sustained AI investment without operational compromise.
Among 46 professional ratings, 39 recommend buying, 7 advise holding, and none suggest selling.
The company controls extensive enterprise datasets through its software ecosystem, providing competitive advantages in developing and refining AI capabilities for business customers.
AMD: The Ascending Competitor
Advanced Micro Devices demonstrates accelerating momentum within Nvidia’s dominated territory.
The chipmaker continues capturing share across server processors and AI acceleration hardware. Multiple institutional analysts recently elevated price projections following impressive financial results and strengthening demand for AMD’s AI semiconductor portfolio.
Of 34 analyst evaluations, 28 are Buy, 6 are Hold, and zero are Sell.
AMD’s expansion narrative transcends AI chips alone. The company gains traction in server CPU markets as enterprises expand computational capacity. Customer strategies emphasizing vendor diversification naturally benefit AMD.
Analysts identify AMD as a primary beneficiary of expanding enterprise AI capital deployment through coming years.
Final Thoughts
Each company occupies advantageous positioning as artificial intelligence expenditure maintains upward trajectory. Nvidia commands hardware supremacy, Microsoft dominates software and cloud delivery, and AMD advances as a compelling alternative supplier.
TLDR:
- Binance recorded $1.2B in net stablecoin outflows in May, reversing two months of positive inflows.
- Bitcoin dropped 3.5% in May while the S&P 500 and Nasdaq posted gains of 5.15% and 10.5% respectively.
- Binance stablecoin reserves have fallen from $51B to $44B since November 2024, a decline of 13.7%.
- Analysts describe Bitcoin’s current rebound as technical, not backed by consistent liquidity-driven momentum.
Binance stablecoin outflows reached approximately $1.2 billion in May 2025, marking a sharp reversal from the two prior months of positive inflows.
This shift came even as traditional equity markets posted strong monthly gains. The S&P 500 rose 5.15%, while the Nasdaq climbed 10.5%.
Bitcoin, however, closed the month down 3.5%, reflecting a disconnect between crypto and equities. Liquidity is not flowing into the digital asset market at this time.
Crypto Liquidity Fails to Follow Equity Market Rally
May’s outflows broke a two-month streak of positive stablecoin inflows on Binance. The exchange had recorded net inflows of $2.5 billion and $870 million in the two preceding months. The reversal points to a broader pullback in retail and institutional appetite for crypto exposure.
On-chain analyst Darkfost noted the trend on X, stating that “liquidity is simply not flowing into the crypto market at the moment.”
The monthly net stablecoin flows on Binance served as a clear measure of this slowdown. The data painted a straightforward picture of fading market participation.
Binance still holds the largest share of stablecoin reserves among exchanges. Its estimated market dominance stands at nearly 68%.
Despite this dominant position, total stablecoin balances on the platform have been declining for several months.
Since November 2024, Binance’s stablecoin reserves have dropped from $51 billion to $44 billion. That represents a fall of 13.7% over the period. The trend shows users are consistently withdrawing funds rather than deploying them into crypto positions.
Bitcoin’s Recovery Looks Technical Rather Than Liquidity-Driven
Bitcoin’s rebound from its correction lows appears to lack the liquidity support seen in late 2024. At that time, consistent stablecoin inflows backed the rally and pushed prices higher with stronger momentum. The current move does not yet show similar characteristics.
The earlier correction pushed Bitcoin into heavily oversold conditions, which likely triggered a technical bounce. Darkfost described the move as “a rebalancing move rather than the beginning of a new liquidity-driven uptrend.” That framing aligns with what the stablecoin flow data currently shows.
Investor attention, for now, remains directed toward equities rather than digital assets. The easing of tensions around the Strait of Hormuz helped lift stock markets in May. Crypto markets, however, did not benefit from the same sentiment shift.
Periods of low market interest have historically offered opportunities to build positions gradually. Monitoring stablecoin inflows and outflows remains one of the most reliable tools for tracking liquidity rotation.
A sustained return of inflows to exchanges like Binance would signal renewed conviction in the crypto market.


Alephium, a proof-of-work Layer 1 that runs a private fork of the Wormhole bridge, lost about $815,000 across Ethereum and BNB Chain on Friday after an attacker pushed forged messages through the bridge backend and out the other side as legitimate-looking transfers, according to the team. Alephium… Read the full story at The Defiant
Worldcoin rallied after World Network partnered with Thirty Seconds to Mars to offer human-only ticket access for selected concerts.
Summary
- WLD climbed after World ID partnered with Thirty Seconds to Mars for human-only ticket access.
- Price hit $0.3779 before cooling, leaving $0.30 to $0.32 as key support.
- MACD remains bullish, but RSI shows the rally has slowed after the latest rejection.
Worldcoin moved higher after the Sam Altman-linked identity project gained attention for a new ticketing use case. The partnership allows verified World ID users to access special Thirty Seconds to Mars tickets.
The offer gives verified fans 2-for-1 ticket access, with one free extra ticket excluding VIP packages. It also gives users limited-edition merchandise vouchers for selected shows.
The campaign targets a common live-event problem: bots buying tickets before real fans can access them. World Network says World ID can prove that a user is human without giving ticket sellers a normal account-based identity check.
That real-world use case helped WLD stand out in a mixed altcoin market. The token rose strongly earlier in the session before cooling from its intraday high.
Worldcoin Price cools after strong intraday move
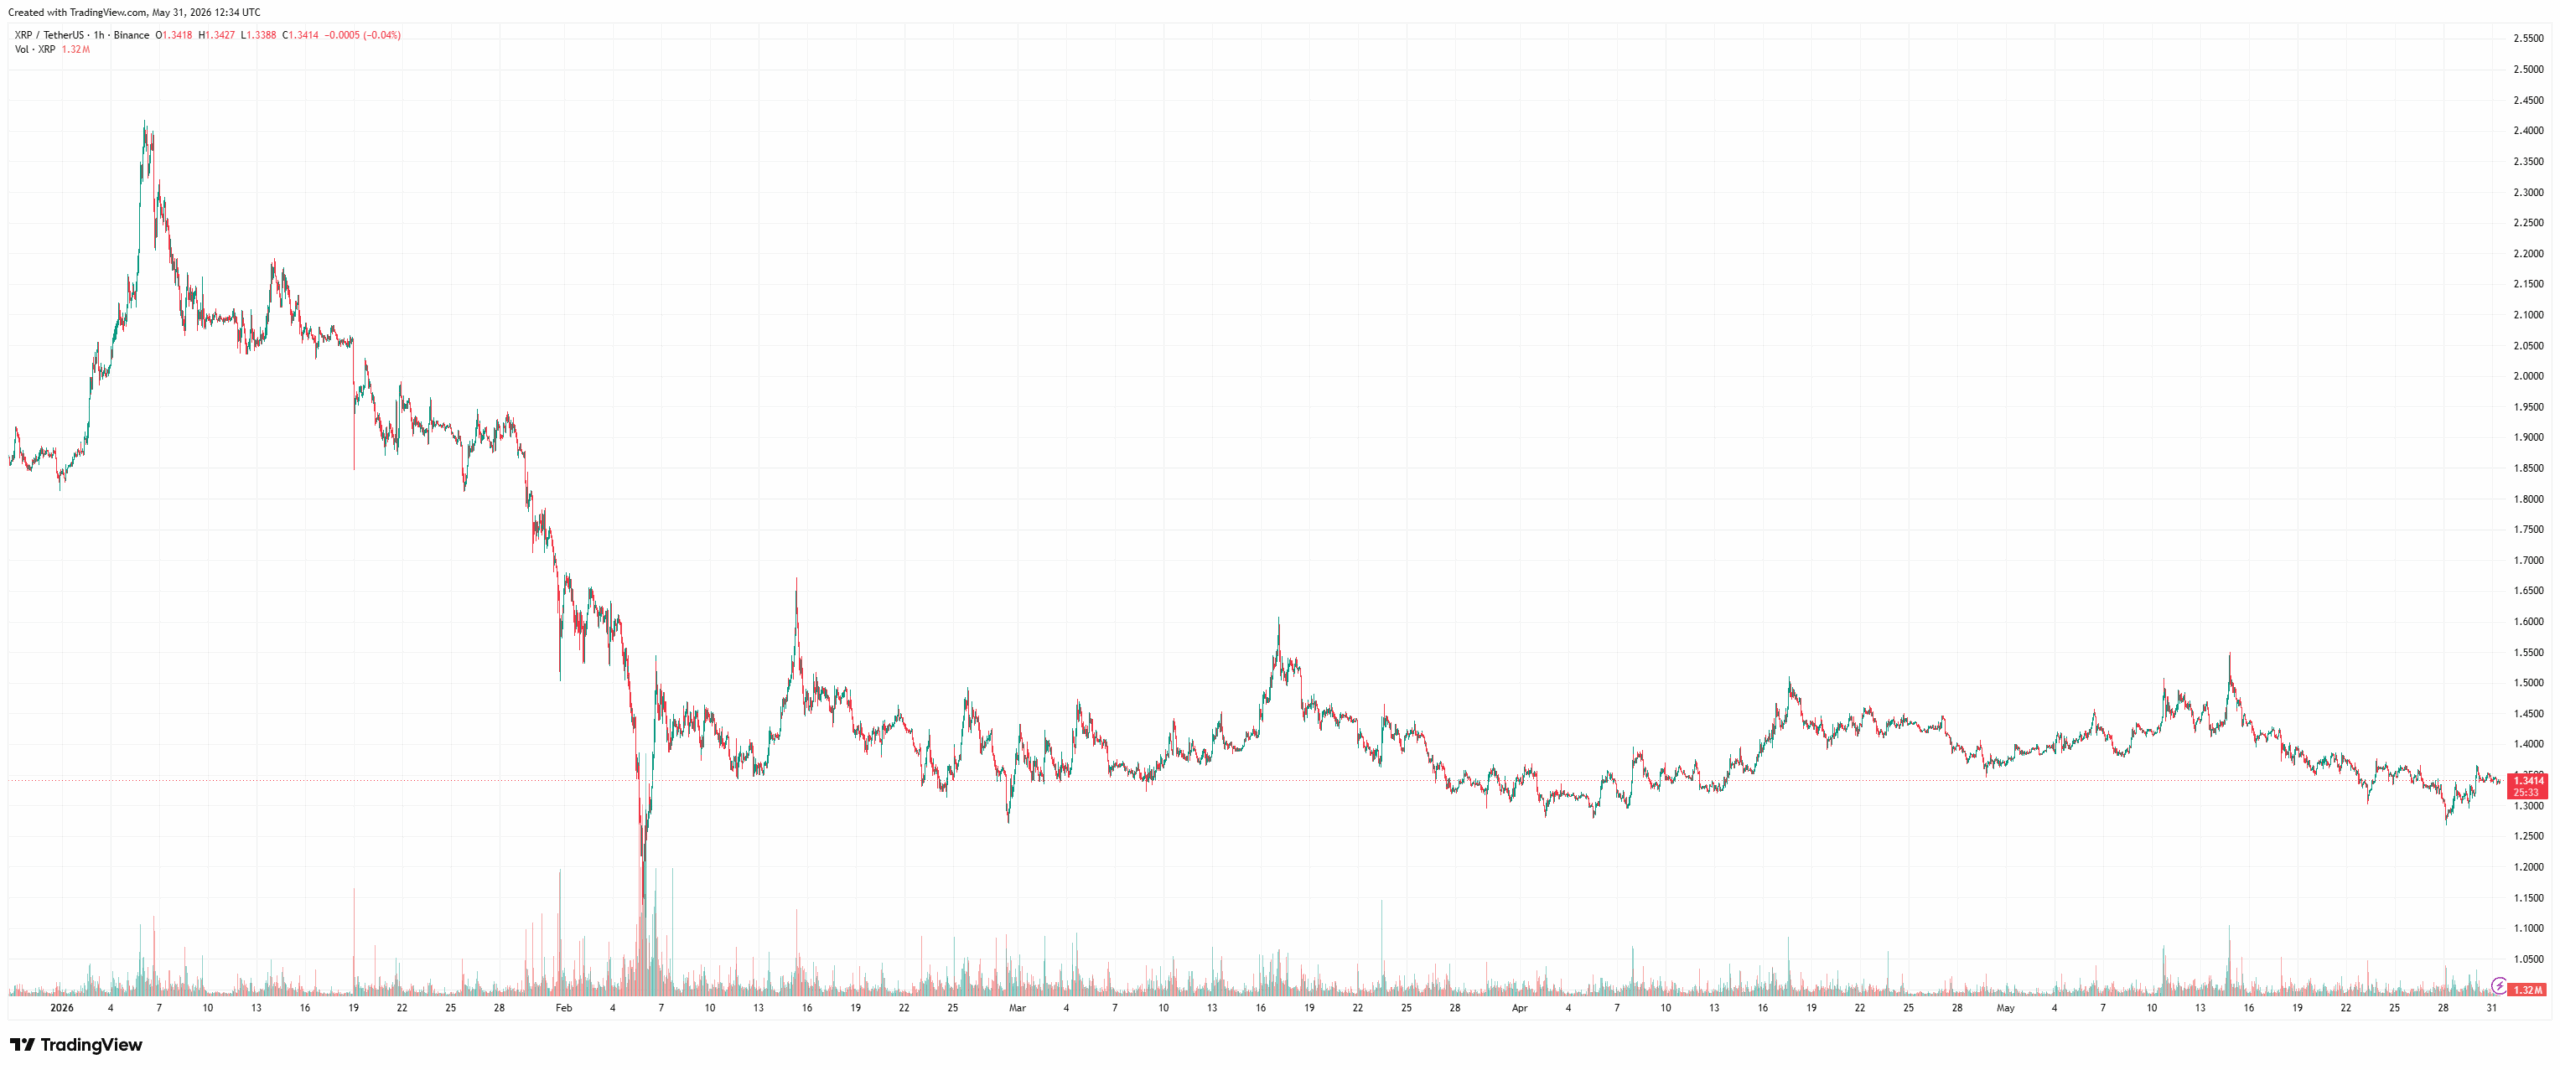
Worldcoin traded near $0.33 after earlier climbing as high as $0.38. The move followed a sharp daily rally, although the latest update showed the token had eased from its strongest level.
WLD’s 24-hour trading volume stood above $328 million, showing active market participation during the move. The token held a market cap of about $1.09 billion and ranked near the top 70 crypto assets by market value.
The price remains well below its all-time high of $11.74, reached in March 2024. It also remains down more than 70% over the past year, even after gaining more than 35% over the last 30 days.
That wider backdrop matters because the current move is still a recovery rally inside a larger downtrend. Buyers have returned in the short term, but WLD must hold key support to keep the rebound alive.
Indicators show buyers still have momentum
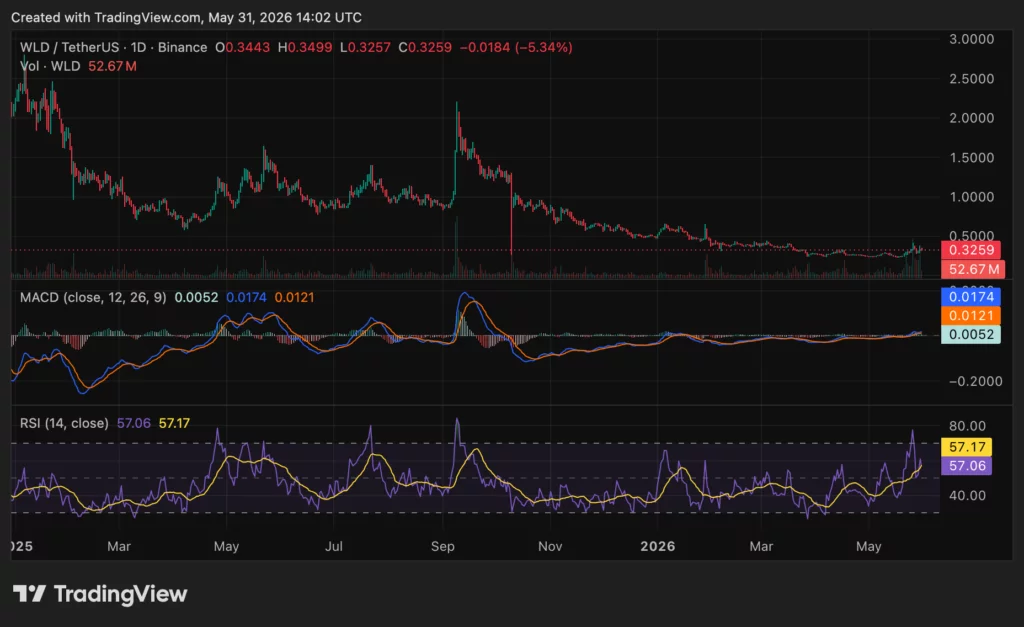
The latest chart shows WLD trying to hold above the $0.30 to $0.32 area after bouncing from the lower range. That zone now acts as the first support area for short-term traders.
Volume on the chart stood near 52.67 million WLD, showing that trading activity increased during the latest move. However, sellers stepped in after WLD approached the $0.40 to $0.45 zone.
That range now acts as near-term resistance. A stronger breakout would likely need WLD to reclaim $0.45 and then hold above $0.50.
The MACD remains bullish. The MACD line stands at 0.0174, above the signal line at 0.0121, while the histogram sits at 0.0052.
This shows that upside momentum remains active. However, the latest red candle shows that the rally has cooled after the recent surge.
Meanwhile, the RSI is at 57.06, close to its signal line at 57.17. That keeps WLD above the neutral 50 level, meaning buyers still have some control.

However, the RSI has pulled back from its recent high near overbought levels. This shows that the rally has slowed after strong early buying.
The World ID ticketing deal gives WLD a fresh real-world story. It also raises familiar questions around biometric identity, data safety and user trust.
Some traders asked whether this could be proof that crypto identity matters as bots take up more internet activity. Others focused on what could happen if biometric data or identity systems face security issues.
As previously reported by crypto.news, Worldcoin has already seen sharp narrative-driven rallies this year, including moves tied to AI, identity tools and broader interest in proof-of-human technology. Earlier reports also showed that WLD has faced criticism over token design and privacy concerns.
For now, the technical setup remains simple. WLD needs to defend $0.30 to $0.32 to keep the recovery intact. A move back above $0.40 would bring $0.45 into focus, while a clean break above $0.50 would show stronger buyer control.
XRP had a rather difficult start to 2026 from a price standpoint, but the underlying XRP Ledger showed notable signs of growth, according to the latest State of XRP report by Messari.
The analytics firm outlines a sharp contrast between the weaker market performance and strong network fundamentals, with stablecoin adoption, real-world asset tokenization, and transaction activity all increasing during the quarter.
XRP Price Falls as Trading Activity Cools
During the first quarter of the year, XRP was, for the most part, the fourth-largest non-stablecoin cryptocurrency by means of total market capitalization, trailing only Bitcoin, Ethereum, and Binance Coin.
However, the token wasn’t immune to the broader market downturn. Its market cap declined by 26% quarter-over-quarter to about $82 billion, while its price dropped by 27% to $1.34 at the time of this writing.
Per Messari’s report, trading activity also slowed down during the cited period. Average daily spot volume declined by 32%, while perpetual futures volume declined by 28.6%. That said, institutional exposure continued to build, as CryptoPotato covered recently. The quarter ended with ETFs holding about 775.4 million XRP, which is roughly 1.26% of the asset’s currently circulating supply.
XRPL Sees Growth in RWAs, Transactions, and Stablecoins
While XRP’s price struggled, XRPL activity moved in the opposite direction, supporting the case for strong fundamental support. Messari indicated that average daily transactions increased by 35% quarter-over-quarter, increasing from 1.83 million to 2.48 million.
The network also saw growing adoption across stablecoins and tokenized assets.
Ripple’s RLUSD stablecoin expanded to a market cap of $340.3 million on the XRPL by the end of the quarter, up 45% from the previous quarter. Meanwhile, XRPL’s real-world market cap soared by 124% QoQ to an all-time high of $2.25 billion.
Messari also reported that new infrastructure is being built in institutional-oriented decentralized finance. During the quarter, permissioned domains, permissioned DEX, and token escrow went live. Meanwhile, native lending protocols and asset vaults are still in voting.
All in all, these developments can be taken to suggest that XRPL’s institutional finance narratives continued to strengthen, despite the weakening price performance of XRP.
The post XRP Ledger Activity Soars in Q1 Despite XRP Price Slump: Messari appeared first on CryptoPotato.

Alfie Joey reflects on Moulin Rouge at Sunderland Empire

Stablecoin demand may soon fade, BoE’s Greene says

Trump loses it as US’s 250th Anniversary plans collapse


-

 Business7 days ago
NYT Strands Answers May 24 2026 Revealed for Puzzle No. 812 Theme Summer Essentials
-

 NewsBeat4 days ago
Israel says it has killed new Hamas military leader in Gaza City airstrikes
-

 Tech4 days ago
NASA taps Blue Origin to deliver lunar rovers for Moon Base initiative
-

 Politics6 days ago
Bridgerton Season 5: Cast, Release Date And Everything We Know So Far
-

 News Videos5 days ago
XRP *JUST* SUCCEEDED!!!! CLARITY ACT EXPOSED!!! (SHE EXPOSED IT)
-

 Sports6 days ago
2026 NBA Finals schedule, odds: Knicks await Thunder or Spurs after winning East
-
Crypto World5 days ago
Micron Crosses $1 Trillion Market Cap as AI Demand Reshapes Memory Sector
-

 Business5 days ago
Selena Gomez Reportedly Upset Over Benny Blanco’s Comments on Her ‘Terrible’ Diet
-
Crypto World7 days ago
Brian Armstrong Outlines Crypto Vision for the Future Financial System
-

 News Videos2 days ago
This is BROKEN! INSANE 5x MONEY CAR WASH WEEK! The NEW GTA Online UPDATE Today! (GTA5 New Update)
-

 Business6 days ago
BTS Sells Out Four Las Vegas Shows at Allegiant Stadium for ARIRANG World Tour
-
 Tech5 days ago
China assigns ID codes to 28,000+ humanoid robots
-
 NewsBeat6 days ago
Hottest May day ever as London hits 34.8C in 2C leap from previous records
-

 Tech6 days ago
Microsoft’s quiet Claude Code retreat and the real cost of enterprise AI
-

 Tech2 days ago
Waymo dominates autonomous vehicle registrations as Tesla trails behind
-

 Business6 days ago
Nikkei 225 Surges Past 65,000 for First Time as Iran Peace Hopes Fuel Record Rally
-
Tech4 days ago
The Samsung pay deal is the moment Korean unions changed register
-

 Tech6 days ago
Westone Audio and Etymotic Acquired by Fidelity Collective in Major IEM Market Move
-
 Entertainment6 days ago
‘Breaking Bad’ Star’s Easy-to-Binge 6-Part Crime Series Spin-Off Is Finally Heading to Free Streaming
-

 NewsBeat6 days ago
Crowds find riverside shade in York as temperatures soar
You must be logged in to post a comment Login