
Crypto World
Opening Range Breakout (ORB) Strategy Explained
The Opening Range Breakout strategy is an intraday trading approach that marks the high and low of a market’s first 5, 15, or 30 minutes of activity, then treats a candle closing above the range high or below the range low as a signal of potential directional momentum.
The first minutes after a market opens are often marked by heightened volatility, rapid price movements, and a surge in trading activity. This period reflects the reaction to overnight news, global events, and the positioning of market participants at the start of the session. These opening moves may provide a breakout trading framework that can shape trading for the rest of the day.
In this article, we examine the Opening Range Breakout strategy, a widely used approach that focuses on this critical window of market activity and its potential implications for intraday trading.
Overview of the Opening Range Breakout Trading Strategy

The ORB, or the Opening Range Breakout, is a time-tested breakout trading strategy that centres around identifying the price range established in the initial minutes of a market session. The strategy typically focuses on the price range formed within the first 5, 15, or 30 minutes after the market opens. This range forms because the market absorbs overnight news, early positioning by institutional participants, and concentrated order flow as liquidity returns at the bell.
Traders mark the highest and lowest points reached during this period as key levels. While some rely solely on this range, others also incorporate the prior day’s closing price for additional context. Traders keen on trading the open range breakout pay close attention to these high and low levels, as a breakout or breakdown from these levels can indicate a strong trend.
Variations of Opening Range Breakout
The ORB framework adapts to different timeframes, and traders often select one based on how quickly they want a signal.
- 5-minute ORB: Produces the fastest setups and is popular among scalpers, though the narrow range may increase the rate of false breakouts.
- 15-minute ORB: Balances speed and structure. The range typically captures the initial reaction to the open while filtering out the first burst of noise.
- 30-minute ORB: Produces a larger range and fewer signals per session, which some traders find cleaner for position sizing and stop placement.
Using the ORB for Stocks
Trading the Opening Range Breakout in the stock market offers distinct advantages, primarily due to the well-defined opening and closing times of the stock exchanges. These regulated timeframes provide a clear structure for implementing the ORB trading strategy. Typically, stock traders focus on the initial 5 to 30 minutes post-opening bell to define the range, as this period often captures the essence of market sentiment.
Liquidity is usually high during this time and volumes are significant. According to theory, the strategy may help traders identify trends early in the trading session. However, traders also consider the current trend. Looking for entries in the broader trend direction can reduce the odds of being misled by a false breakout.
Using the ORB for Forex
In forex, the Opening Range strategy can also be applied, albeit with some unique considerations. Unlike the stock market, forex operates 24 hours a day, five days a week, with no clearly defined opening or closing times. The ORB strategy applies the same logic to specific forex sessions. The London open breakout strategy and the New York session breakout are the two common session anchors, as both tend to produce directional moves tied to institutional order flow.
Liquidity and trading volume can vary substantially between these sessions, affecting the results of the Opening Range Breakout method. The overlap between London and New York often produces the largest ranges on major pairs, while the Asian session is believed to be quieter, which can flatten the opening range.
Additionally, it may be helpful to be aware of currency pairs; each pair may have increased activity and, therefore, potentially more reliable breakouts during the session of its originating country. Lastly, given the almost continuous trading, overnight gaps are rare, making a careful session-based approach critical for forex ORB.
Breakout Logic and Trade Structure
The opening breakout strategy is a widely used approach to take advantage of strong upward or downward movements that break the defined opening range.
Opening range breakout process traders use:
- Define the opening range (first 5–30 minutes of the session)
- Identify the range high and low
- Monitor price approaching the range boundaries
- Wait for a breakout with a candle close outside the range
- Manage the trade using predefined risk parameters
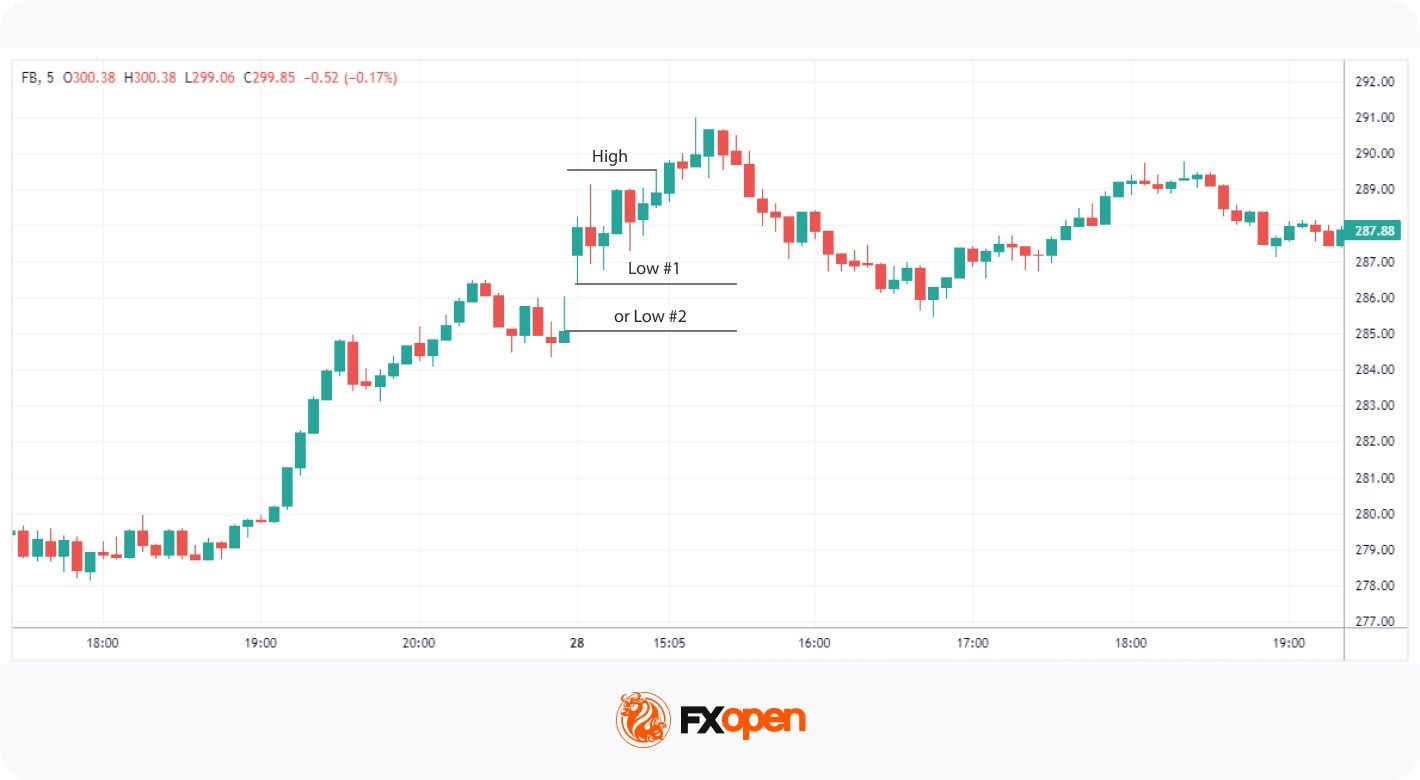
Let’s consider the Opening Range Breakout example above.
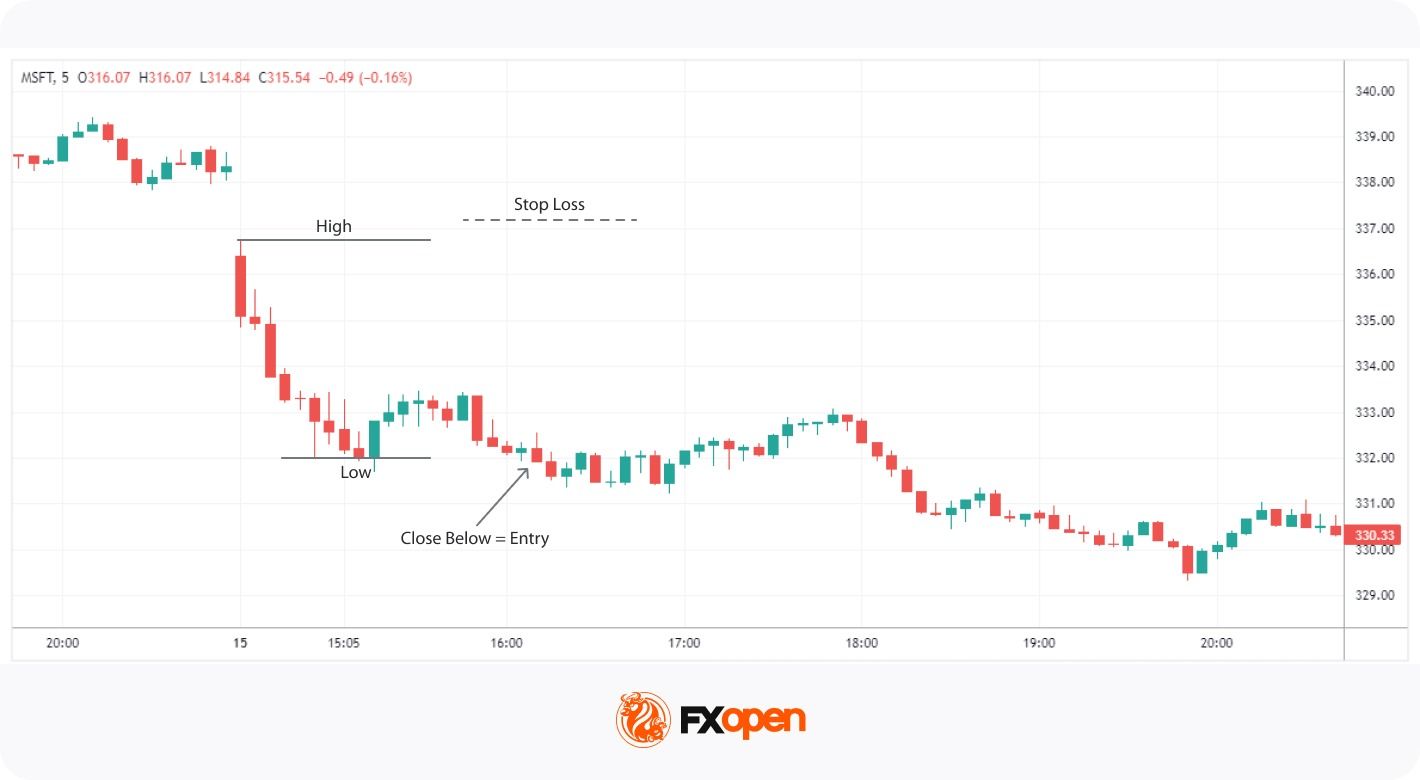
Entry
- Traders often monitor the price as it approaches the high or low of the opening range, typically using the 5, 15, and 30-minute charts. The opening range is generally defined as the first 30 minutes of the session.
- Entry confirmation typically comes from a candle closing above the high for a bullish breakout or below the low for a bearish one.
Stop Loss
- A stop loss might be set just below the opening range high for bullish trades or above the low for bearish trades. Factors like market volatility and liquidity are often taken into consideration when placing the stop loss.
Take Profit
- The profit target could be set at a distance based on risk/reward ratio, like 2:1 or 3:1.
- Traders also consider major support and resistance levels as potential take-profit levels.
To see how it works for yourself, consider heading over to FXOpen’s TickTrader trading platform. There, you’ll be able to explore a wide range of forex and stock CFDs.
Popular Practice for Trading the ORB Strategy
To improve the accuracy of the Open Range Breakout strategy, traders approach it with a disciplined and informed methodology.
Some of the Popular Practices
- Defining a Clear Opening Range: Traders often focus on the first 5, 15, or 30 minutes after the market opens to establish a trading range. Consistency in the chosen timeframe may be helpful for thoughtful analysis.
- Focusing on Liquid Markets: The ORB is usually applied to markets with high trading volumes during the opening session since these typically see more breakouts than thinly traded assets.
- Aligning with Market Trends: Breakouts that align with the broader market or news events could reduce the probability of false signals.
- Accounting for Volatility Regimes: High-volatility sessions often produce wider opening ranges and stronger follow-through once price closes outside the boundary. Low-volatility conditions tend to produce narrower ranges and a higher proportion of false breakouts, so some traders step aside or tighten filters during quieter periods.
- Incorporating Session-Specific Analysis: For forex markets, using the opening range of specific sessions (e.g., London or New York) often yields more relevant breakouts for currency pairs linked to those regions.
- Back-Testing and Optimisation: Traders typically refine their approach by back-testing the ORB trading strategy on their chosen market and timeframe.
- Using Breakout Indicators: Some traders may use Opening Range breakout indicators, such as volume or volatility measures (including VWAP and ATR), to support breakout confirmation.
Pullback Strategy
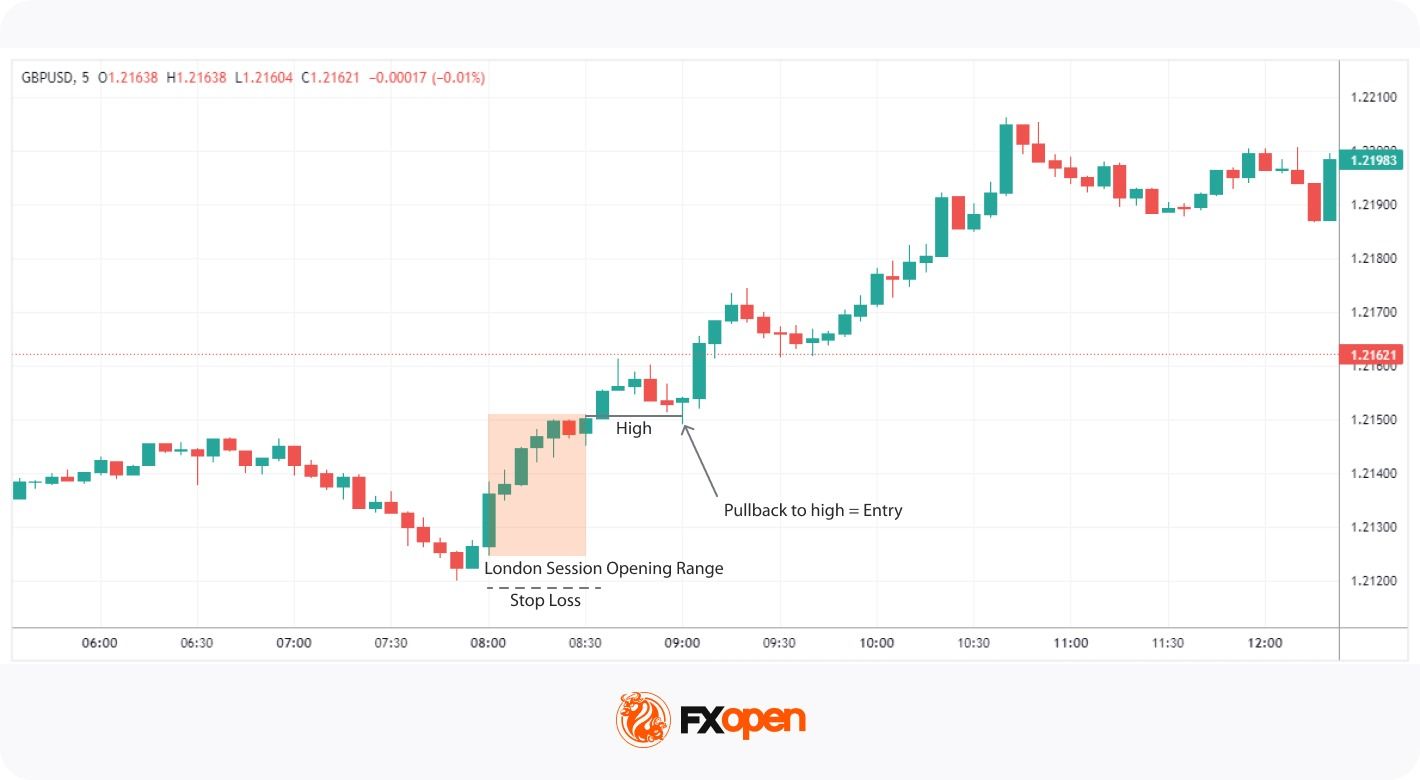
The pullback strategy within the ORB framework offers traders an alternative approach that seeks additional confirmation before initiating a trade. This strategy can be particularly useful in markets where false breakouts are common.
Entry
- Rather than entering immediately on a breakout, traders often wait for the price to break beyond the opening range and then retrace back to the high or low of that range or to a relevant support or resistance level within the range.
Stop Loss
- Stop losses could be placed a few pips below the low of the range for bullish trades or a few pips above the high for bearish trades to accommodate market noise and volatility.
Take Profit
- Profit targets could be based on a risk/reward ratio that aligns with the trader’s overall strategy.
- These targets could also be adjusted depending on subsequent support or resistance levels.
False Breakouts and Filters
The opening range in trading can see false breakouts, which happen when price pushes beyond the opening range, fails to hold, and returns inside within one or two candles. These failures often leave a long wick or a strong reversal candle on the breakout bar, signalling rejection by participants on the other side.
To maintain a level of Opening Range Breakout risk management, traders often apply simple filters:
- No close outside the range: A wick beyond the high or low without a closing print above or below counts as a test, not a breakout.
- Quick reversal back through the level: Price returning through the range within a candle or two invalidates the setup.
- Low volatility sessions: Narrow opening ranges during quiet conditions produce a higher share of fakeouts, so some traders step aside until volume returns.
Key Characteristics and Limitations of the ORB Strategy
The Opening Range Breakout strategy offers traders a systematic approach to take advantage of early market movements. While it may be a powerful tool for capturing significant price shifts, it may be important to understand its strengths and weaknesses.
Characteristics
- Early Trend Identification: The ORB may help traders spot potential trends right after the market opens, allowing for timely entry into positions.
- High Liquidity Periods: Trading during the opening range often means higher liquidity, which could lead to smoother order execution and tighter spreads.
- Risk Management Rules: The strategy provides defined entry and exit points.
- Defined Stop Placement: Stops typically sit just beyond the opposite side of the opening range. This anchors risk to session structure rather than an arbitrary pip distance.
- Versatility: Applicable to various markets like stocks and forex, the ORB can be adapted to different trading instruments and timeframes.
Limitations
- False Breakouts: The strategy is susceptible to fakeouts, where the price breaks the range but quickly reverses. The potential for losses means risk management is an important consideration for traders using the ORB strategy.
- Market Noise: High volatility during opening sessions can cause erratic price movements, making it challenging to distinguish genuine breakouts.
- Requires Quick Decision-Making: Traders need to act swiftly, which may lead to wrong decisions and additional psychological pressure.
- Not Always Reliable in All Markets: The ORB may be less reliable in markets that don’t exhibit strong opening movements or during periods of low volatility.
- Range Width and Volatility Affect Risk: Wider opening ranges translate into larger stop distances. Volatile sessions can inflate the range to a point where the resulting setup no longer fits a trader’s risk parameters, even when the breakout itself looks structurally valid.
The Bottom Line
The ORB trading strategy gives traders a structured way to trade the early part of a session across stocks and forex. Range width, session timing, and volatility conditions all shape how the setup performs on a given day.
If you want to apply the strategy across a selection of forex and stock CFD markets, you can consider opening an FXOpen account and access tight spreads and low commissions (additional fees may apply).
FAQ
What Is the Opening Range Breakout Strategy in Trading?
The Opening Range Breakout (ORB) strategy is based on the price range formed during the first minutes of a trading session, typically 5 to 30 minutes. Traders monitor the high and low of this range, as price movements beyond these levels may indicate increased volatility and potential directional momentum.
How May the ORB Strategy Be Used By Traders?
Traders typically define the opening range using short-term timeframes, such as 5-, 15-, or 30-minute charts, and monitor price action near its boundaries. Breakouts above or below the range may be considered alongside confirmation signals such as candlestick structure or volatility conditions.
What Confirms an Opening Range Breakout?
Confirmation usually comes from a candle closing outside the opening range high or low on the chosen timeframe. A wick beyond the level without a closing print is generally treated as a test rather than a breakout. Some traders add volume expansion, a move away from VWAP, or a rising ATR reading as secondary filters before acting on the signal.
What Is the 15-Minute Opening Range Breakout Strategy?
This variation uses the first 15 minutes of trading to establish the opening range. It appeals to those looking for quicker setups compared to the more traditional 30-minute range.
How May Traders Select Stocks for an ORB Strategy?
Stocks with high liquidity and strong pre-market activity are often chosen by traders for the ORB strategy. Traders may also consider stocks influenced by significant news or earnings reports, as these are likely to show volatility at the open.
What Is the Opening Range Breakout Strategy’s Success Rate?
The results of a strategy usually vary based on general factors like market conditions, timeframe, and trade execution and private factors, like trading approach, skills, and risk management. According to theory, traders often find the ORB strategy useful in volatile markets with clear trends and robust volume.
This article represents the opinion of the Companies operating under the FXOpen brand only. It is not to be construed as an offer, solicitation, or recommendation with respect to products and services provided by the Companies operating under the FXOpen brand, nor is it to be considered financial advice.

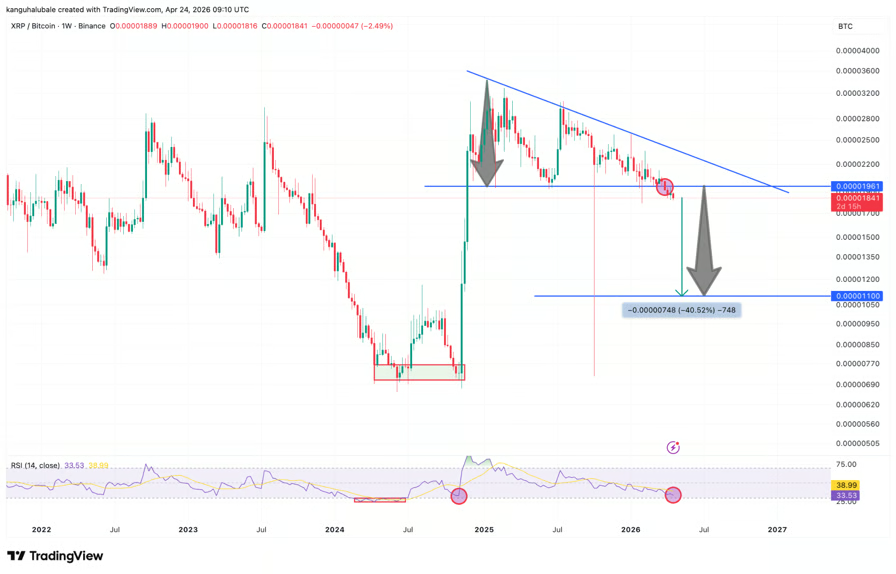
XRP (XRP) has fallen about 5% against Bitcoin (BTC) over the past week, and the confirmation of a bearish pattern now points to the risk of more losses ahead.
Key takeaways:
- XRP/BTC’s descending triangle pattern on the weekly chart points to a possible 40% drop toward 0.000011 BTC.
- Persistent institutional demand through US-based spot ETFs supports the case for a recovery in XRP price.
XRP’s descending triangle breakdown is underway
Since late 2024, the XRP/BTC ratio has been consolidating inside a descending triangle on the weekly time frame.
In technical analysis, descending triangles are typically viewed as bearish patterns. The pattern was confirmed when the price produced a weekly candlestick close below the triangle’s lower trend line at 0.000096 BTC, as shown in the chart below.
The downside target is derived by taking the height of the triangle and placing it lower from the point where the price breaks below the pattern’s lower trend line.
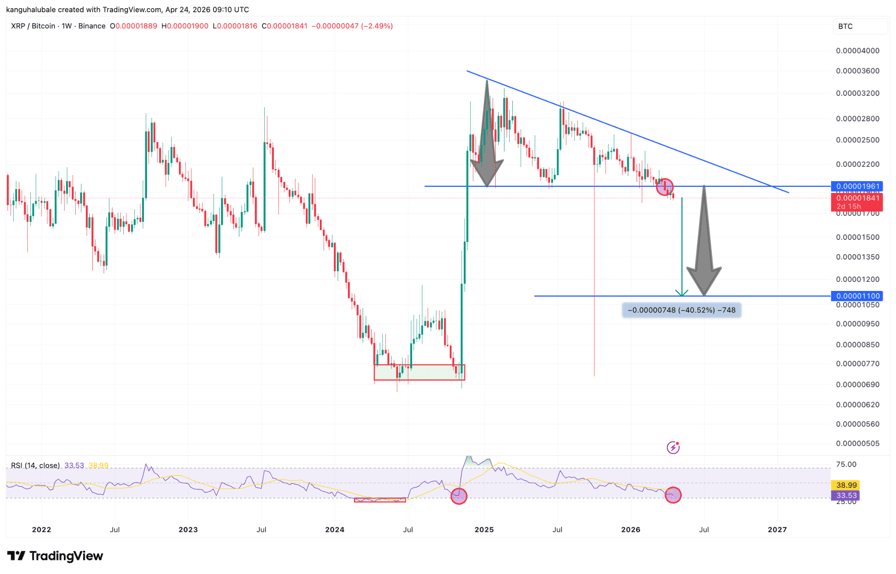
XRP/BTC weekly chart. Source: Cointelegraph/TradingView
Using that method, the XRP/BTC pair’s measured downside target comes in near 0.000011 BTC, about 40.5% below current levels.
“$XRP/BTC looks edgy,” technical analyst ChartNerd said in a recent post on X, adding that losing support at $0.000091 would lead to further losses in the XRP/BTC ratio as well as the XRP/USD pair.
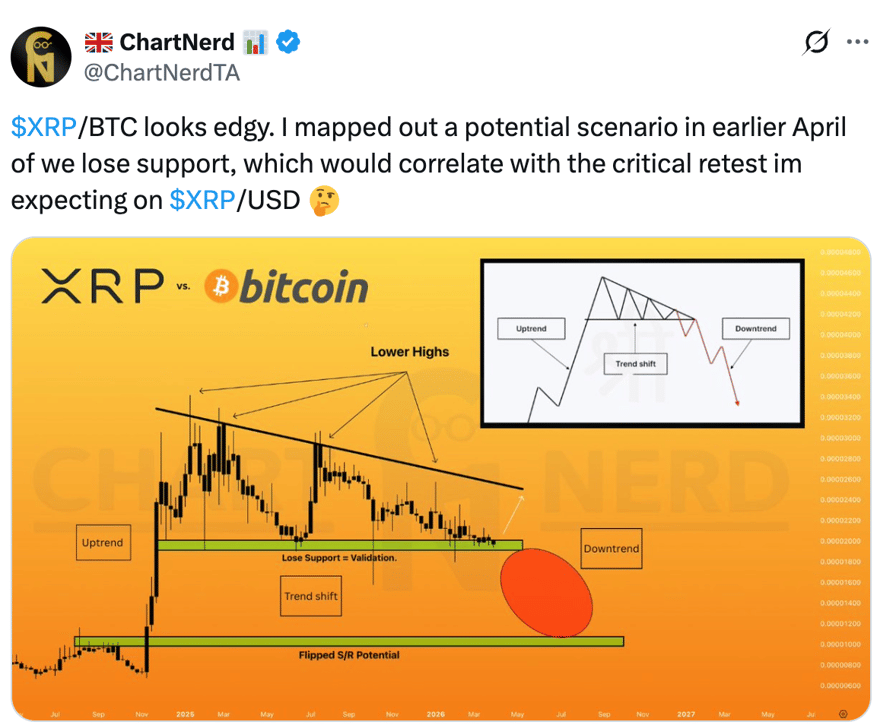
XRP/BTC weekly chart. Source: Chart Nerd
However, the RSI is near oversold at 33, levels that have previously marked macro bottoms for the ratio, as seen in mid- and late 2024. This suggests that the current downtrend could soon come to an end.
As Cointelegraph reported, a similar recovery could be seen in XRP price as several technical and onchain indicators send bottoming signals.
XRP ETF demand makes a comeback
Institutional demand for XRP investment products has been strengthening, according to data from SoSoValue.
US-based spot XRP exchange-traded funds (ETFs) posted $3.89 million in net inflows on Thursday. This marked nine consecutive days of net inflows, totaling $73.78 million. This streak has pushed cumulative inflows to nearly $1.28 billion and AUM to $1.1 billion.
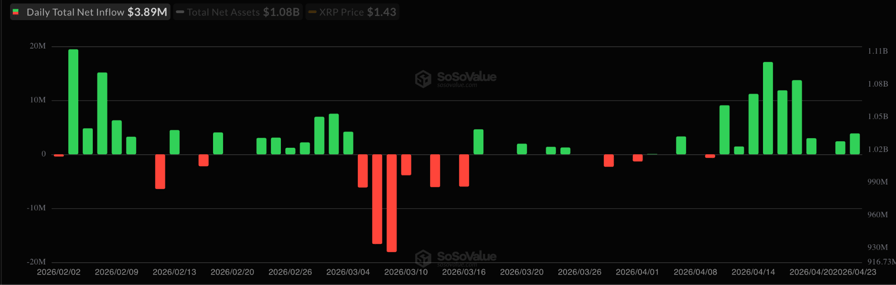
US spot XRP ETF flows chart. Source: SoSoValue
This indicates an increased institutional appetite for XRP products, despite the price declining 22% in 2026 and lagging against Bitcoin.
“$XRP ETF inflows continue,” analyst Don Digital Finance said in a Friday X post.
It signals “steady institutional demand as accumulation continues despite sideways price action,” the analyst added.
“Institutional demand is rising fast as big money continues flowing into XRP exposure,” fellow analyst Ledger Man said, adding:
“This could be a major signal that confidence in XRP is growing stronger than ever.”
Crypto World
Janice McAfee Announces The John McPepe Launch Party Featuring An Elite Line Up Of Musicians, Artists, and Freedom Fighters.. April 29th In Las Vegas

The John McPepe meme coin project has officially announced their launch party in Las Vegas, marking a historic intersection of internet meme culture and the defiant legacy of JOHN MCAFEE. The launch is planned for April 29th with a series of events in Las Vegas, including Afroman, Shooter McGavin, Riff Raff, Bobby Shmurda, and many more!
John McPepe serves as a tribute to the spirit of freedom and technical sovereignty championed by JOHN MCAFEE. By merging the iconic imagery of Pepe the Frog with MCAFEE’s history, the project creates a unique cultural movement for those who value privacy and the “Freedom Fighter” ethos.
The launch event will include a high profile exhibition that merges the JOHN MCAFEE legacy with the elite tier of internet meme art. Featuring over a dozen original works from the world’s top Pepe artists, the launch establishes a new cultural landmark for the intersection of digital art and technical defiance.
PREMIER OF JOHN MCPEPE MOVIE TRAILER
In addition to the art showcase, the project has confirmed the upcoming release of a full length John McPepe movie, scheduled to premiere in theaters in June 2026. The film will provide an immersive look into the lore, philosophy, energy, and history of the movement.
A New Era of Digital Culture
The Las Vegas launch event marks the beginning of a massive summer for the project.
“We are bringing together the greatest artists in this culture to tell a story that needs to be heard,” the team from McPepe said. “Between the Las Vegas exhibition and the full length film coming in June, we are ensuring the JOHN MCAFEE legacy is captured with the intensity and creativity it deserves.”
About John McPepe
John McPepe is a digital culture project dedicated to promote the legacy of John MCAFEE. By collaborating with world class artists and producing original cinematic content, the project serves as a hub for freedod focused art and media.
Mcpepe.com
https://t.me/johnmcpepe
https://x.com/mcpepewtf
Disclaimer: This is a Press Release provided by a third party who is responsible for the content. Please conduct your own research before taking any action based on the content.

Crypto World
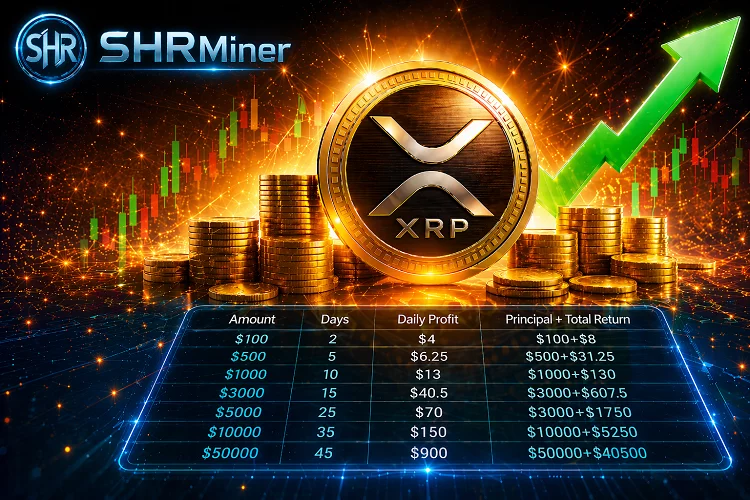
SHR Miner cloud mining platform offers crypto participants a new path to easily earn $13,500 in returns
Disclosure: This article does not represent investment advice. The content and materials featured on this page are for educational purposes only.
XRP price trends draw investor focus as SHR Miner expands cloud mining access in the digital asset market.
Summary
- SHRMiner offers structured cloud mining with flexible contracts and support for BTC, XRP, ETH, and DOGE.
- Operating in 180+ countries, SHRMiner uses renewable energy and no-hardware mining for easy user access.
- SHRMiner combines UK licensing, McAfee, and Cloudflare-backed security to provide compliant cloud mining services.
With the price movements of Bitcoin and Ethereum influencing the overall market, XRP trend prediction continues to attract investor attention, and SHR Miner is entering the digital asset market with its structured cloud mining model.

The trajectory of the cryptocurrency market is often closely intertwined with overall market sentiment. Macroeconomic shifts, industry news, institutional capital flows, and regulatory policies all influence investor confidence in digital assets. As a key market bellwether, Bitcoin’s performance typically drives broader market movements, while Ethereum’s trajectory serves as a crucial reference point for investors seeking to gauge market enthusiasm.
XRP, as one of the mainstream currencies, continues to receive market attention due to its application value in fast payments and enterprise-level transaction scenarios. Its predicted trends depend not only on its own ecosystem development, technological progress, and regulatory clarity, but also on the cycles of Bitcoin, Ethereum, and the overall cryptocurrency market.
When market sentiment is bullish, major assets like XRP tend to attract capital more readily; conversely, when market uncertainty intensifies, investors typically adopt a cautious stance. Consequently, avenues for generating stable returns have become a form of investment that many investors are now actively and urgently seeking.
Against this backdrop, SHR Miner, with its regulated framework and compliant, transparent cloud mining services, provides users with an efficient way to participate in the cryptocurrency market and explore stable yield opportunities in new cryptocurrencies within a rapidly changing industry environment.
SHRMiner cloud mining service becomes a new path for cryptocurrency participation
SHR Miner positions cloud mining as an opportunity to explore, rather than a strategy that promises returns. The platform emphasizes regulatory compliance, transparency, ease of use, and alignment with prevailing market conditions. This makes it an ideal choice for users seeking opportunities for stable returns during periods of market volatility.
Why SHR Miner offers a competitive advantage
SHR Miner stands as a leading global platform for cloud mining services. Headquartered in the UK, the company has been dedicated — since its inception in 2018 — to providing secure, efficient, and scalable cloud mining services to over 5 million users across more than 180 countries.
The platform’s data centers are strategically located in regions abundant in renewable energy resources, utilizing solar, hydroelectric, and wind power to ensure low-carbon operations. The platform offers flexible short-term smart contracts, stable revenue mechanisms, and versatile payment channels supporting multiple cryptocurrencies. This enables users to participate in mining effortlessly, without the need for specialized hardware or technical expertise.
Core platform advantages
- Zero Entry Barrier: The platform is designed for user convenience. No complicated operation, hardware configuration, or professional background knowledge is required. Users simply need to select an AI strategy, configure their risk parameters, and activate the contract.
- Compliance and Bank-Grade Security: In the cryptocurrency landscape — often characterized by regulatory gray areas and frequent cyberattacks — SHRMiner holds an operational license issued in the UK. The platform’s dual-layer security architecture is certified by McAfee® and Cloudflare®, ensuring that user funds remain safeguarded against external threats.
- Multi-Currency Mining Support: While BTC and XRP serve as the primary currencies, the smart contracts also support a range of other assets — including ETH, DOGE, SOL, USDC, and USDT — thereby enabling diversified portfolio hedging.
How to explore daily earning opportunities with SHR Miner? Earn $13,500?
1. Create an Account: Visit the official website to complete your registration and receive $15 in free hash rate. Claim a daily reward of $0.60.
2. Configure a computing power plan: Based on needs and participation goals, select a suitable contract from the cloud computing power plans offered by the platform and complete the activation to start cloud mining services.
3. Receive daily earnings: After the user activates the contract, the earnings will be automatically credited to your account daily.
SHRMiner offers a variety of contract options to meet the needs of different levels of participation and investment objectives:
SHRMiner combines market volatility with cloud mining opportunities
The cryptocurrency market is inherently volatile, a characteristic that often fuels increased interest in structured participation models. Discussions regarding XRP price predictions frequently intensify in tandem with fluctuations in Bitcoin’s price, underscoring the market’s sensitivity. Cloud mining offers users a method to engage in cryptocurrency activities without the need for frequent trading, thereby providing an opportunity for stable returns — even amidst market volatility.
SHRMiner supports this approach by offering flexible contract options, enabling participants to adapt their strategies in response to evolving market trends.
Conclusion: Explore daily XRP income opportunities with SHRMiner
As technology, regulatory frameworks, and market sentiment continue to reshape the cryptocurrency landscape, predictive trends for XRP will inevitably remain fluid, shifting alongside broader market conditions. As core reference assets within the market, Bitcoin and Ethereum will also continue to influence investor sentiment regarding mainstream digital assets. Against this backdrop, SHRMiner — through its cloud mining services — offers users a more convenient and systematic avenue for participating in the cryptocurrency space.
For more platform information, service details, and cloud mining solutions, visit the official SHR Miner website or contact the official team directly via the official email: [email protected]
Disclosure: This content is provided by a third party. Neither crypto.news nor the author of this article endorses any product mentioned on this page. Users should conduct their own research before taking any action related to the company.

Wisconsin’s lawsuit against Kalshi, Robinhood, Coinbase, Polymarket and Crypto.com deepens the battle between state gambling enforcers and federal regulators over sports prediction markets.

The Tempo blockchain that Stripe built to outperform Bitcoin’s capacity of five transactions per second (TPS) is publishing less than three.
Seven months ago, Stripe pitched its new blockchain on the premise that existing blockchains had insufficient capacity for its institutional payment flows.
Bitcoin (BTC) miners have added about 160 million transactions over the past 12 months, averaging 5.1 TPS, a number that Tempo’s capacity would dwarf, CEO Patrick Collison claimed in September.
Collison also bragged that Tempo would have capacity for 10,000 TPS, levitating Tempo’s theoretical future high above Bitcoin.
Unfortunately, there are now real-world numbers to settle theoretical capacities with on-chain transactions.
Tempo’s actual usage per Token Terminal and the company’s own Dune analytics is approximately 2.5 TPS.
Bitcoin publishes five TPS.
The underperforming blockchain raised $500 million at a $5 billion valuation in October 2025 from Thrive Capital, GreenOaks, Sequoia, Ribbit, and SV Angel. Its mainnet went live on March 18.
Paradigm, in addition to Stripe, helped develop Tempo. In fact, Paradigm co-founder Matt Huang runs Tempo as its CEO.
Read more: DeFi plays the blame game
The numbers after five weeks
Now five weeks into mainnet operation, Tempo reported approximately 5,600 daily active users. The chain generated a whopping $205 in fees over 24 hours and held $3 million worth of crypto in total value locked.
Ethereum, in contrast, generated $1.4 million in fees and $45 billion in total value locked.
Tempo’s on-chain decline is visible everywhere on its dashboards.
- Daily new wallets using Tempo peaked at 7,629 on March 19, 2026, and sat at just 1,749 as of April 21, a 77% drop.
- Daily contract deployments peaked at 3,060 on April 14 and fell to 863 a week later, down 72%.
- Daily token transfer volume peaked above $9 million on March 17, and it now runs two-thirds less.
- Tempo’s stablecoin DEX cleared just $56,000 in 24-hour volume on Tuesday, a figure 95% below its peak and less than 0.001% of global DEX volumes. Tempo’s DEX would need a ten thousandth decimal point to register a single natural number.
- Tempo’s daily DEX trades sum to less than 2,000 these days, down 77% from the March 20 peak above 18,000. Daily DEX volume on Tempo peaked at $1.1 million and has fallen 93% since.
Got a tip? Send us an email securely via Protos Leaks. For more informed news, follow us on X, Bluesky, and Google News, or subscribe to our YouTube channel.
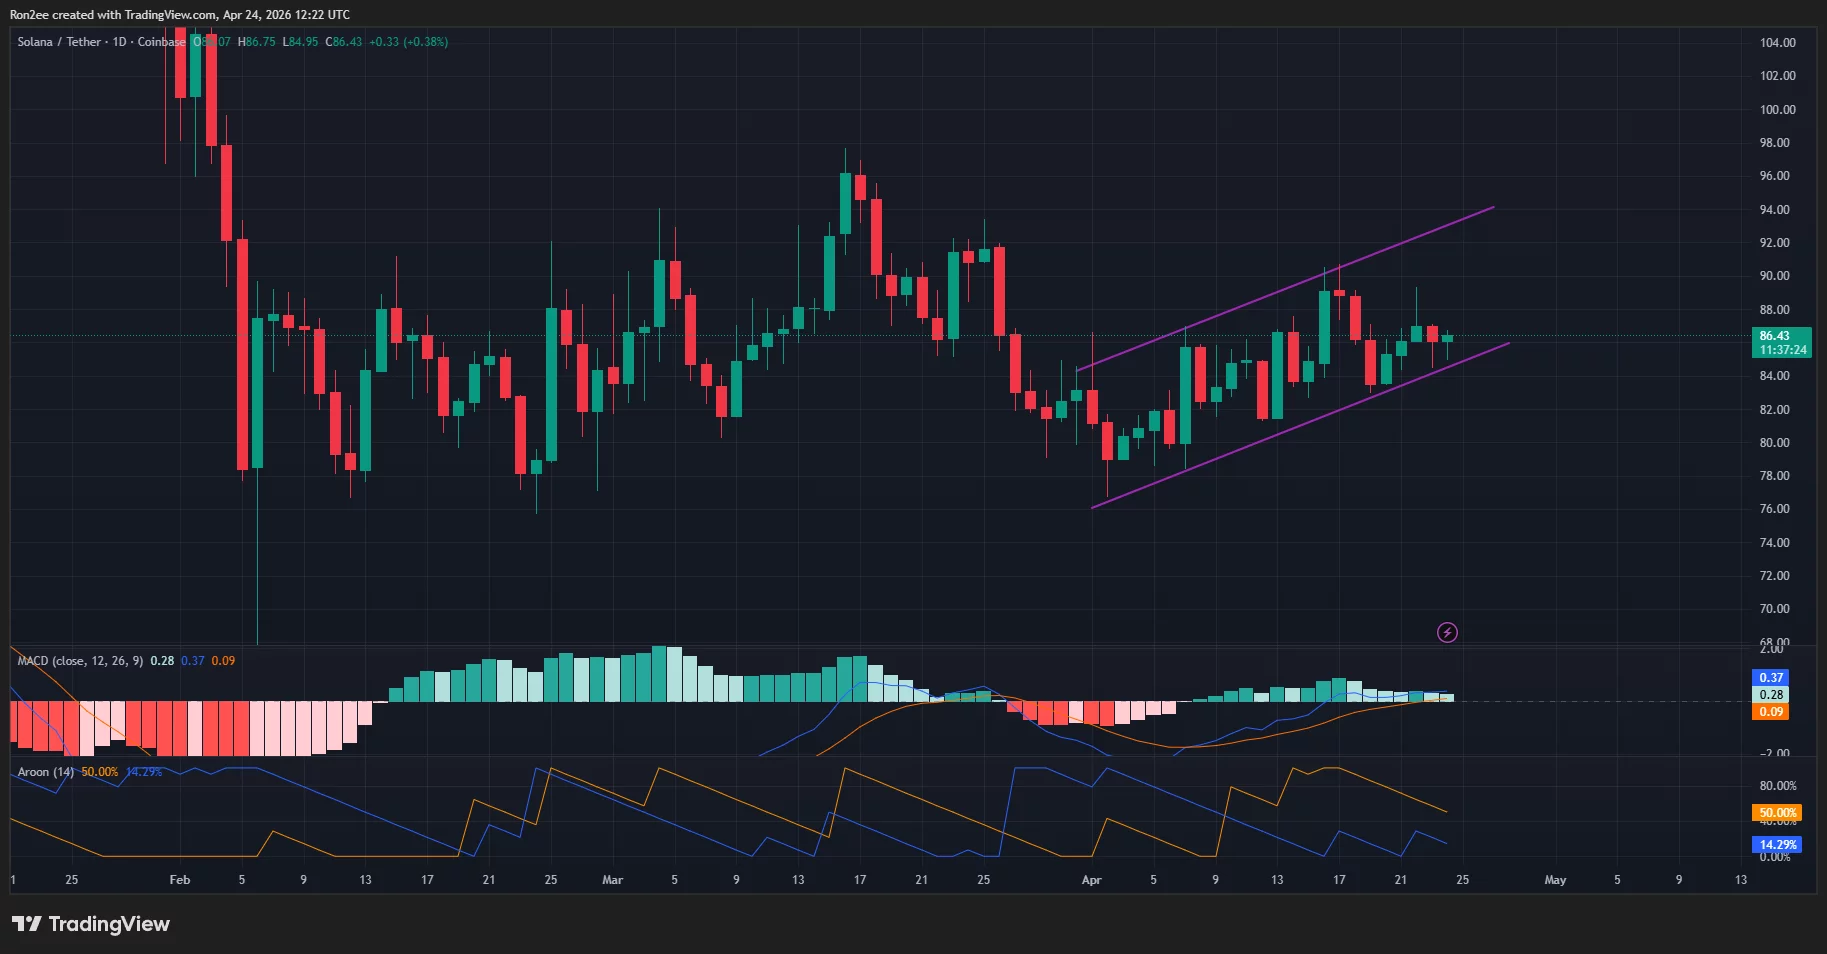
Solana is trading within an ascending channel, with $90 capping its upside over the past week and acting as a key breakout level.
Summary
- Solana trades within an ascending channel, with $90 acting as a key resistance level that has capped upside for nearly a week.
- Price has stabilized in the $85–$86 range after dropping from $89, while technical indicators point to building bullish momentum.
- A breakout above $90 could open upside toward $94–$96, while rejection may lead to a retest of the $80 support zone.
According to data from crypto.news, Solana (SOL) dropped from its Wednesday high of $89 to $85 on Thursday. The token has since stabilized and has been trading within a tight range of $85–$86 as bulls fail to reclaim the $90 resistance level for nearly a week.
Despite recent weakness, technical indicators suggest that Solana price is well-positioned to surge past $90 in the coming sessions.
On the daily chart, Solana price has formed an ascending channel pattern, marked by higher lows and higher highs. The pattern signals a steady accumulation trend where buyers step in at increasingly higher levels.

In Solana’s case, the lower boundary of the channel sits near the $78–$80 zone, which has acted as strong support, while the upper boundary continues to converge toward the $90 resistance area.
Momentum indicators also seem to support a gradual….to the bulls. The MACD histogram has turned positive, with the signal line crossing above the MACD line. At the same time, the Aroon indicator shows the Aroon Up trending higher while Aroon Down remains subdued, a sign that buying pressure is starting to dominate over sellers.
Hence, if Solana price manages a decisive breakout above the $90 resistance level, it could confirm the continuation of the ascending channel and open the door for further upside toward the $94–$96 region, where the next supply zone remains visible.
However, failure to break above the $90 resistance could keep the price confined within the channel, with a potential retest of the $80 support level if selling pressure increases.
Disclosure: This article does not represent investment advice. The content and materials featured on this page are for educational purposes only.

Metaplanet, a Tokyo-listed firm, has issued 8 billion Japanese yen in zero-interest ordinary bonds to EVO FUND, earmarking the proceeds for additional Bitcoin purchases, according to a Thursday filing. The bonds constitute the 20th series in Metaplanet’s ongoing program and mature in April 2027; they are unsecured, extending the company’s use of capital markets to expand what is already one of the largest corporate Bitcoin treasuries.
Under the terms disclosed, the bonds will be redeemed at par at maturity, with EVO FUND allowed to request early redemption with five business days’ notice. Metaplanet may also redeem part or all of the bonds if it completes future financings with the same investor. EVO FUND, a Cayman-based fund at the core of Evolution Financial Group, specializes in structured financings for digital-asset companies and is identified as the main subscriber to Metaplanet’s zero-interest bonds used for Bitcoin purchases.
The financing moves fit within Metaplanet’s broader Treasury-First approach, where the company leans on capital markets to grow its Bitcoin holdings rather than relying solely on operating cash flow. In the first quarter, Metaplanet disclosed it added 5,075 BTC, lifting its total to about 40,177 BTC and reinforcing its position as the third-largest publicly listed Bitcoin holder.
Market observers noted the development against a backdrop of volatility for crypto assets. Bitcoin has traded near $77,000 in recent sessions, while Metaplanet’s stock was down roughly 3.7% at the time of writing, according to Yahoo Finance data. The issuance also aligns Metaplanet with a broader narrative of publicly traded entities pursuing Bitcoin exposure through debt-financed buybacks and treasury management, a path that has drawn comparisons to a U.S. counterpart widely associated with similar balance-sheet strategies.
Key takeaways
- Metaplanet raises 8 billion JPY in zero‑interest ordinary bonds to fund more Bitcoin purchases; the issue is the 20th in its series and matures in April 2027.
- The bonds are unsecured and redeemable at par at maturity; EVO FUND can request early redemption with five business days’ notice; Metaplanet may redeem if it completes additional financings with the same investor.
- EVO FUND, a Cayman-based fund central to Evolution Financial Group, is the main subscriber backing Metaplanet’s zero-interest issuance for Bitcoin accumulation.
- The deal reinforces Metaplanet’s debt-fueled treasury expansion strategy, signaling ongoing capital-market activity beyond ordinary operating cash flow.
- Metaplanet’s Bitcoin holdings rose to about 40,177 BTC in Q1, cementing its place as the third-largest publicly listed Bitcoin holder; market reaction included a share-price dip alongside a BTC price around $77,000.
Debt-funded expansion of a Bitcoin treasury
The latest bond issuance underscores a deliberate, ongoing strategy: to grow a sizable BTC reserve by tapping structured finance channels rather than relying solely on cash generated from business operations. EVO FUND’s role as the primary subscriber highlights a specialized financing relationship that aligns the interests of a crypto-focused fund with a corporate treasuring approach. This arrangement allows Metaplanet to deploy capital for Bitcoin accumulation while keeping the terms of the financing relatively straightforward—zero coupon, par redemption at maturity, and potential early redemption tied to the investor’s options.
In the Japanese market context, Metaplanet’s approach sits alongside other Asian-listed entities that have pursued Bitcoin exposure through varied financing structures. The company’s Q1 update, which recorded a significant BTC addition, reinforces its place among a growing cohort of publicly traded firms seeking to diversify treasuries with Bitcoin as a potential long-hold asset. While the macro environment remains volatile, the accumulation pace suggests management continues to view Bitcoin as a strategic reserve rather than a tradeable instrument.
Bond terms, investor role, and financial impact
From a structural standpoint, the bonds’ terms are straightforward: redeemable at par at maturity, with EVO FUND entitled to request early redemption after five business days’ notice. Metaplanet reserves the right to redeem all or part of the issue if it completes future financings with the same investor. Such provisions provide a transparent mechanism for liquidity management and potential reassessment of the financing arrangement as the company’s Bitcoin treasury evolves.
The company described the bond sale as unlikely to meaningfully affect consolidated results for fiscal 2026. However, it noted that if the issuance or related activities yield any material financial impact, Metaplanet would provide an update. This stance reflects a cautious balance between pursuing aggressive Bitcoin accumulation and maintaining visibility over reported earnings and capital structure.
Market context and what comes next
Metaplanet’s ongoing financing approach mirrors a well-known pattern in the sector: using equity and debt markets to scale a Bitcoin treasury. The dynamic has drawn frequent comparisons to MicroStrategy’s balance-sheet framework, illustrating a broader, cross-regional strategy of corporate treasury management in the crypto era. For investors, the key question is how such financings influence risk, balance-sheet resilience, and long-term exposure to Bitcoin’s price trajectory, particularly as macro conditions and regulatory scrutiny evolve.
Looking ahead, observers will watch whether Metaplanet continues to tap similar financing arrangements with EVO FUND or opens access to new partners as its Bitcoin holdings climb. The durability of this approach will depend on market liquidity for the bonds, Bitcoin’s price path, and any regulatory shifts in Japan or globally that could affect corporate treasury strategies in crypto assets.
In the meantime, Metaplanet’s latest filing reinforces a concrete, ongoing effort to grow a substantial Bitcoin reserve, using structured funding to support asset accumulation while maintaining a disciplined approach to debt and liquidity. The balance between aggressive accumulation and financial prudence will be the story to watch as the year unfolds.
Readers should keep an eye on any subsequent filings or disclosures that detail the ongoing impact of these issuances on Metaplanet’s earnings, as well as the evolution of its Bitcoin holdings in the context of a fluctuating crypto market.
References and related coverage: According to the filing, Metaplanet issued 8 billion JPY in zero-interest bonds to EVO FUND; the company’s Q1 update noted an addition of 5,075 BTC to bring holdings to about 40,177 BTC. EVO FUND is a Cayman-based fund central to Evolution Financial Group; market data cited by Yahoo Finance shows the stock price movement around the issue date. For broader context on similar treasury strategies, see prior coverage comparing such approaches to notable U.S. benchmarks in the sector.

Key Highlights
- First-quarter earnings decreased 6% year-over-year to $752 million (50 cents per share) versus $797 million in the prior year
- Geopolitical tensions in the Middle East compelled operational pullbacks in several nations
- Quarterly revenue climbed 2.7% to $8.72 billion, surpassing Wall Street projections of $8.63 billion
- Adjusted earnings per share reached 52 cents, marginally exceeding the 51-cent analyst consensus
- Adjusted EBITDA contracted 12% to $1.77 billion; company withheld annual guidance
Shares of SLB tumbled 3.7% during Friday’s premarket session following the oilfield services provider’s announcement of diminished first-quarter earnings, as escalating Middle East tensions significantly disrupted business activities.
Chief Executive Olivier Le Peuch characterized the period as “a challenging start to the year,” noting that customer-directed demobilizations were implemented to safeguard workers and infrastructure across multiple territories.
Quarterly net earnings slipped 6% compared to the same period last year, settling at $752 million, equivalent to 50 cents per diluted share. This marked a decline from the $797 million, or 58 cents per share, recorded in the first quarter of 2025.
When adjusted for one-time items, earnings per share registered at 52 cents—narrowly surpassing the Street’s 51-cent projection, based on FactSet consensus data.
The company’s top line expanded 2.7% to $8.72 billion, outperforming analyst expectations of $8.63 billion. Despite the revenue upside, investor focus shifted to profitability concerns.
Adjusted EBITDA tumbled 12% to $1.77 billion, a metric widely viewed as the primary catalyst behind the premarket selloff.
Regional Performance: North America Strength Versus International Weakness
Revenue from North American operations surged 26% to $2.17 billion, delivering a notable bright spot amid broader headwinds.
Conversely, international revenue declined 3.8% to $6.47 billion—a direct consequence of Middle East-related operational disruptions affecting the company’s expansive global presence.
Management indicated that the well construction and reservoir performance segments bore the brunt of conflict-driven challenges.
SLB opted not to provide full-year financial projections. However, the firm reiterated its 2026 capital expenditure plan of $2.5 billion, representing a modest increase from the $2.4 billion deployed in 2025.
Leadership Anticipates Industry Rebound by 2027
Le Peuch noted that ongoing regional instability has “accelerated” the global rebalancing of liquid hydrocarbon supply and demand dynamics while highlighting critical weaknesses in energy infrastructure resilience.
He anticipates that nations will shift focus toward supply chain diversification and domestic resource cultivation once geopolitical stability returns.
The CEO also projected increased capital allocation toward short-cycle drilling programs across North America and Latin America, alongside expanded deepwater offshore initiatives.
“Absent a prolonged conflict leading to an economic slowdown and demand destruction, these supply responses reinforce our conviction of a broad-based recovery in upstream markets in 2027 and 2028,” he said.
Earlier this year in January, SLB had indicated that regional challenges were subsiding. Friday’s quarterly report painted a contrasting picture.
Premarket trading showed shares changing hands at $52.70, representing a decline from Thursday’s closing price.


Pi Network’s PI token (PI) has remained under pressure even as several major cryptocurrencies recovered over the past week.
Summary
- Almost 3 million PI tokens moved to centralized exchanges, raising short-term selling concerns.
- Nearly 200 million PI tokens are scheduled to unlock over the next 30 days.
- Pi Network’s Protocol 22 deadline and smart contract updates remain key ecosystem events.
Bitcoin and other large assets gained after easing geopolitical concerns, but PI fell by about 4% during the same period.
The token’s market capitalization has dropped to around $1.75 billion. That is far below the nearly $20 billion level reached in February last year, showing that PI has not recovered from its earlier decline.
The weak price action comes despite new ecosystem updates from the Pi Network team. The project has continued to expand smart contract tools and prepare nodes for a key protocol deadline.
Exchange inflows raise selling concerns
On-chain data shows that almost 3 million PI tokens moved from self-custody wallets to centralized platforms in the past 24 hours. The total PI balance on exchanges has now reached nearly 508 million coins.
Large exchange inflows often raise selling concerns because holders may be preparing to trade or exit positions. This does not confirm a sell-off, but it adds pressure during a weak market phase.
PI also faces heavy token unlocks over the next 30 days. Nearly 200 million coins are scheduled for release, with May 1 expected to bring the largest daily unlock of 20.9 million tokens.
Protocol 22 deadline nears
Pi Network has kept protocol upgrades at the center of its April update cycle. A PiCoreTeam notice referenced by Coindar said Mainnet nodes must upgrade to Protocol 22 by April 27 to “remain connected to the network.”
Community members said the upgrade “ensures network stability and paves the way for full smart contract functionality.” The deadline keeps attention on node readiness as Pi continues to work toward broader network utility.
In its Pi Day 2026 update, the team said Mainnet and Testnet2 moved through v19.6 on February 15, v19.9 on March 1, and v20.2 on March 13. These updates formed part of the groundwork for smart contract features.
Smart contract tools expand on Testnet
On April 17, Pi Network introduced subscription smart contract capability on Testnet. The team said the tool can support recurring blockchain-based services and business models.
Pi described the update as part of its push toward “real, recurring, utility-driven” use cases. The feature may support future apps that need repeated payments or service access inside the Pi ecosystem.
The project will also appear at Consensus 2026, where its co-founders are expected to discuss utility and digital identity.
Disclosure: This article does not represent investment advice. The content and materials featured on this page are for educational purposes only.
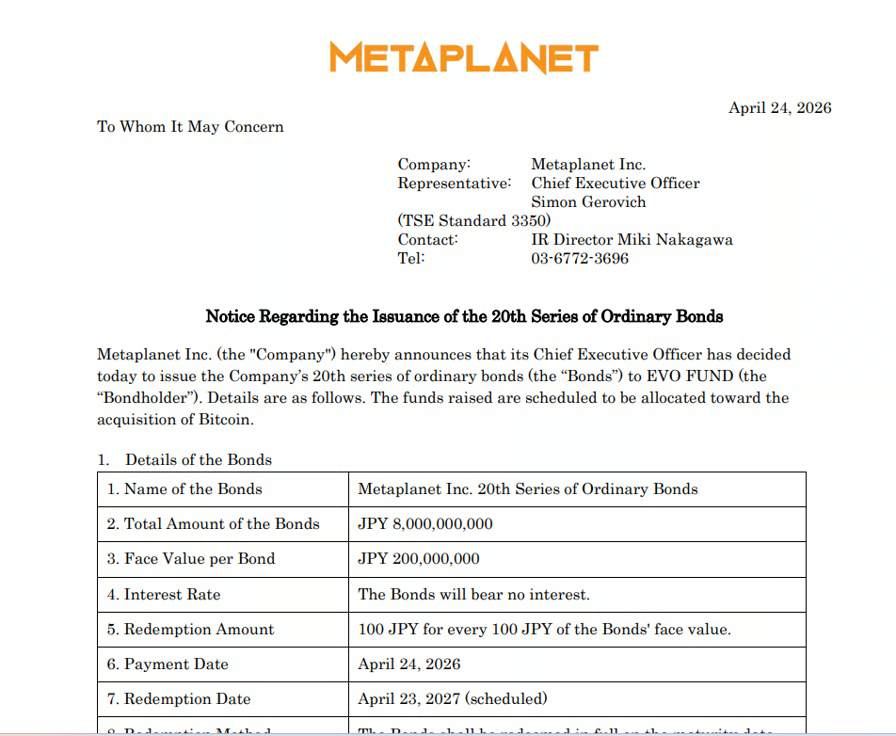
Tokyo-listed Metaplanet has issued 8 billion Japanese yen ($50 million) in zero-interest bonds to EVO FUND, with the proceeds earmarked for additional Bitcoin purchases, according to a Thursday filing.
According to the filing, the 20th series of ordinary bonds matures in April 2027 and is unsecured, giving Metaplanet another source of zero-interest funding as it expands one of the largest corporate Bitcoin treasuries in the market.
EVO FUND, a Cayman-based fund at the core of Evolution Financial Group, specializes in structured financings for digital asset-focused companies and is the main subscriber to Metaplanet’s zero-interest bonds used to fund Bitcoin purchases.
Under the terms of the deal, the bonds will be redeemed at par on maturity, though EVO FUND can request early redemption with five business days’ notice. Metaplanet may also redeem part or all of the bonds if it completes future financings with the same investor.
Related: Nakamoto sells $20 million in Bitcoin and cuts Metaplanet stake
The latest raise extends a financing strategy Metaplanet has used repeatedly as it leans further into its Bitcoin treasury model, tapping capital markets rather than relying solely on operating cash flow.
Metaplanet’s share price was down around 3.69% at the time of writing, according to data from Yahoo! Finance.
Metaplanet expands Bitcoin holdings with debt-funded strategy
The latest raise follows an aggressive first quarter in which Metaplanet added 5,075 BTC, lifting its total holdings to about 40,177 BTC and cementing its position as the third-largest publicly listed Bitcoin holder.
Metaplanet Issues $50 million in 0% Ordinary Bonds to Purchase Additional $BTC. Source: Metaplanet
That expansion has made the company one of the clearer examples in Asia of a public firm using debt and equity financing to accumulate Bitcoin as a treasury asset, drawing frequent comparisons to MicroStrategy’s balance sheet strategy in the United States.
With the new issuance, Metaplanet is signaling that it intends to keep buying even after a volatile stretch for crypto markets, with BTC trading around $77,000 in recent sessions.
The company said in the filing that the bond sale is expected to have only a minimal impact on its consolidated results for fiscal 2026, and that, if “any material impact” on its financial performance or other matters arises, it will provide an update promptly.
Magazine: AI-driven hacks could kill DeFi — unless projects act now
XRP Risks 40% Dip Versus Bitcoin Despite Persistent ETF Inflows

Unite officers strike next week against union boss Graham

RCB vs GT LIVE Score, IPL 2026: Virat Kohli On Cusp Of Multiple Records As RCB Bid Farewell To Chinnaswamy
Manchester United reach agreement with Casemiro over contract clause amid transfer speculation

US brings back mandatory military draft registration

Steven Gerrard disagrees with Gary Neville over ‘shock’ Chelsea and Arsenal claim | Football

Financial education kya hai #shorts #youtubeshorts #finance #share #money #financial education

No More Real-Money Games: India’s New Online Gaming Rules | Ankit Agrawal Study IQ

They F*cking Hate Each Other | Financial Audit
-

 Fashion7 days ago
Weekend Open Thread: Theodora Dress
-

 Politics7 days ago
Palestine barred from entering Canada for FIFA Congress
-

 Business5 days ago
Powerball Result April 18, 2026: No Jackpot Winner in Powerball Draw: $75 Million Rolls Over
-
Entertainment5 days ago
NBA Analyst Charles Barkley Chimes in on Ice Spice McDonald’s Fiasco
-

 Tech5 days ago
Auto Enthusiast Scores Running Tesla Model 3 for Two Grand and Turns It Into Bare-Bones Go-Kart
-

 Politics5 days ago
Zack Polanski demands ‘council homes not luxury flats for foreign investors’
-

 Crypto World7 days ago
Russia Pushes Bill to Criminalize Unregistered Crypto Services
-

 Politics4 days ago
Gary Stevenson delivers timely reminder to register to vote as deadline TODAY
-

 Business2 days ago
Rolls-Royce Voted UK’s Most Iconic Trade Mark as IPO Register Hits 150
-

 Politics2 days ago
Disabled people challenge government SEND proposals over segregation concerns
-

 Politics2 days ago
Making troops accountable for war crimes threatens US alliance, ex-SAS colonel warns
-

 Crypto World7 days ago
Russia Introduces Bill To Criminalize Unregistered Crypto Services
-

 Politics2 days ago
Starmer handler McSweeney to be dragged from shadows by Foreign Affairs Committee
-
Politics2 days ago
Wings Over Scotland | How To Get Away With Crimes
-

 Politics2 days ago
Zack Polanski responds to home secretary’s taser threat
-
Crypto World5 days ago
Kelp DAO rsETH Bridge Hack Drains $292M as DeFi Losses Top $600M in Two Weeks
-

 Politics2 days ago
‘Iran is still a nuclear threat’
-

 Crypto World3 days ago
New York sues Coinbase, Gemini over prediction market offerings
-

 Business2 days ago
The Job Benefits Most Men Don’t Know to Negotiate
-

 Crypto World3 hours ago
Michael Saylor says BTC winter is over. Market analyst disagrees, says bitcoin was in a pullback
You must be logged in to post a comment Login