
Crypto World
Pennant Pattern in Trading: Identification and Breakout Strategy

The pennant pattern is a continuation chart formation frequently observed in forex and CFD markets during periods of strong directional momentum. It develops after a sharp price movement followed by a brief consolidation phase, reflecting temporary equilibrium before potential trend continuation.
Unlike reversal patterns, a pennant forms within an existing trend structure and is commonly used by traders to analyse breakout conditions, organise entry planning, and define risk parameters using measurable price projections. The pattern’s compact structure allows market participants to evaluate volatility contraction and subsequent expansion within a clearly defined technical framework.
This article examines how bullish and bearish pennant patterns are identified across different market environments, how breakout scenarios are evaluated step by step, how price targets are derived using the flagpole measurement method, and how false breakouts can be filtered through confirmation techniques and professional trading tools.
Key Takeaways for Professional Traders
- A pennant is a continuation chart pattern in forex, equity, commodity, and crypto* markets. It’s formed during volatility contraction.
- Breakout confirmation requires volume expansion.
- Targets are typically projected using flagpole measurement.
- The pattern is more popular in trending, high-momentum markets.
What Are Pennant Chart Patterns?
A pennant pattern is a short-term continuation chart formation that develops after a sharp directional price move and signals a potential breakout in the direction of the prevailing trend. The pennant pattern’s structure is:
- Flagpole — a strong impulsive move driven by momentum and liquidity imbalance.
- Consolidation phase — price compresses within converging trendlines.
- Breakout — volatility expansion as price exits the pattern in the direction of the prior trend. The breakout should be accompanied with high volumes.
Pennants reflect a pause in momentum rather than a structural reversal.
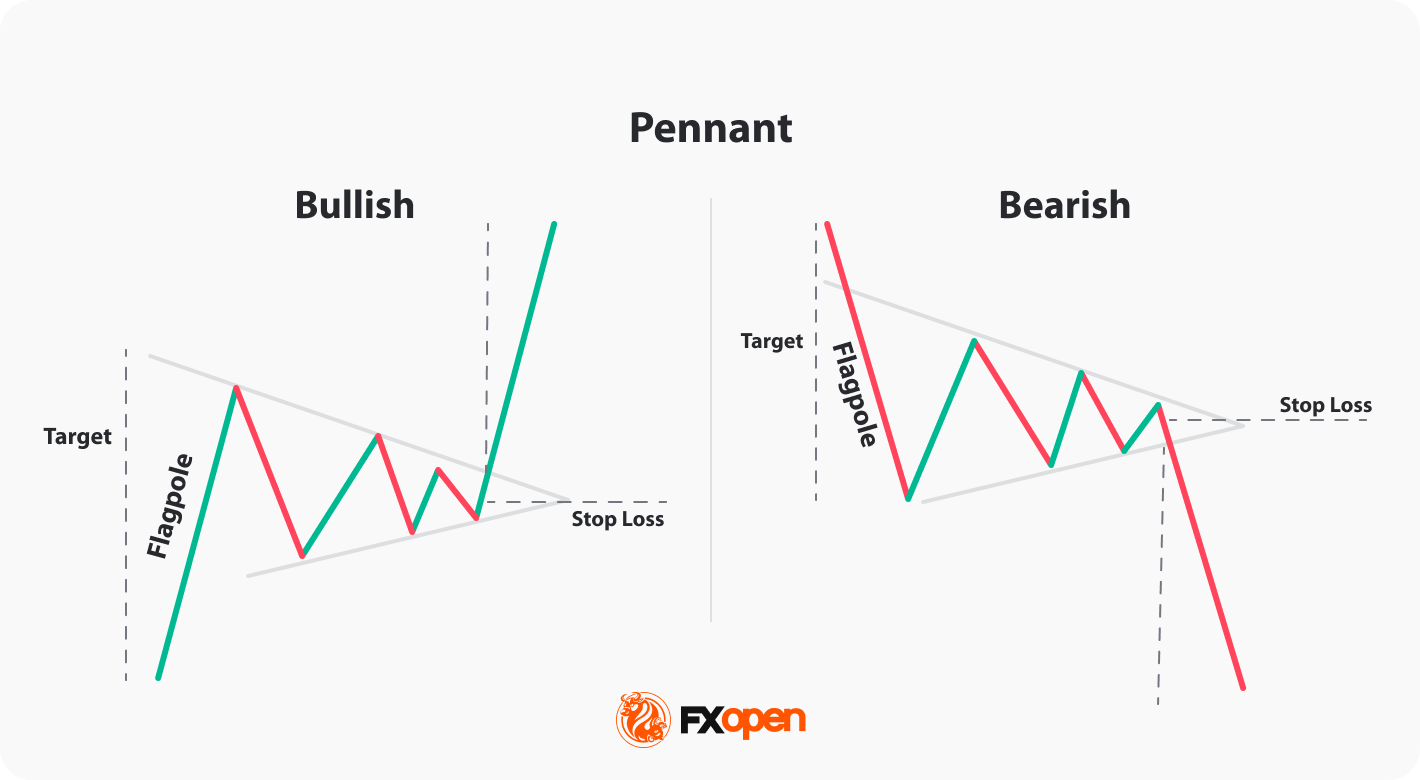
Bullish Pennant Pattern
A bullish pennant pattern forms after a strong upward impulse. The consolidation appears as a small symmetrical triangle sloping slightly against the prior trend. A breakout above the upper boundary signals potential continuation higher.
This setup frequently appears in trending currency pairs such as EUR/USD during macro-driven momentum phases.
Bearish Pennant Pattern
A bearish pennant develops after a sharp decline. Price consolidates within converging trendlines before breaking below the lower boundary, indicating further downside continuation.
In high-volatility markets such as cryptocurrencies*, bearish pennant trading setups often form during strong sentiment-driven selloffs.
How Pennant Patterns Form in Live Forex & CFD Markets
In real market environments, pennants often develop during:
- Central bank policy decisions
- Important macroeconomic data releases
- Institutional repositioning
- Liquidity imbalances
The initial impulse creates directional imbalance. During consolidation, volatility contracts and volume typically declines. As price compresses, stop orders accumulate outside the structure. The breakout phase triggers these orders, accelerating momentum through volatility expansion.
This contraction-to-expansion transition is the core edge of pennant trading strategies.
Pennant Pattern Checklist for Traders
- Strong flagpole (impulsive move)
- Tight symmetrical consolidation
- Declining volume during compression
- Volume confirmation breakout
- Breakout aligned with higher timeframe trend
How Traders Identify and Trade a Pennant Pattern (Step-by-Step)
Identifying a valid pennant pattern requires precision. Not every consolidation qualifies.
If you would like to find the formations yourself, consider using the TickTrader trading platform with over 700 instruments and 1200 trading tools.
Step 1: Identify a Strong Flagpole
A valid pennant begins with a sharp, one-sided move supported by expanding momentum.
Without a strong flagpole, the pattern loses statistical edge.
Step 2: Confirm Tight Consolidation
Characteristics:
- Decreasing volatility
- Converging trendlines
- Shallow retracement (ideally <50–60% of flagpole)
Step 3: Wait for a Confirmed Breakout
Breakout should:
- Close decisively beyond upper/lower boundary
- Align with higher timeframe direction
- Show strong momentum expansion
Traders avoid entering inside the pattern. The setup becomes valid only after confirmed breakout structure not to be trapped by false breakouts.
Breakouts during major news events may cause slippage and spread widening.
Step 4: Apply Entry Techniques
Professional traders typically choose between:
- Momentum entry (enter immediately after breakout close)
- Retest entry (wait for pullback to broken boundary). Retest entries might improve risk-to-reward ratio.
Step 5: Use Pennant Pattern Target Calculation
Use the flagpole projection method:
- Measure the length of the flagpole
- Project it from breakout point
Alternative targets:
- Key support/resistance
- Fibonacci extensions
- Fixed risk-reward ratios (1:2 or 1:3)
Step 6: Implement Pennant Pattern Stop-Loss Placement and Risk Management
Common stop-loss placements:
- Beyond opposite pennant boundary
- Below/above recent swing point
Additional risk management considerations:
- Minimum risk-to-reward ratio (e.g., 1:2)
- Trailing stop adjustments after breakout confirmation
- Limit exposure across correlated instruments
When Traders Avoid Trading Pennant Patterns
Traders don’t trade if:
- Retracement exceeds 60%
- Breakout lacks momentum
- Higher timeframe contradicts setup
- Major resistance/support sits inside projected target
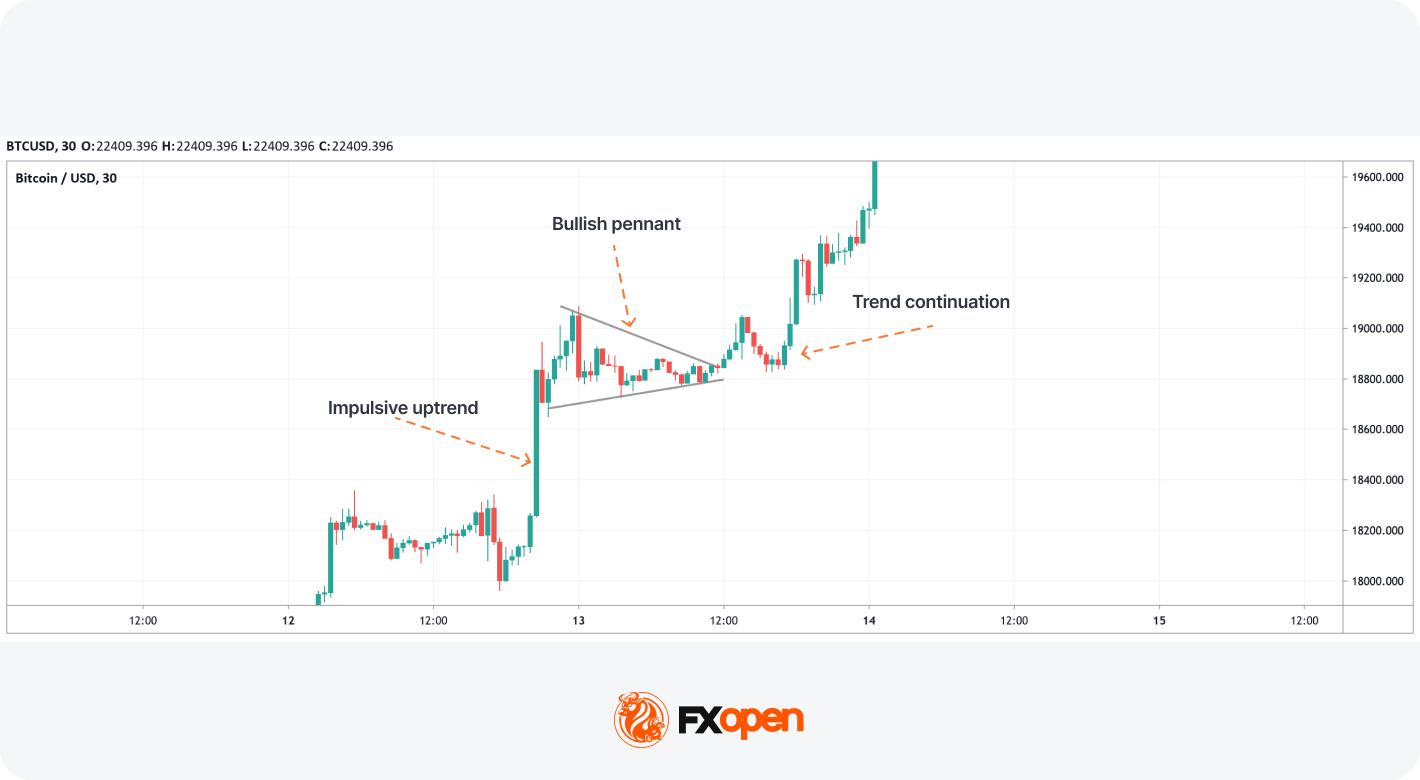
Case Study: Bullish Pennant Breakout Strategy
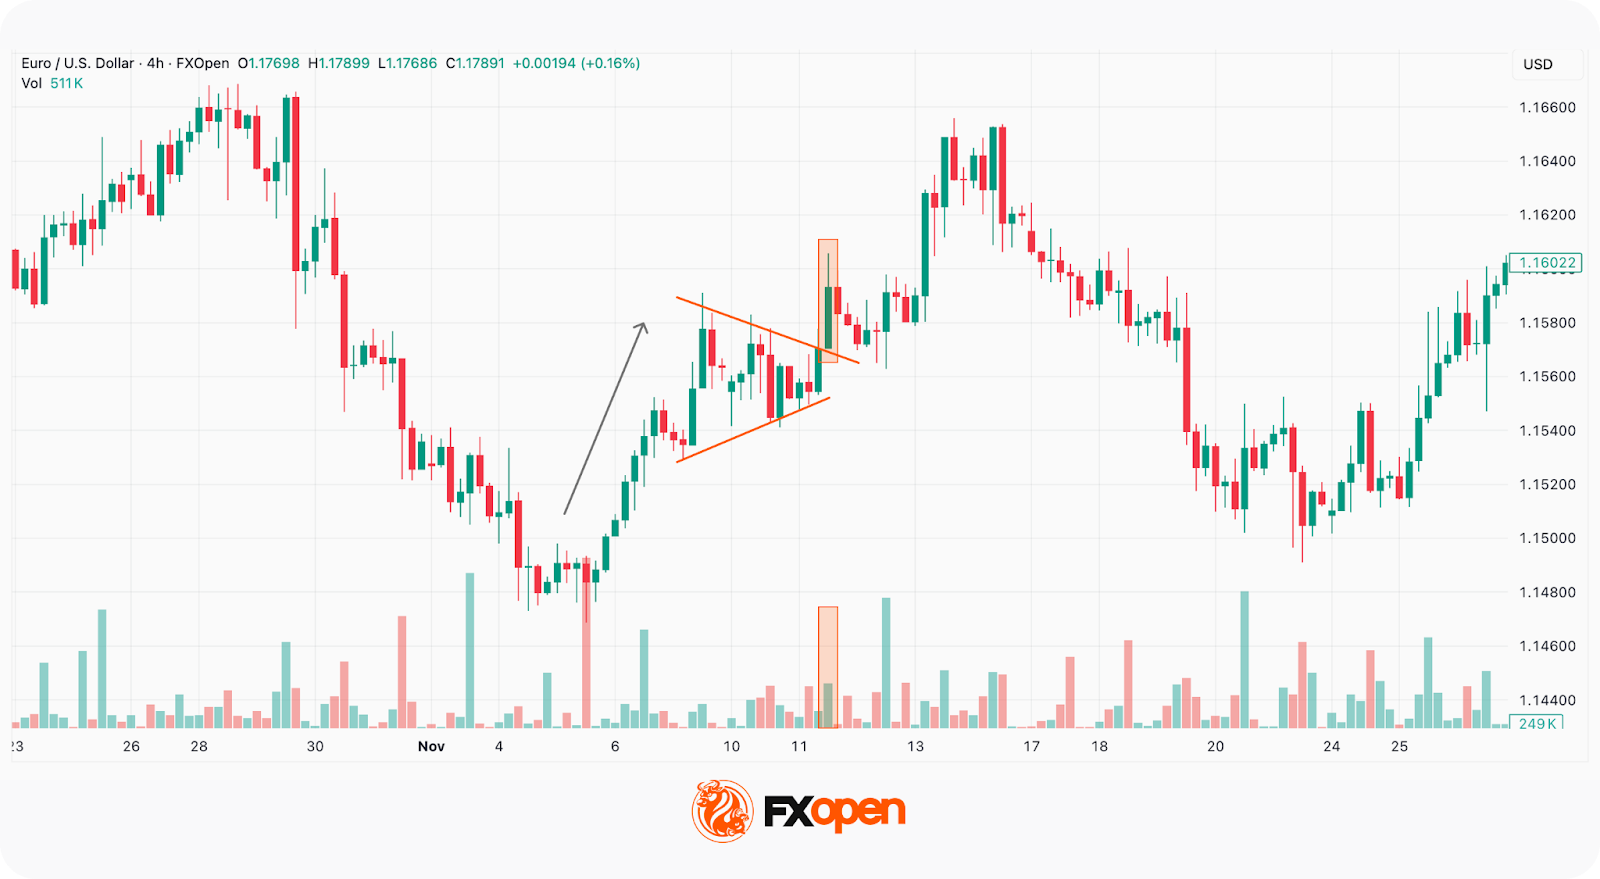
To understand how a pennant pattern works in live market conditions, let’s examine a structured bullish breakout example on EUR/USD.
Market Context
The downtrend reversed with a solid upward momentum. Although there was no confirmation on a higher timeframe, traders could consider trading the pennant pattern.
A strong, impulsive bullish move developed over two days with large-bodied candles and no pullbacks. This created the flagpole, establishing directional bias.
Following the impulse, the price entered a tight consolidation, with converging trendlines forming and momentum temporarily pausing. This compression phase lasted for several days.
The breakout occurred in the direction of the prior trend with a strong bullish candle close.
Aggressive traders could enter on a breakout close. Conservative traders could wait for a retest of the broken resistance.
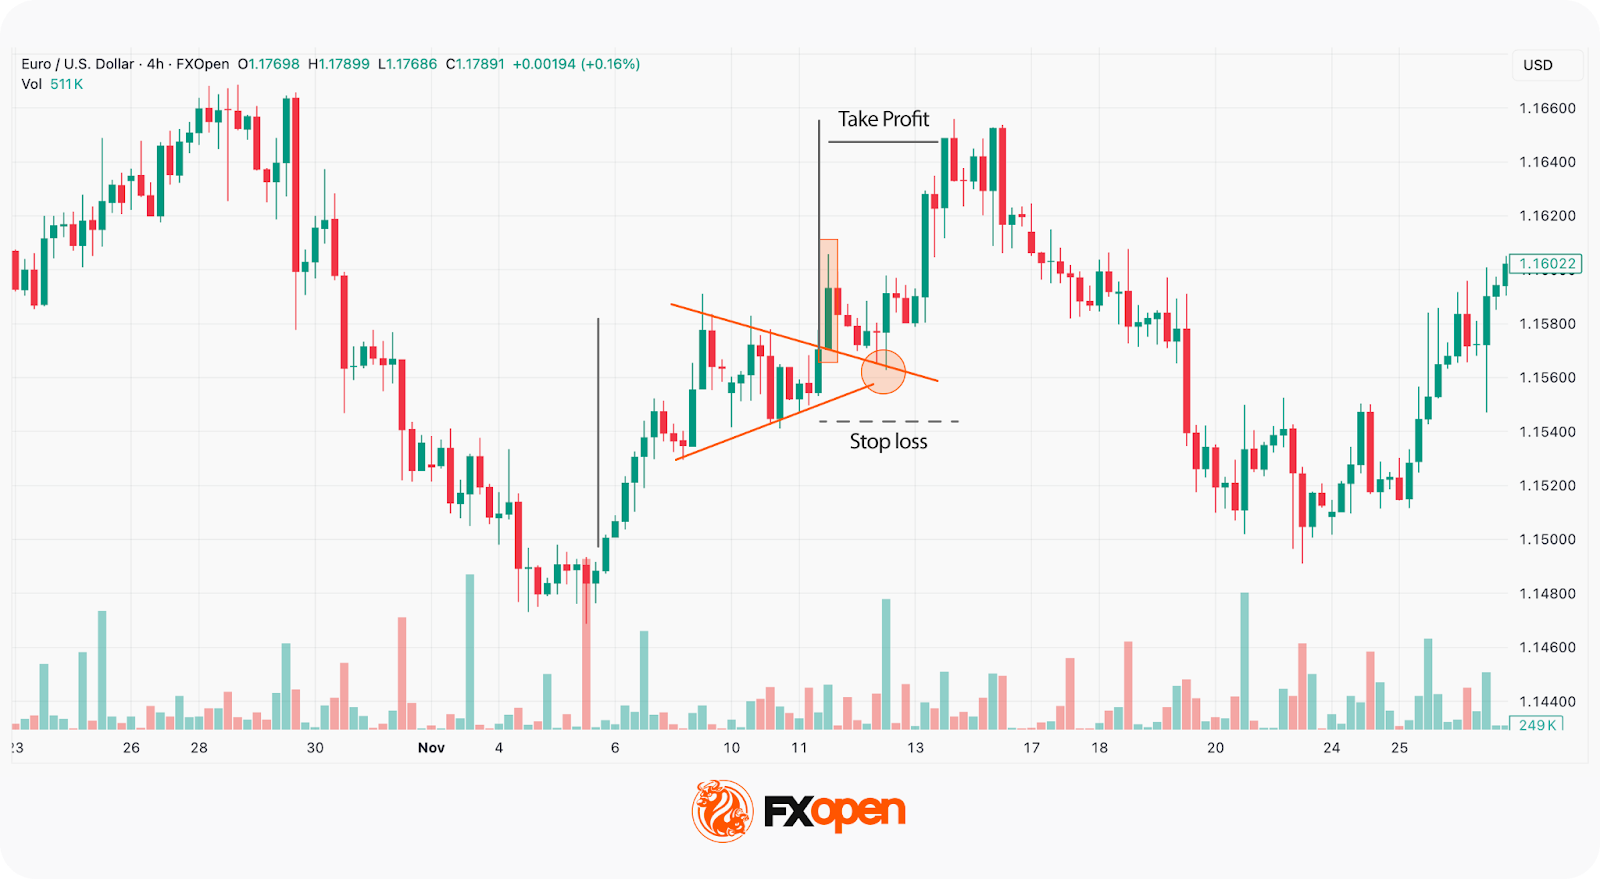
Trade Structure
Entry: Traders could enter at a retest of the broken trendline
Stop-Loss: Below the lower boundary
Target: Flagpole projection method, but with amendments. Although one of the rules states that the price is supposed to rise as far as the length of the flagpole, markets aren’t perfect. Therefore, many traders prefer to set a smaller target, taking into account recent price movements.
Why This Setup Worked
This example aligned with several high-probability conditions:
- Clean compression structure
- Breakout with momentum expansion
- No immediate resistance overhead
The setup demonstrates that pennants are not traded based on shape alone — they require context, confirmation, and disciplined execution.
You can test your own strategies across more than 700 instruments at FXOpen’s TickTrader trading platform.
Statistical Reliability of Pennant Patterns
Professional traders evaluate pennant formations within a broader market framework rather than as isolated chart patterns. Pattern performance is primarily influenced by objective market conditions, including:
- Higher-timeframe trend alignment
- Momentum persistence following the impulse leg
- Relative volume expansion during breakout
- Presence of directional liquidity and absence of equilibrium conditions
Trade outcomes, however, also depend on execution variables specific to the trader, such as:
- Entry model and confirmation criteria
- Risk management methodology
- Position sizing discipline
- Behavioural consistency during volatility expansion
According to research by Thomas Bulkowski in Encyclopedia of Chart Patterns, pennants are classified as moderately reliable continuation patterns.
In trending environments, measured-move targets are frequently achieved. In low-liquidity or sideways markets, failure rates increase.
Timeframes for Trading Pennants
Timeframe affects pattern’s reliability:
- Intraday (M15–H1): More signals, more noise
- H4–Daily: Cleaner structure
- Weekly: Institutional continuation setups
According to Thomas Bulkowski’s Encyclopedia of Chart Patterns, pennants form within up to 3 weeks. They are shorter than symmetrical triangles and wedges.
Brian Shannon explains how to trade in multiple timeframes in his Technical Analysis Using Multiple Timeframes.
Market-Specific Considerations
- Forex. Major pairs like EUR/USD respond strongly to policy divergence cycles.
- Cryptocurrencies*. Cryptocurrencies* display higher volatility, which may result in more false breakouts.
- Equity indices. Stock indices often form cleaner structures in sustained institutional trends. However, the pattern usually lasts no longer than three weeks, which means that it’s not very common on index charts.
Pennant vs Flag vs Symmetrical Triangle
Understanding structural distinctions between pennant pattern vs flag pattern vs symmetrical triangle pattern might improve trade selection and risk control.
Pennants differ from flags in that they show price compression rather than gradual retracement. Compared to symmetrical triangles, pennants are smaller and typically form over shorter durations during high-momentum conditions.
John Murphy widely explains the difference between pennant and flag patterns in his book Technical Analysis of the Financial Markets.
Common Pennant Trading Mistakes
Even experienced traders misinterpret compression structures. Frequent errors include:
- Entering before breakout confirmation. Acting inside the pennant, without confirmation, often means making a wrong decision. The pattern only matters once the price breaks cleanly.
- Trading consolidation without a clear flagpole. Not every consolidation is a pennant. If the lines don’t converge, or if the move before it wasn’t sharp and one-sided, it’s probably not a pennant. Forcing the pattern can lead to poor results.
- Ignoring higher timeframe trends. A pennant ahead of major resistance/support or against the broader trend weakens the setup. Context always matters more than the shape alone.
- Overlooking key macro catalysts. Important economic and political events can invalidate technical compression structures by abruptly shifting liquidity and volatility conditions.
- Neglecting volume analysis. A valid pennant typically shows declining volume during consolidation followed by expansion on breakout; without participation confirmation, price moves are statistically more prone to false breakouts.
Pattern shape alone is insufficient. Context and confirmation determine the edge.
Advantages and Limitations
Pennants are useful in strong trending markets, but they’re not perfect. Let’s take a look at the formation’s advantages and disadvantages.
Advantages
- Clear Structure: Pennants have three clear parts — the sharp flagpole, the tight consolidation, and the breakout offer a straightforward sequence.
- Works Across Timeframes: Pennants occur on many timeframes: from 5-minute charts to daily or weekly ones. That makes them useful for numerous kinds of strategies.
- Defined Breakout Levels: The converging trendlines naturally give a clear area to watch for breakout behaviour.
Limitations
- False Breakouts: Breakouts that stall quickly can trap traders, especially in choppy markets.
- Easily Confused: A messy pennant can look like a triangle or flag. If the structure isn’t clean, the signal can be harder to interpret.
- Relies on Existing Trend Strength: If the initial move is weak or inconsistent, the pennant can be less meaningful. It needs momentum to have the highest probability of working out.
Is It Possible to Improve Pennant Signals?
Like any pattern, the pennant isn’t foolproof. However, traders use certain methods when building a trading strategy around pennants.
Aligning With Trend Tools
Pennants are used in strong trends. You can use tools like moving averages to confirm them. For example, if the price is above the 50-period EMA and the pennant forms during a steady uptrend, that adds weight. A breakout above a short-term moving average can strengthen the case.
Momentum indicators can also help. If the Relative Strength Index (RSI) sits comfortably above 50 while the bullish pattern forms, or breaks out above 50 alongside the pennant, that can confirm a bullish trend and vice versa. However, if the RSI shows overbought/oversold conditions and the market does look very overstretched, that might be a sign to hold off or manage risk more carefully.
Using Volume as a Filter
Volume can give clues. During the pennant, volume may dry up and signal a pause. However, if the breakout coincides with strong volume, that can show genuine interest as buyers or sellers rush in to take advantage of a possible new trend leg. If it stays low, the move may fail or reverse due to a fake breakout.
Pairing It with Context
A pennant is just part of a broader story. For instance, if the market is bouncing off of a resistance level, creates an impulsive flagpole and then forms a bear pennant, that might add conviction to the pattern. However, if the breakout is straight into a major support level, traders might consider looking for a bullish reversal pattern instead.
Alignment between timeframes and correlated assets can be valuable too. If a pennant on the 1-hour chart occurs during a larger trend on the daily, that may add weight. Likewise, if there’s a bullish pennant forming on EUR/USD while dollar weakness is apparent across the board, there might be a higher probability that the bullish breakout is genuine.
Final Thoughts
The pennant pattern is a valuable tool, which provides useful insights into potential price trends. However, it may provide false signals; therefore, to trade with a pennant, you need to be familiar with technical analysis and be able to interpret charts.
You can explore live charts and apply these techniques using the FXOpen TickTrader platform, which provides 700+ instruments and advanced charting tools.
Consider opening an FXOpen account today and trade forex and CFDs on indices, commodities, and crypto* with:
- Spreads from 0.0 pips**
- Commission from $1.50**
- Fast execution
- Institutional-grade liquidity
FAQ
What Is a Pennant Pattern?
The pennant meaning refers to a short-term continuation pattern that forms after a sharp price move. It’s made up of a brief consolidation phase with converging trendlines, then followed by a breakout in the same direction as the original move. It can signal an impending continuation trend leg.
How Do Traders Trade a Pennant Pattern?
Traders usually wait for the price to break out of the pennant on rising volume in the same direction as the initial move. The height of the flagpole is typically used as a rough target, while stop losses are set beyond the last swing high/low or opposite pattern’s boundary.
What Happens After a Bullish Pennant?
A bullish pennant typically leads to further upside if the price breaks above the pattern’s upper trendline with strong momentum.
What Is the Difference Between a Bull Flag and a Bull Pennant?
Bull flags and bull pennants both follow strong upward moves and signal a trend continuation. The key difference between a pennant and a flag is structure. The price in a flag drifts lower or moves sideways within parallel lines that form a sloping or horizontal channel. The price in a pennant contracts into a small symmetrical triangle with converging trendlines.
*Important: At FXOpen UK, Cryptocurrency trading via CFDs is only available to our Professional clients. They are not available for trading by Retail clients. To find out more information about how this may affect you, please get in touch with our team.
**Additional fees may apply.
This article represents the opinion of the Companies operating under the FXOpen brand only. It is not to be construed as an offer, solicitation, or recommendation with respect to products and services provided by the Companies operating under the FXOpen brand, nor is it to be considered financial advice.

Crypto World
Senate Has 3 Weeks to Pass the CLARITY Act: Most Important Month in Ripple XRP History?
Ripple XRP is trading at $1.34 on April 7 – up 2.2% on ceasefire-driven risk-on flows, but the price level that matters most in April won’t be set by macro sentiment: it will be set by the Senate Banking Committee.
The CLARITY Act, which would codify XRP’s classification as a digital commodity under CFTC jurisdiction and strip the SEC of primary oversight authority, is targeting a committee markup in the second half of April.
Senator Bernie Moreno has stated publicly that if the bill doesn’t reach the full Senate floor by May, midterm election dynamics push it off the calendar for the rest of 2026. That makes the next three weeks the most consequential legislative window XRP has faced this year.
- Price level: XRP is trading at $1.34 as of April 6, down 63% from its July 2025 peak of $3.65, with Q1 2026 marking its worst quarter in eight years.
- Legislative clock: Senate Banking Committee markup is targeted for late April; Senator Moreno has warned that failure to advance by May effectively kills the bill for 2026.
- Bull case trigger: Banking Committee approval unlocks a projected $4–$8 billion in XRP ETF inflows per Standard Chartered’s Geoffrey Kendrick, with a price target above $1.60.
- Bear case floor: A stall past May combined with Bitcoin breaking below $60,000 puts XRP at risk of sliding toward $0.82, per 24/7 Wall St. analysis.
- Passage odds: Kalshi had 2026 passage odds at ~69% as of March 20; Polymarket currently sits at 63–66%, reflecting residual uncertainty around DeFi provisions and scheduling.
Discover: The best crypto to diversify your portfolio with
What the CLARITY Act Actually Does – and Why April Is the Only Window
The CLARITY Act (H.R. 3633) passed the House with a bipartisan 294–134 vote on July 17, 2025, assigning primary digital commodity oversight to the CFTC while limiting SEC jurisdiction over assets that qualify under the new framework.
The Senate Agriculture Committee advanced its version on January 29, 2026, but the Banking Committee – chaired by Tim Scott – has yet to markup, with unresolved disputes around DeFi regulatory provisions and tokenization treatment holding up the calendar.
The Senate returns from Easter recess on April 13, and Scott’s committee has a targeted markup window in the final two weeks of April.
The stablecoin yield dispute that stalled earlier negotiations appears to be resolving: Senators Tillis and Alsobrooks reached a compromise in principle on March 20 that bans passive yield on stablecoin balances but permits activity-based rewards tied to payments and platform use.
Senator Cynthia Lummis confirmed at the Chamber of Digital Commerce Blockchain Summit that DeFi provisions are finalized, projecting committee markup in late April followed by a mid-2026 floor vote.
The honest read on the scheduling math: Galaxy Research’s Alex Thorn has flagged that with only 18 working weeks remaining before the midterm recess on October 5, each week of delay compresses floor consideration time to the point where 2026 passage becomes structurally implausible without Banking Committee clearance by April’s end.
The SEC and CFTC jointly classified XRP as a digital commodity on March 17 – but that classification is an interpretive release, not statute.
A future administration could reverse it. Banks and large asset managers won’t commit capital at scale on the basis of an administrative determination alone. The CLARITY Act would make the commodity classification permanent federal law, and that distinction is the entire mechanism behind the bull case.
Discover: The best pre-launch token sales
Ripple XRP Might Hit $1.60-Plus If Clarity Clears
This whole Ripple XRP setup is basically riding on one thing, the CLARITY Act, because if it gets through the Banking Committee in late April, that is the switch that brings real institutional money off the sidelines, not just talk but actual flows, and that is where projections like $4–$8 billion in ETF inflows start to matter, especially when we have already seen strong demand even without full legal clarity, which is how you get price pushing through $1.60 and aiming higher.
The key detail most people miss is that this is not just hype around regulation, it is about certainty, because right now institutions can look at Ripple XRP but cannot fully commit, and that is why even something like the SEC CFTC classification did not move things structurally, it helps sentiment but does not unlock capital, while a law like CLARITY changes the rules completely and makes deployment easier.
If that approval gets delayed past May, the whole story weakens fast, because without it XRP just falls back into tracking Bitcoin, and with BTC already moving sideways, that means no strong independent move, and if macro pressure hits again, downside opens quickly.
The timeline shift from Ripple itself is also telling, with expectations already getting pushed back, which is usually a sign things are not as smooth behind the scenes as they look publicly.
So right now everything narrows down to that late April window, because if the committee moves, momentum hits fast, but if it stalls, this turns from a catalyst driven breakout setup into just another range with fading hype.
Research Best Wallet and join the presale before the next price tier.
The post Senate Has 3 Weeks to Pass the CLARITY Act: Most Important Month in Ripple XRP History? appeared first on Cryptonews.

When you search for:
“best AI crypto trading bot for beginners 2026”
“is automated crypto trading safe”
you’re already at a critical decision point:
Should you keep learning crypto trading on your own, or let an AI-powered system handle it for you?
In 2026, this question has become more relevant than ever. As the crypto market grows more complex and more beginners enter the space, a rising number of investors are turning to AI crypto trading bots to simplify the process and explore automated crypto trading as a more efficient way to participate.
Among the many platforms available, AriseAlpha has been gaining increasing attention—especially in searches related to:
-
AI crypto trading bot for beginners
-
hands-free crypto trading platform
-
passive income crypto strategies
But the real question is:
Is AriseAlpha truly beginner-friendly?
Or is it just another platform that looks simple on the surface?
In this review, we’ll break it down from a real user perspective, analyzing its workflow, system design, and usability to help you decide whether it’s worth trying.
What Makes AriseAlpha Different from Other AI Crypto Trading Bots?
Most platforms labeled as “AI trading bots” still require users to:
-
Configure strategies
-
Adjust parameters
-
Understand trading logic
AriseAlpha takes a different approach.
Instead of giving you tools, it gives you a ready-to-run system.
Key concept:
You don’t manage trades — you select a system that trades for you.
This is why it’s increasingly associated with searches like:
How AriseAlpha Works (Beginner Workflow Explained)
1. Quick Account Setup
The onboarding process is streamlined and doesn’t overwhelm new users with technical steps.
This removes the biggest barrier: getting started.
Click Register to claim your free $12 real reward right away!
2. Strategy Selection Instead of Strategy Building
Instead of charts and indicators, users see:
-
Pre-built AI trading strategies
-
Risk levels (conservative / balanced / aggressive)
-
Expected behavior explanations
This aligns perfectly with beginner intent:
choose, not analyze
3. Fully Automated Execution
Once activated, the system handles:
-
Market analysis
-
Trade execution
-
Strategy adjustments
No manual intervention required.
This is what defines a true hands-free crypto trading experience.
Performance Logic: How Does It Generate Returns?
AriseAlpha’s AI operates on three core layers:
-
Data-driven signal detection
-
Automated trade execution
-
Built-in risk management controls
Compared to manual trading:
|
Factor |
Manual Trading |
AI Trading |
|
Emotional bias |
High |
None |
|
Trading hours |
Limited |
24/7 |
|
Execution speed |
Slower |
Faster |
This explains the growing demand for:
“passive income crypto strategies” and “AI crypto bot automation”
Who Should Use AriseAlpha?
✔ Best Fit
-
First-time crypto investors
-
Users looking for passive income
-
People with limited time or trading knowledge
✖ Not Ideal For
Realistic Expectations
Let’s address the most searched concern:
“Do AI crypto trading bots actually work?”
The honest answer:
✔ They improve execution efficiency
✔ They remove emotional decision-making
✔ They automate trading processes
⚠ But they do NOT:
The value lies in process optimization, not certainty of returns
Why AriseAlpha Is Gaining Popularity in 2026
Three key trends are driving adoption:
-
Beginner demand for simplified investing
-
Rising interest in passive crypto income
-
Shift from manual trading to automation
Trending search keywords include:
-
AI crypto trading bot 2026
-
automated crypto investing platform
-
crypto passive income for beginners
AriseAlpha sits right at the intersection of these trends.
Conversion Insight: Why Many Beginners Actually Try It
From a behavioral perspective, most users are not looking for perfection—they are looking for:
-
A low-risk starting point
-
A simple onboarding experience
-
A way to test crypto trading without complexity
This is where AriseAlpha stands out.
The availability of a $12 free reward lowers the entry barrier significantly, allowing users to explore the platform before committing real funds.
FAQ
Q1: Is AriseAlpha legit for beginners in 2026?
✅ Yes, it is designed specifically for beginners with a fully automated trading system.
Q2: Can I earn passive income with AriseAlpha?
✅ Potentially yes, but results depend on market conditions and strategy performance.
Q3: Do I need trading experience?
✅ No, the platform is built for users with zero experience.
Q4: Is it really hands-free?
✅ Yes, once activated, the AI handles all trading operations automatically.
Final Verdict: Is AriseAlpha Worth Trying?
AriseAlpha may not be the most complex or customizable trading platform in the market—but that’s exactly its strength.
For users searching:
-
best AI crypto trading bot for beginners 2026
-
hands-free crypto trading platform
-
how to start crypto investing without experience
it offers something more practical:
A simple, low-barrier way to start
Rather than positioning itself as a “professional trading tool,” AriseAlpha functions as an entry point into automated crypto investing—especially for those who prefer simplicity over complexity.
If your goal is to explore crypto investing without spending weeks learning trading strategies, starting with a hands-free AI system like AriseAlpha could be a more efficient first step.
Disclaimer: This is a Press Release provided by a third party who is responsible for the content. Please conduct your own research before taking any action based on the content.


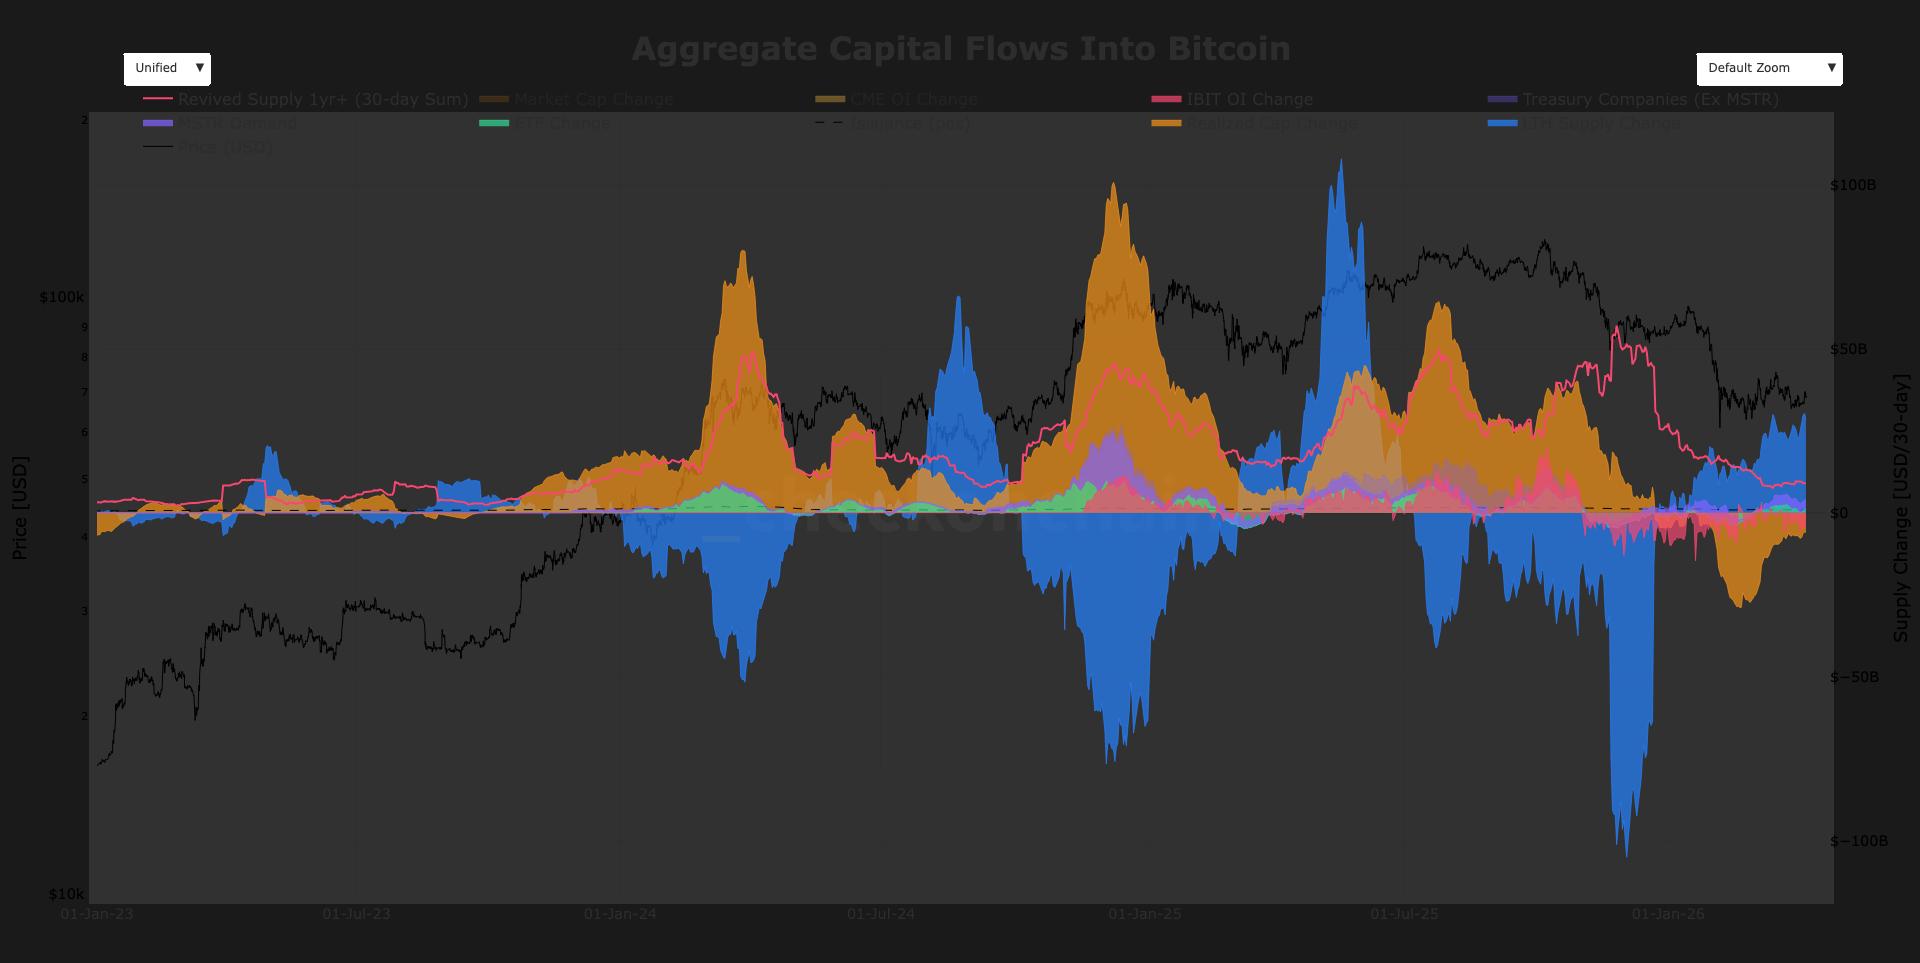
Strategy (MSTR), the world’s largest publicly traded holder of bitcoin, announced on Monday that it purchased 4,871 BTC for $330 million, marking one of its largest acquisitions of 2026.
Yet a recurring question remains, why do these sizable purchases fail to move the market? In fact, bitcoin’s price often declines around the time these announcements are made.
The answer lies in understanding market flows. MSTR demand currently accounts for roughly 7% of total gross inflows, rising to about 9% of net flows, according to checkonchain data. Gross flows reflect only positive demand entering the market, while net flows account for both buying and selling, giving a clearer picture of overall pressure. While Strategy remains a consistent buyer, its impact is relatively small compared to broader market forces.
Historically, its influence was larger. MSTR demand peaked above $15 billion in November 2024, coinciding with its all-time high stock price high and bitcoin over $100,000. Since then, activity has normalized to a range of $1 billion to $4 billion, with current demand around $2.8 billion over the past 30 days.
The dominant force is long-term holders (LTHs), coins held for more than 155 days, which are driving roughly $28.5 billion in supply change. A key subsection is revived 1+ year supply — older coins moving on chain over the past 30 days — which represents roughly $9 billion in change.
Elsewhere, U.S. spot exchange-traded funds (ETFs) have added roughly $1 billion of inflows over the past 30 days, while miner issuance, at 450 BTC per day, contributes around $880 million of monthly supply pressure.
More importantly, capital continues to leave. Bitcoin’s realized cap saw a $29 billion drawdown since February over a 30-day window, while BlackRock’s IBIT open interest is down over $4 billion. Together, these outflows dwarf MSTR’s demand.
Strategy may be buying aggressively, but it is being overwhelmed by larger forces distributing supply and capital being pulled out of the system.


Polygon crypto activated its Giugliano hardfork on mainnet at block 85,268,500 on April 8, delivering a 2-second reduction in transaction finality through a mechanism that lets block producers announce blocks earlier in the confirmation pipeline. The Polygon crypto Foundation confirmed the upgrade went live at approximately 2:00 p.m. UTC – on schedule and without reported disruption.
That 2-second cut isn’t cosmetic. For payment applications and real-world asset platforms running on Polygon PoS, faster finality directly compresses settlement risk and reduces the confirmation latency that separates blockchain UX from traditional financial infrastructure.
- What It Is: The Giugliano hardfork (PIP-83) is a Polygon PoS mainnet upgrade activating at block 85,268,500, targeting faster transaction finality and updated fee infrastructure.
- The Technical Change: Block producers can now announce blocks earlier in the cycle, cutting finality by 2 seconds – validated on the Amoy testnet before mainnet deployment.
- Fee Infrastructure: Fee parameters are now embedded directly in block headers, with new RPC endpoints for fee data – a structural change for wallets and developer tooling.
- Node Requirement: All node operators must run Bor v2.7.0 or Erigon v3.5.0 or higher; nodes on earlier versions will fall out of consensus at the activation block.
- What to Watch: Real-world finality metrics post-activation will determine whether the 2-second testnet gain holds at mainnet scale – and whether Polygon closes the UX gap with faster L2 competitors.
Discover: The Best Crypto to Get Right Now
What Giugliano Actually Changes for Polygon Crypto – and Why the Finality Mechanism Matters
The core change in Giugliano is architectural: block producers on Polygon PoS can now signal block availability earlier in the slot cycle, reducing the time validators must wait before treating a block as confirmed. On the Amoy testnet, that translated to a 2-second finality improvement – a measurable delta, not a rounding error, when the baseline confirmation window is already measured in seconds.
The upgrade also embeds fee parameters directly into block headers and introduces new RPC support for fee data.
That distinction matters for developers: wallets and dApps can now query fee conditions from block data directly rather than reconstructing them through separate API calls, which simplifies gas estimation logic and reduces the surface area for fee-related errors at the application layer.
Giugliano isn’t a throughput upgrade – it’s a latency and infrastructure upgrade. The Gigagas roadmap targeting 100,000 TPS remains a separate and longer-horizon effort. What Giugliano delivers is a tighter confirmation loop and cleaner fee data pipelines – foundational plumbing that the Gigagas scaling work will depend on.
The upgrade also carries specific backstory. Giugliano formally reintroduces PIP-66, a set of changes that were bundled into the earlier Bhilai hardfork (PIP-63) but rolled back after triggering unspecified network behavioral issues in deployment.
The Amoy testnet run on March 23 at block 35,573,500 served as the final validation gate before mainnet, and the clean activation on Wednesday suggests those earlier issues have been resolved.
Benchmarked against the broader L2 landscape, the gap Giugliano closes is real but context-dependent. Optimistic rollups like Arbitrum and Optimism carry 7-day challenge windows that dwarf any PoS finality metric. ZK-based rollups achieve near-instant cryptographic finality but at higher proving costs.
Polygon PoS sits in a different architectural category – a sidechain with its own validator set – and Giugliano tightens its native finality without altering those fundamental tradeoffs.
Explore: The Best Pre-Launch Token Sales With Asymmetric Upside Potential
The post Polygon Crypto Activates Giugliano Hardfork to Improve Transaction Finality appeared first on Cryptonews.


Disclosure: This article does not represent investment advice. The content and materials featured on this page are for educational purposes only.
Stablecoins are reshaping remittances as costs drop and settlement speeds accelerate globally.
Summary
- Stablecoins cut remittance costs to under $1, replacing slow and expensive traditional cross-border transfers
- Stablecoin market surpasses $310 billion as on-chain settlement drives faster, cheaper global payments
- Transak is powering stablecoin remittances with compliant fiat on/off-ramps across 60+ countries
Sending money across borders shouldn’t cost 6% and take five days. But for billions of people relying on traditional remittance corridors, it still does.
Stablecoins are changing that. By replacing correspondent banking with on-chain settlement, stablecoin remittances compress costs to under a dollar and settlement times to minutes. The global stablecoin market now exceeds $310 billion in market cap, and transaction volume hit $1.78 trillion in February 2026 alone.
The infrastructure is maturing fast. Here are the best companies and providers powering stablecoin remittance today.
1. Transak
Best for: Platforms and fintechs building stablecoin-powered remittance products that need compliant fiat on/off-ramp infrastructure across multiple markets.
Transak is a payments infrastructure provider that handles the fiat-to-stablecoin and stablecoin-to-fiat conversion layer for platforms building remittance products.
Transak is available in 64+ countries with support for local payment methods, including cards, bank transfers, Apple Pay, and Google Pay. It supports major stablecoins like USDC, USDT, RLUSD, PYUSD, and EURC across multiple blockchains.
What makes Transak particularly relevant for remittance is its stablecoin sandwich architecture: fiat in, stablecoin transfer on-chain, fiat out. Both sender and receiver stay in their local currency. The stablecoin layer is invisible to the end user.
Transak handles the entire compliance stack, including KYC, AML screening, and transaction monitoring, with registrations and licenses in the US, UK, EU, Canada, Australia, India, and other jurisdictions.
For platforms that want to offer remittance without building regulatory infrastructure from scratch, Transak’s white-label on-ramp and off-ramp APIs are the fastest integration path.
2. Circle (USDC)
Best for: Enterprises and institutions that prioritize regulatory transparency and need a fully audited stablecoin for settlement.
Circle is the issuer of USDC, one of the most widely used regulated stablecoins. USDC is backed 1:1 by US dollar reserves held in treasuries and cash, with monthly attestation reports.
Circle provides enterprise APIs for USDC payments and settlement, and USDC is available on over 20 blockchains, including Ethereum, Solana, and Stellar. For remittance companies that want to build on a transparent, compliance-first stablecoin, USDC is the default choice.
3. Stellar (via MoneyGram, Nium, and others)
Best for: Remittance corridors where last-mile cash pickup is essential and the recipient may not have a bank account.
The Stellar network was designed from the ground up for cross-border payments. It offers low transaction fees (fractions of a cent), fast settlement (3-5 seconds), and native support for stablecoins, including USDC.
Stellar’s real strength is its network of anchors, i.e., local financial institutions that handle the fiat on-ramp and off-ramp in each country. MoneyGram integrated Stellar for stablecoin-powered cash pickups, and Nium partnered with the Stellar Development Foundation to enable stablecoin payouts to 190 countries.
4. Ripple Payments (XRP)
Best for: Banks and licensed financial institutions looking for institutional-grade settlement infrastructure with existing banking network integrations.
Ripple’s enterprise payment network connects banks and payment providers for real-time cross-border settlement. While XRP is not a stablecoin, Ripple uses it as a bridge asset for liquidity in corridors where pre-funded accounts are expensive to maintain.
Ripple has partnerships with over 100 financial institutions and focuses heavily on B2B remittance and institutional corridors, particularly in Asia and the Middle East.
5. BVNK
Best for: High-volume B2B payment companies and remittance operators that need multi-currency, multi-chain settlement.
BVNK provides enterprise infrastructure for businesses to move money between fiat and stablecoins at scale. With 25+ licenses covering 130+ markets, BVNK processed $30 billion in annualized stablecoin payment volume in 2025.
The platform supports multi-token and multi-chain settlement, making it suitable for high-volume corridors where speed and compliance matter equally.
6. Stripe
Best for: Existing Stripe merchants looking to add stablecoin settlement without changing their payment stack.
Stripe integrated stablecoin payments in 2025, allowing merchants to accept and settle in USDC across Ethereum, Solana, Polygon, and Base. Stripe automatically converts stablecoin payments to fiat, making it accessible for businesses already on the platform.
While not a remittance-specific provider, Stripe’s infrastructure is increasingly relevant for platforms that process international payouts or cross-border merchant payments.
7. Fireblocks
Best for: Enterprises building custom stablecoin payment infrastructure that need institutional-grade custody and orchestration.
Fireblocks provides the orchestration layer for enterprise stablecoin operations, including custody, transfer, and settlement across 100+ blockchains. It’s the backend infrastructure that many of the companies on this list (including Transak) use for secure asset movement.
Fireblocks is not consumer-facing; it powers the institutional plumbing behind stablecoin remittance platforms.
What’s Next for Stablecoin Remittance
Regulatory clarity is accelerating adoption. The US GENIUS Act establishes federal requirements for stablecoin issuers. The EU’s MiCA framework is already live. As these frameworks solidify, the gap between stablecoin remittance and traditional rails will only widen.
The infrastructure for compliant stablecoin payments already exists. The providers listed here are the ones making it production-ready.
Disclosure: This content is provided by a third party. Neither crypto.news nor the author of this article endorses any product mentioned on this page. Users should conduct their own research before taking any action related to the company.
Crypto World
Bitcoin (BTC) price touches $70,000 as ETF inflows signal institutional interest: Crypto Daybook Americas
By Francisco Rodrigues (All times ET unless indicated otherwise)
Bitcoin and the wider crypto market showed mixed signals on Tuesday, with the largest cryptocurrency briefly touching $70,000 on reports a ceasefire in Iran was proposed.
The hesitation comes a day after bitcoin exchange-traded funds (ETFs) recorded their largest inflows since late February, even as the market pays close attention to the harsh macro backdrop. Bitcoin ETF investors’ demand suggests they see the current price action as an accumulation opportunity.
Binance Research found earlier this month that bitcoin’s correlation with its Global Easing Breadth Index, which tracks 41 central banks, turned strongly negative after the launch of spot bitcoin ETFs. ETF-driven institutional flows tend to be more forward-looking, positioning themselves for expected policy moves. That is, institutional capital may be accumulating ahead of expected easing of monetary policy.
Bitfinex Alpha described the market as range-bound but fragile, with weak organic demand, slower corporate treasury buying and options positioning that turns more unstable below $68,000 as downside protection grows.
Macro pressure remains relevant too. Brent crude remains above $110 a barrel as the looming deadline U.S. President Donald Trump imposed on Iran for a deal to open the Strait of Hormuz keeps investors on edge.
The market currently sees little room for the Federal Reserve to lower rates in the near future given the expected inflation rise caused by higher energy costs. U.S. inflation data coming in later this week will be critical. Stay alert!
Read more: For analysis of today’s activity in altcoins and derivatives, see Crypto Markets Today
What to Watch
For a more comprehensive list of events this week, see CoinDesk’s “Crypto Week Ahead“.
- Crypto
- Macro
- April 7, 07:15 a.m.: U.S. ADP Employment Change Weekly (est. 10K)
- April 7, 7:30 a.m.: U.S. Durable Goods Orders MoM for February est 04% (Prev. 0%)
- April 7, 11:35 a.m.: Chicago Fed President and CEO Austan Goolsbee to participate in a conversation on economic and monetary policy.
- Earnings (Estimates based on FactSet data)
Token Events
For a more comprehensive list of events this week, see CoinDesk’s “Crypto Week Ahead“.
- Governance votes & calls
- April 7: Kamino and xStocks to host an X Spaces session on tokenization.
- Balancer DAO is voting across two linked proposals to restructure operations with a reduced team and budget, and to revamp tokenomics by halting BAL emissions, discontinuing veBAL, routing all fees to the treasury, and offering a token buyback. Voting ends April 7.
- CoW DAO is voting to fix its solver rewards budget at 50% of protocol revenue, splitting it between performance and new consistency rewards. The proposal has overwhelming support and ends April 7.
- Unlocks
- Token Launches
Conferences
For a more comprehensive list of events this week, see CoinDesk’s “Crypto Week Ahead“.
Market Movements
- BTC is down 0.98% from 4 p.m. ET Monday at $69,149.83 (24hrs: -1.05%)
- ETH is down 0.98% at $2,128.41(24hrs: -1.31%)
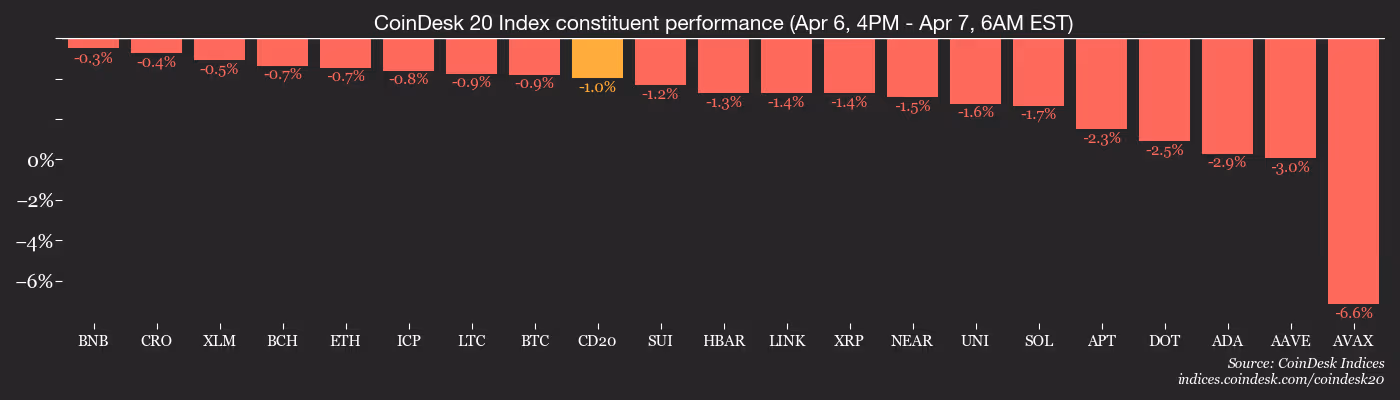
- CoinDesk 20 is down 1.13% at 1,946.75 (24hrs: -1.59%)
- Ether CESR Composite Staking Rate is up 4 bps at 2.74%
- BTC funding rate is at 0.0049% (5.3327% annualized) on Binance

- DXY is down 0.15% at 99.83
- Gold futures are unchanged at $4,688.40
- Silver futures are down 0.3% at $72.63
- Nikkei 225 closed unchanged at 53,429.56
- Hang Seng closed down 0.70% at 25,116.53
- FTSE is up 0.33% at 10,470.51
- Euro Stoxx 50 is up 0.98% at 5,748.35
- DJIA closed on Monday up 0.36% at 46,669.88
- S&P 500 closed up 0.44% at 6,611.83
- Nasdaq Composite closed up 0.54% at 21,996.34
- S&P/TSX Composite closed up 0.22% at 33,181.97
- S&P 40 Latin America closed up 0.12% at 3,656.10
- U.S. 10-Year Treasury rate is down 1 bps at 4.325%
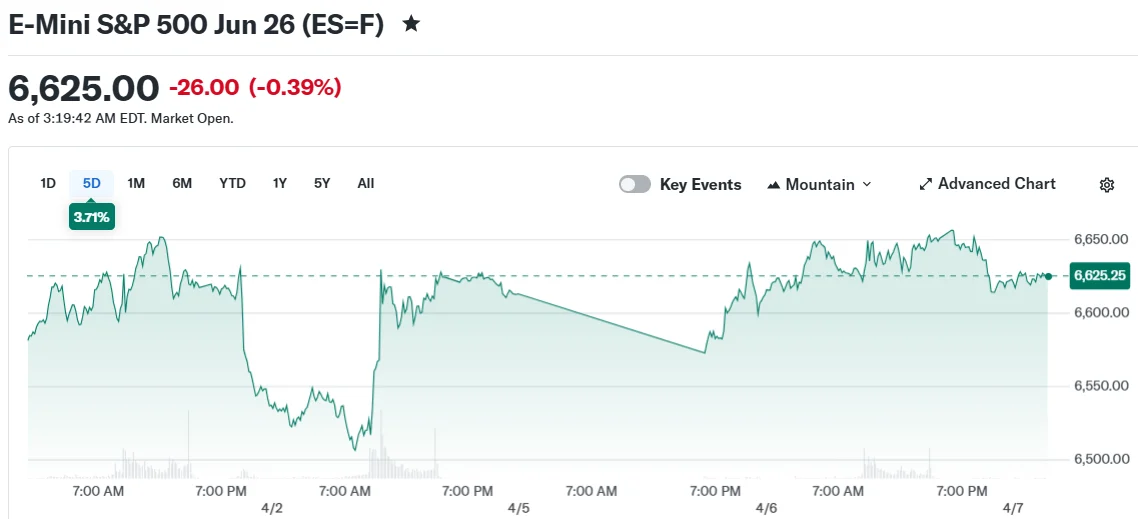
- E-mini S&P 500 futures are unchanged at 6,657.25
- E-mini Nasdaq-100 futures are unchanged at 24,373.50
- E-mini Dow Jones Industrial Average Index futures are up 0.16% at 46,976.00
Bitcoin Stats
- BTC Dominance: 59.04% (-0.08%)
- Ether-bitcoin ratio: 0.03077 (0.54%)
- Hashrate (seven-day moving average): 951 EH/s
- Hashprice (spot): $31.40
- Total fees: 2.18 BTC / $151,084
- CME Futures Open Interest: 117,120 BTC
- BTC priced in gold: 14.8 oz.
- BTC vs gold market cap: 4.6%
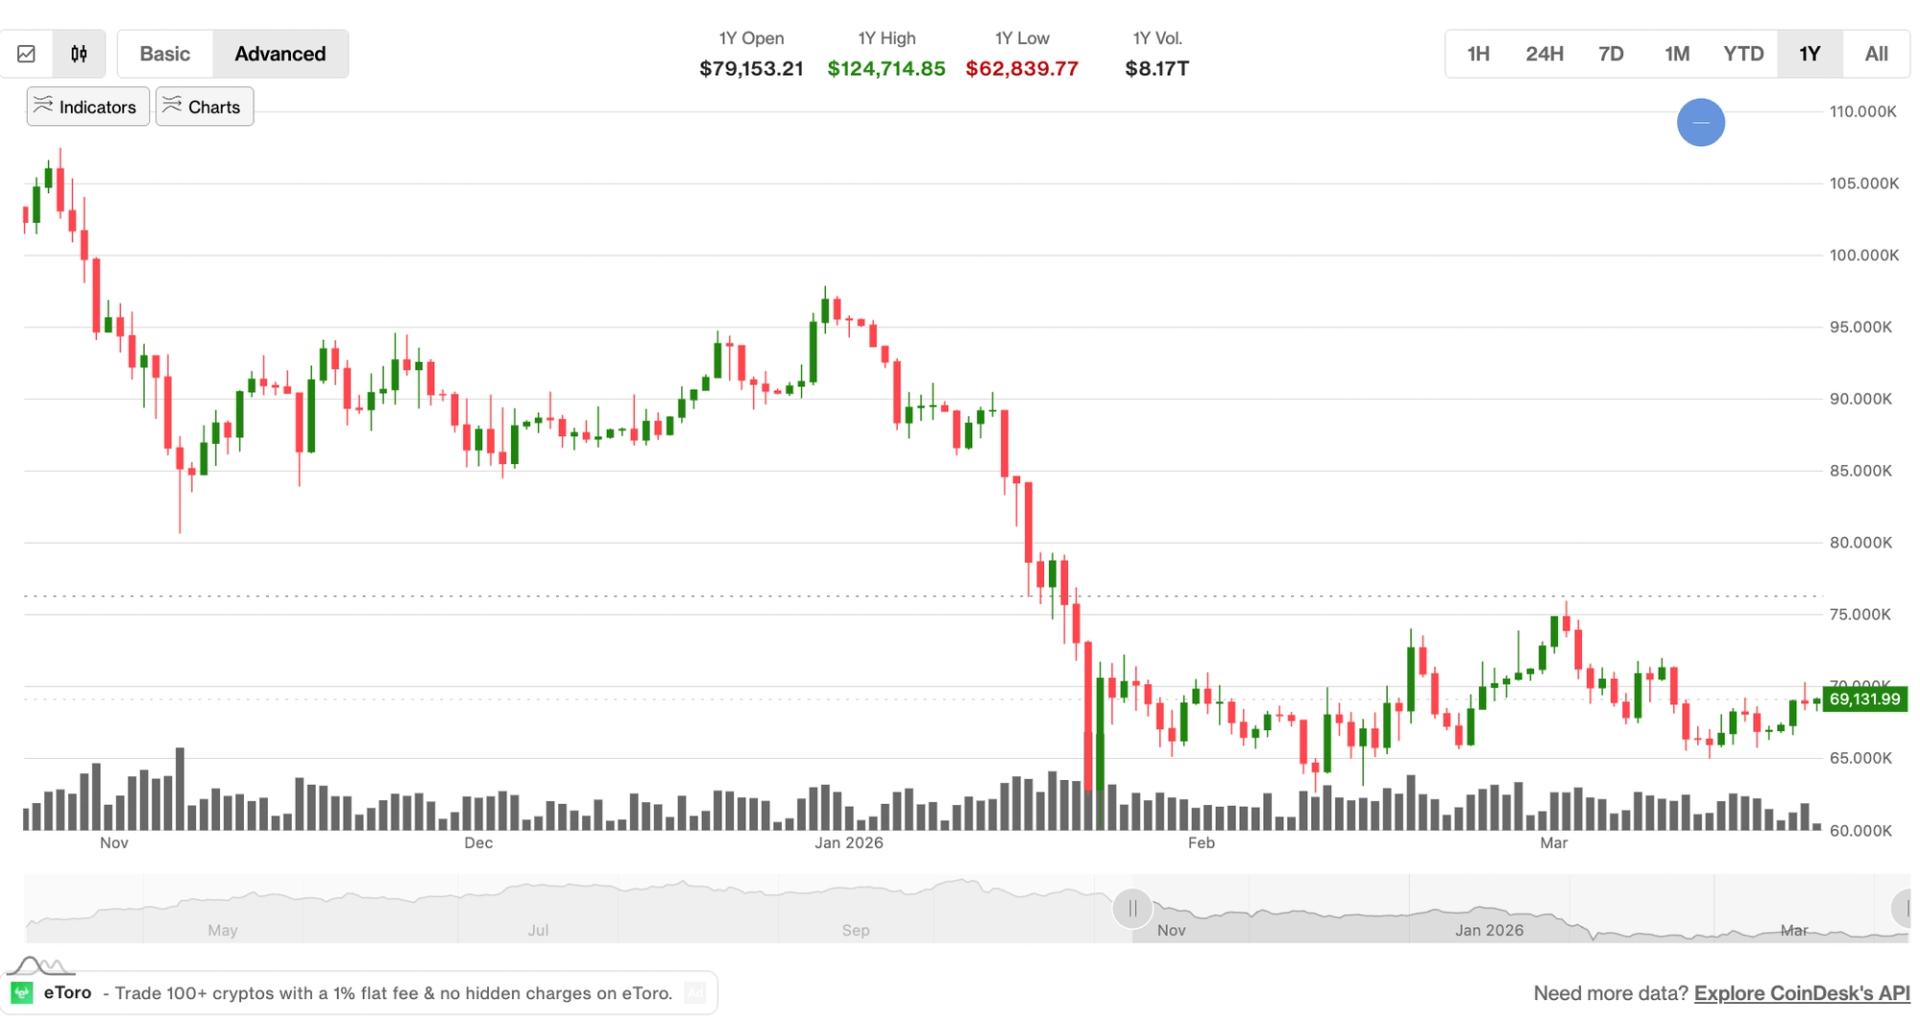
Technical Analysis

- The chart shows bitcoin’s dollar price in weekly candle for the past several years.
- The measure is still trading around the 200-week exponential moving average of $68,317 while the RSI continues to grind up after bottoming out at 27 a few weeks ago.
- With no clear bearish RSI divergences, the next core level to monitor is $73,000 for any confirmed upward momentum
Crypto Equities
- Coinbase Global (COIN): closed on Monday at $174.79 (+1.94%), -0.56% at $173.82 in pre-market
- Circle Internet (CRCL): closed at $92.15 (+2.09%), +0.18% at $92.32
- Galaxy Digital (GLXY): closed at $18.28 (+3.63%), +0.11% at $18.30
- Bullish (BLSH): closed at $37.35 (+2.69%), unchanged in pre-market
- MARA Holdings (MARA): closed at $8.85 (+1.61%), -0.55% at $8.80
- Riot Platforms (RIOT): closed at $13.52 (+5.13%), -0.52% at $13.45
- Core Scientific (CORZ): closed at $16.29 (+0.37%), -0.18% at $16.26
- CleanSpark (CLSK): closed at $9.10 (+3.53%), -0.33% at $9.07
- CoinShares Valkyrie Bitcoin Miners ETF (WGMI): closed at $36.70 (+2.63%)
- Exodus Movement (EXOD): closed at $6.33 (+3.77%), +0.63% at $6.37
Crypto Treasury Companies
- Strategy (MSTR): closed at $127.69 (+6.56%), -0.71% at $126.79
- Strive (ASST): closed at $10.12 (+3.79%), +0.30% at $10.15
- SharpLink Gaming (SBET): closed at $6.38 (+3.07%), +0.12% at $6.39
- Upexi (UPXI): closed at $1.01 (+3.59%), -0.99% at $1.00
- Lite Strategy (LITS): closed at $1.14 (+1.79%)
ETF Flows
Spot BTC ETFs
- Daily net flows: $471.4 million
- Cumulative net flows: $56.41 billion
- Total BTC holdings ~1.29 million
Spot ETH ETFs
- Daily net flows: $120.2 million
- Cumulative net flows: $11.63 billion
- Total ETH holdings ~5.68 million
Source: Farside Investors
While You Were Sleeping
US-listed spot Bitcoin ETFs renewed their inflow pace on Monday, drawing in $471 million in a single day, according to SoSoValue. The size of the inflow marks the strongest daily momentum in weeks as Bitcoin briefly climbed toward $70,000 before retreating to just under $69,000, per CoinGecko.
Market mood remained fragile amid ongoing geopolitical pressure and renewed concerns over Bitcoin’s quantum-resistance debate, while the Crypto Fear & Greed Index stayed in Extreme Fear at 13, highlighting the cautious stance of many investors.
Key takeaways
- Monday’s spot-Bitcoin ETF inflows reached $471 million, the largest single-day intake since February 25.
- Leading inflows by issuer: BlackRock’s IBIT with about $182 million, Fidelity Wise Origin Bitcoin Fund (FBTC) with $147 million, and ARK 21Shares Bitcoin ETF (ARKB) with roughly $119 million, per data from Farside.
- ARKB’s surge represented its strongest daily inflow in months, signaling renewed appetite among some long-duration players.
- Arkham data indicates ETF outflows slowed last week, with major issuers selling around $16.6 million in BTC; ARK Invest’s ARKB ETF bought about $34 million in BTC in that period, per Arkham.
- In April’s early sessions, US spot BTC ETFs posted about $307 million in net inflows, lifting total assets under management above $90 billion.
Top inflows and the issuer lineup
BlackRock’s iShares Bitcoin Trust ETF (IBIT) led the charge on Monday with roughly $182 million in new money, followed by Fidelity’s Wise Origin Bitcoin Fund (FBTC) at about $147 million, according to data tracked by Farside. The ARK 21Shares Bitcoin ETF (ARKB) rounded out the top three with roughly $119 million in fresh inflows, marking its strongest daily showing since mid-2025.
The activity underscores that, even amid volatility and macro concern, institutional-grade vehicles remain capable of moving sizable sums into the regulated crypto access space in the United States.
Arkham signals and weekly positioning
Arkham’s monitoring shows a refreshing pause in ETF outflows last week, with major issuers selling only about $16.6 million in Bitcoin. In that same period, ARK Invest’s ARKB ETF was the standout buyer, adding about $34 million worth of BTC. The signals point to a nuanced reweighting among funds—some lightening exposure while a subset targets fresh BTC purchases.
Looking at the broader April picture, Arkham data summarized that the first three trading sessions of the month produced roughly $307 million in net inflows for US spot BTC ETFs, helping push total assets under management over the $90 billion mark. This suggests a potential shift in risk appetite among US-listed ETF vehicles as market conditions quietly stabilize from earlier volatility.
Ether ETFs rebound, but the broader alt-coin set remains cautious
Ether-based ETF products joined the recovery, recording about $120 million in inflows on Monday and offsetting about $78 million of outflows from the prior two sessions, according to SoSoValue. Still, Ether ETFs have faced three consecutive months of losses, with total outflows reaching about $770 million for the period.
Activity across other altcoin ETFs remained comparatively muted. XRP ETFs posted zero inflows on Monday, while Solana (SOL) ETFs brought in roughly $247,000. The pattern suggests a cautious approach among investors toward non‑BTC chains, even as appetite for regulated BTC access remains firm.
What the data implies for traders and investors
The April uptick in US spot BTC ETF inflows could be interpreted as a return of institutional interest, carried partly by marquee vehicles such as IBIT and ARKB. For traders, the inflows may reflect a combination of price proximity to $70,000, ongoing macro uncertainty, and the appeal of regulated exposure with transparent custody and compliance frameworks.
Yet the backdrop remains mixed. While inflows are evolving, Bitcoin’s quantum-resistance debate and geopolitical tensions continue to cast a shadow over sentiment. The ongoing resilience in ETF demand may hinge on how regulatory clarity evolves and whether more traditional asset allocators view crypto exposure as a core, capital-efficient segment of their portfolios.
In March, Bitcoin ETFs posted about $1.3 billion in inflows—the first monthly gain after January outflows of $1.61 billion and February outflows of $207 million—indicating that financial-market participants are cautiously re-engaging with regulated crypto access after a period of outsized outflows.
As the month progresses, investors will be watching whether this renewed ETF interest translates into sustained net flows or remains episodic. Key questions include how issuer strategies adjust to shifting BTC price action, whether Ether and other altcoin ETF inflows pick up in tandem, and how regulatory developments in the U.S. shape the appetite for institutional-grade crypto exposure.
Watch next for any changes in the ETF lineup, additional weekly flow data, and how market volatility around macro headlines interacts with the ongoing push for regulated crypto access in the United States.
Key Takeaways
- UBS has revised its S&P 500 year-end 2026 projection downward from 7,700 to 7,500
- Elevated crude prices stemming from Middle Eastern geopolitical tensions drive the revision
- The benchmark index has declined 3.9% following the outbreak of Iran conflict on February 28
- Federal Reserve rate reduction expectations shifted to September and December from June and September
- Despite revisions, UBS maintains approximately 13% potential upside with $310 earnings per share forecast
UBS Global Wealth Management has adjusted its outlook for the S&P 500, trimming its price projection for 2026. The revision comes as energy costs climb and economic headwinds intensify due to escalating tensions in the Middle East.
According to an April 6 research note, UBS reduced its year-end forecast to 7,500 from a previous estimate of 7,700. The firm also lowered its mid-year projection to 7,000 from 7,300.

Since conflict erupted with Iran on February 28, the S&P 500 has retreated approximately 3.9%. Spiking energy costs combined with geopolitical instability have prompted investors to reduce equity exposure.
UBS’s central scenario anticipates the conflict subsiding in the weeks ahead, which would enable energy supply chains to gradually normalize.
Yet the Swiss banking giant cautioned that returning oil production to pre-conflict capacity will require significant time. Widespread infrastructure damage throughout the region means full production restoration remains months away.
This delay could sustain elevated crude prices beyond current market expectations.
Energy Price Surge Creates Economic Headwinds
Rising energy costs typically decelerate economic expansion while accelerating inflation. UBS indicated this pattern will likely sustain sticky inflation and create modest drag on the American economy.
Consequently, the institution now anticipates the Federal Reserve will postpone additional monetary easing. UBS had originally projected reductions in June and September but now forecasts two 25-basis-point decreases in September and December.
This adjustment illustrates how international geopolitical developments can influence domestic central bank decisions.
Notwithstanding the reduced targets, UBS calculates roughly 13.43% upside potential from the S&P 500’s most recent closing level of 6,611.83.
Long-Term Bullish Stance Remains Intact at UBS
UBS maintained its 2026 earnings projection for the S&P 500 at $310 per share. The institution characterized American equities as “attractive” notwithstanding near-term challenges.
The firm highlighted that corporate profit expansion remains robust. It also emphasized ongoing artificial intelligence adoption and commercialization as supportive factors for equities once conflict-related pressures diminish.
UBS noted that even with delayed policy accommodation, the Federal Reserve continues to provide broad market support.
The bank refrained from altering its constructive view on U.S. stocks. It simply recalibrated the timeline and magnitude of its price forecasts to reflect the ongoing war’s impact.
UBS currently projects two Federal Reserve rate reductions before 2026 concludes, both scheduled for the year’s second half.
Crypto World
Analysts eye potential breakdown as BTC price repeats familiar pattern: Crypto Markets Today

The crypto market is trading sluggishly within the range it has held for two months, with bitcoin changing hands at $69,000 and ether (ETH) at $2,130.
The range-bound pricing dates back to Feb. 6, with several peaks between $72,000 and $75,000 and troughs between $62,000 and $65,000.
A similar two-month pattern occurred between November and January before a price breakdown, leading analysts to suggest a similar scenario may play out this time around.
Much still depends on the conflict in Iran, with U.S. President Donald Trump’s threats of “obliteration” falling on deaf ears thus far. Brent crude oil remains at $107 per barrel, which will have a knock-on effect on inflation over the course of the year unless it declines.
Derivatives positioning
- The market continues to consolidate as bitcoin open interest (OI) stabilizes at $16.7 billion, little changed from last week and indicating that speculative activity remains flat.
- Funding rates have moved into a neutral 0%-6% range, following a period of negative funding that likely fueled the initial relief rally through short covering.
- With the three-month annualized basis also little changed over the week, institutional conviction remains cautious, suggesting that while the immediate downside pressure has eased, the big players are not yet positioning for a major breakout.
- Options sentiment is stabilizing as call dominance reaches 47% and one-week skew drops to 16% from 19% last week. However, the implied volatility term structure’s front-end backwardation confirms that traders are still prioritizing immediate downside protection over long-term growth expectations.
- CoinGlass data shows $163 million in 24-hour liquidations, with a 60-40 split between longs and shorts. BTC (64 million), ETH ($35 million) and others ($16 million) were the leaders in terms of notional liquidations.
- The Binance liquidation heatmap indicates $69,500 as a core level to monitor in case of a price rise.
Token talk
- The altcoin market has been surprisingly buoyant recently, despite broader market apathy. Since midnight UTC privacy tokens zcash (ZEC) and dash (DASH) rose by 6.7% and 3.1%, respectively, and there were also notable gains for FET, PUMP and RENDER.
- The bitcoin-dominant CoinDesk 20 (CD20) index gained 0.3% on Tuesday, while being outpaced by the CoinDesk Memecoin Index (CDMEME) and CoinDesk Computing Select Index (CPUS), a sign of the relative strength of altcoins compared with crypto majors.
- The recent bounce in altcoins has not been uniform, however. AI tokens, privacy tokens and the likes of HYPE and ALGO have performed well, while other market segments have tumbled. Over the past 90 days ethena (ENA) has lost 66% of its value, while TIA, LDO, SUI and ARB have all fallen by more than 50%.
- That’s a divergence from previous cycles, when altcoins moved in unison. It now appears the market is maturing to a point where assets may be moving based on real-world impact, as opposed to hype and overzealous roadmaps.

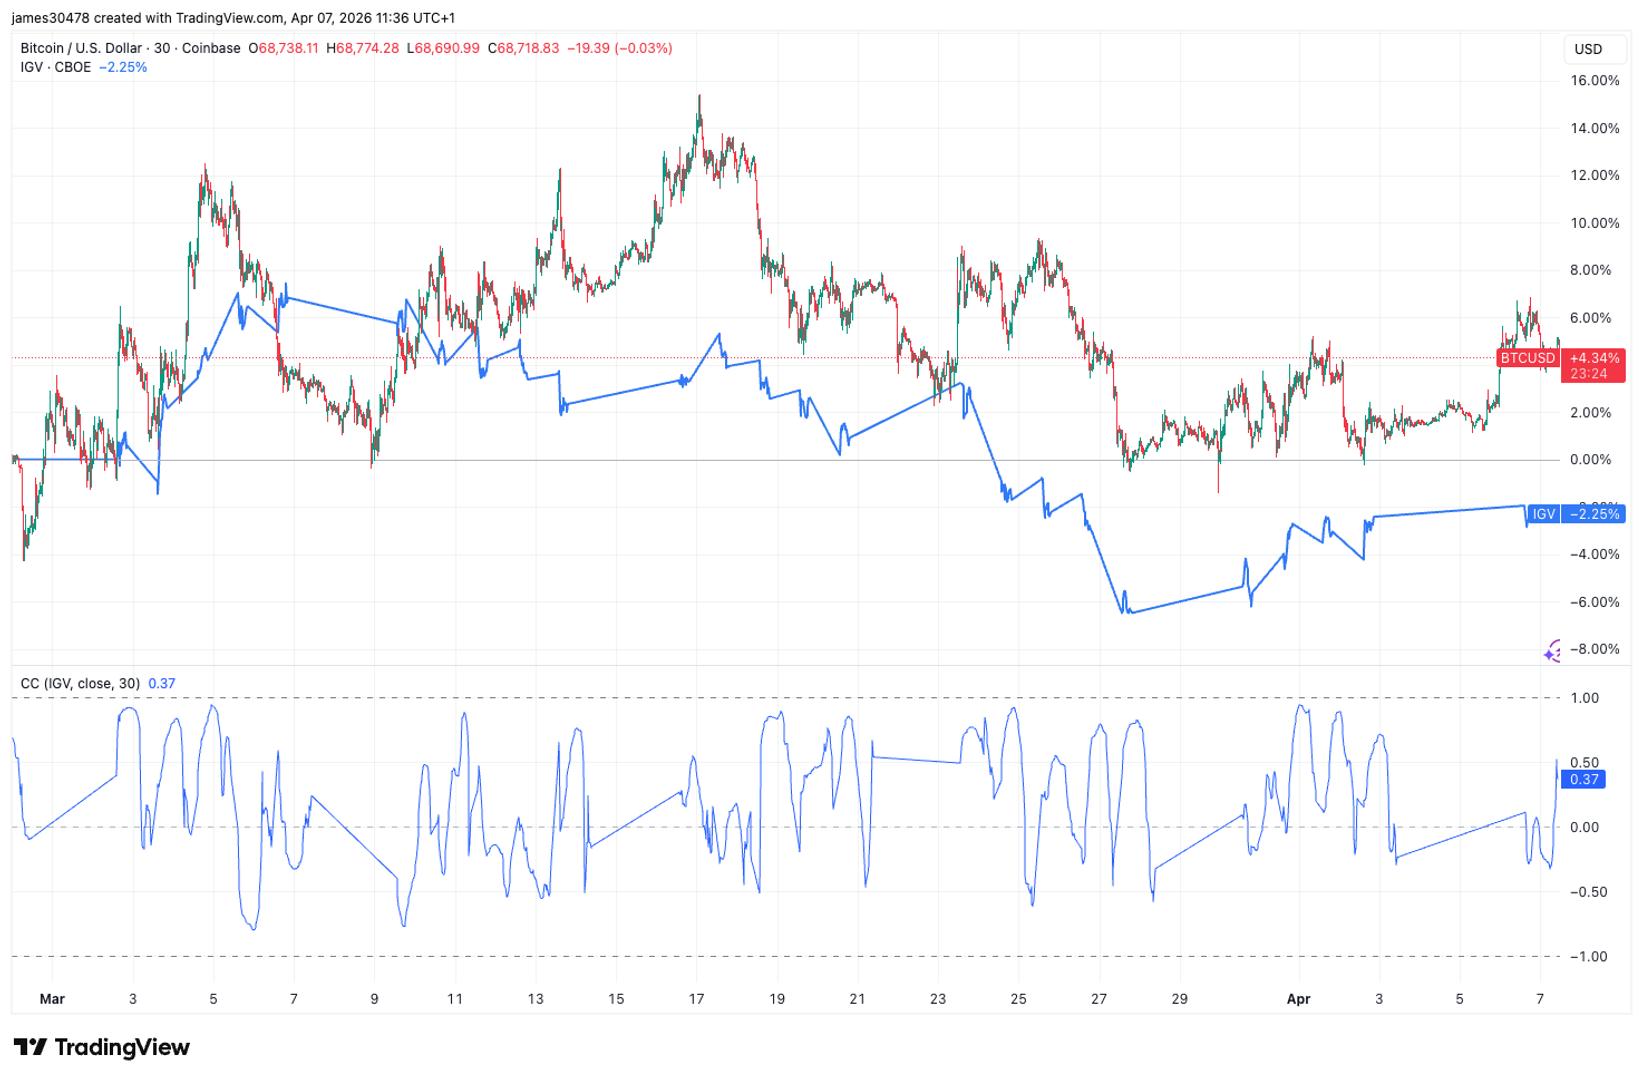
Since the outbreak of the war with Iran on Feb. 28, bitcoin has started to diverge from software equities, with the iShares Expanded Tech-Software Sector ETF (IGV), serving as a useful proxy for the sector.
Bitcoin has been one of the strongest-performing assets during this period, rising more than 5% and trading back above $69,000, including a gain of more than 0.5% over the past 24 hours.
IGV, in contrast, has fallen more than 2% since the conflict began. That gap suggests investors are starting to treat bitcoin and software stocks differently, at least in the near term.
Until recently, the two had moved closely together. Over the past three months, bitcoin fell 26% and the ETF lost 23%. Year to date, both are lower by about 21%. Over five years, bitcoin has gained 18% compared with 10% for IGV. In other words, both have moved in the same direction, but the cryptocurrency has done so with much greater volatility.
That is also clear in their declines. Bitcoin had fallen roughly 50% from its October all-time high, while IGV, which peaked slightly earlier, fell about 35% from its own top.
The correlation data tells the same story. From early February, bitcoin and IGV were almost perfectly correlated, close to 1.0, meaning they were moving nearly in lockstep. After the war began, that relationship broke down sharply, with the correlation dropping to 0.13, a level that signals near decoupling, before rebounding to around 0.7. The figure can range between -1.0 and +1.0, with 0 indicating no correlation at all.
Why have software stocks been hit harder?
IGV is heavily weighted toward large software and services companies such as Microsoft (MSFT), Oracle (ORCL) and Salesforce (CRM). Investors are increasingly worried that artificial intelligence will compress margins and valuation multiples across software, especially in Software as a Service (SaaS), as competition rises and barriers to entry fall. Bitcoin, meanwhile, is trading more like a macro asset, benefiting from geopolitical uncertainty.

Royal Fleet Auxiliary seafarers go ahead with strike action
Inside Augusta National’s secret, $500-million real estate empire

Picsart launches “Earn with Picsart”, a monetisation programme


-

 NewsBeat5 days ago
Steven Gerrard disagrees with Gary Neville over ‘shock’ Chelsea and Arsenal claim | Football
-

 Business4 days ago
No Jackpot Winner and $194 Million Prize Rolls Over
-

 Fashion4 days ago
Weekend Open Thread: Spanx – Corporette.com
-

 Crypto World6 days ago
Gold Price Prediction: Worst Month in 17 Years fo Save Haven Rock
-

 Business2 days ago
Three Gulf funds agree to back Paramount’s $81 billion takeover of Warner, WSJ reports
-
Crypto World7 days ago
Dems press CFTC, ethics board on prediction-market insider trades
-

 Sports3 days ago
India men’s 4x400m and mixed 4x100m relay teams register big progress | Other Sports News
-

 Business3 days ago
Expert Picks for Every Need
-

 Business5 days ago
Login and Checkout Issues Spark Merchant Frustration
-

 Sports7 days ago
Tallest college basketball player ever, standing at 7-foot-9, entering transfer portal
-

 Crypto World7 days ago
Bitcoin enters the public bond market as Moody’s gives a first-of-its-kind crypto deal a rating
-
Crypto World6 days ago
Bitcoin stalls below key resistance as technical signals skew bearish
-

 Tech5 days ago
Commonwealth Fusion Systems leans on magnets for near-term revenue
-

 Politics6 days ago
Starmer’s centre has collapsed, and the left was right all along
-
Business2 days ago
No Jackpot Winner, Prize to Climb to $231 Million
-

 Fashion7 days ago
Tuesday’s Workwear Report: Tavira Sculpt Stretch Crepe Trousers
-
Crypto World7 days ago
AI Memory Rout Wipes 9% Off Nvidia Stock: Chart Says More Pain Ahead
-

 Crypto World6 days ago
Why It’s Partnering, Not Issuing
-

 Crypto World6 days ago
Ripple rolls out enterprise crypto treasury platform for corporates
-
Tech7 days ago
AirPods Max 2 review: Familiar features & design, but needs more
You must be logged in to post a comment Login