

Crypto World
The UFO Capital of America Has a Bitcoin Wallet: Did Aliens Buy BTC?

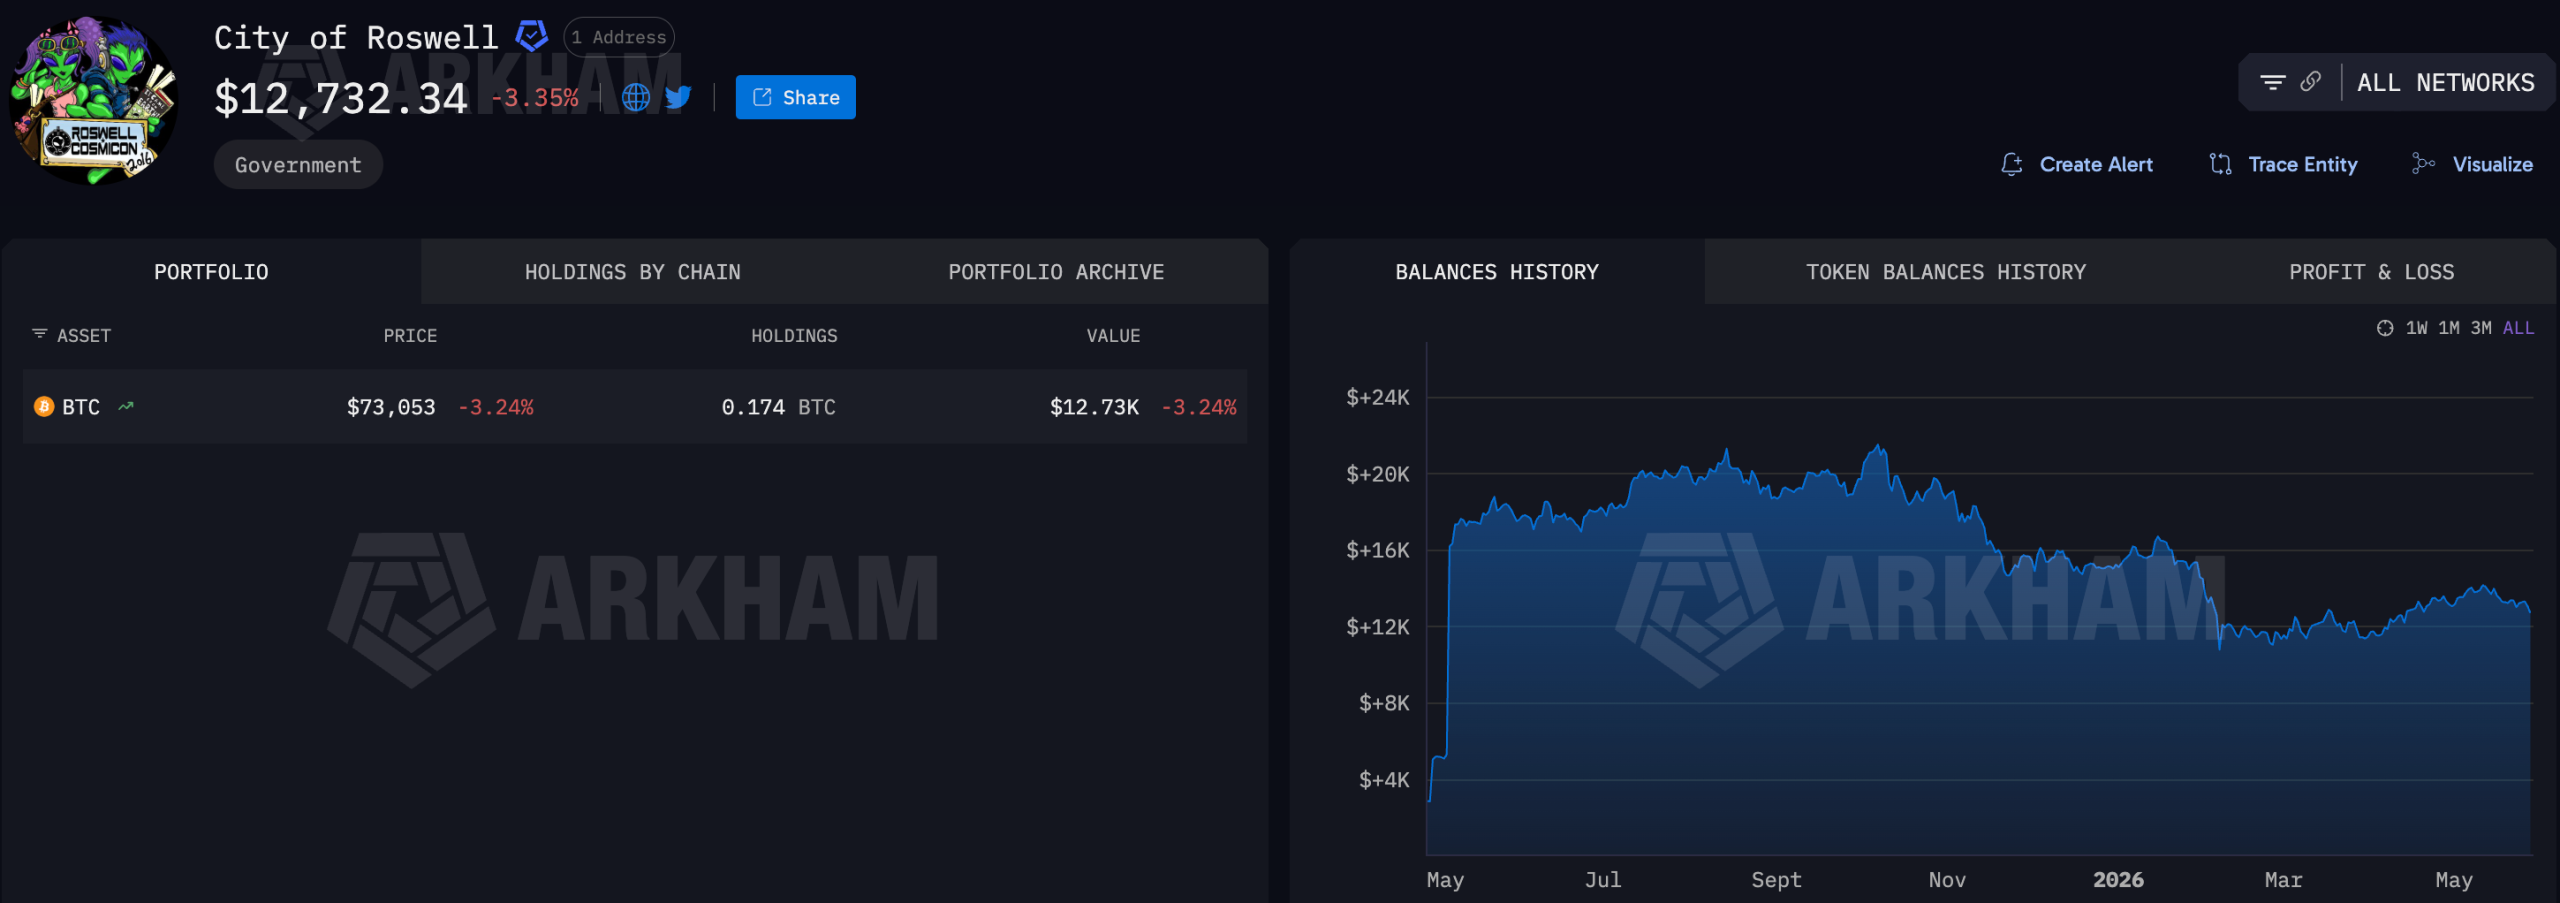
The City of Roswell, New Mexico, the small town synonymous with the 1947 Unidentified Flying Object (UFO) incident, now sits on a modest Bitcoin (BTC) stash. Blockchain analytics firm Arkham Intelligence flagged the holding in a public post this week.
The municipal wallet contains about 0.173 BTC, worth roughly $13,300 when Arkham revealed it. The funds arrived as donations last year and have stayed in a single address ever since, untouched by the city.
Inside Roswell’s On-Chain Stash
Arkham tagged the address as belonging to the City of Roswell and published its entity page through its intelligence tool. According to the firm, the donations were sent in 2025 and have stayed parked at the same address since.

The wallet has not pushed any funds out, suggesting either deliberate custody or simple inattention from city staff. Roswell officials have not commented publicly on who sent the Bitcoin or what they plan to do with it.
The town, home to 48,000 residents, has not flagged the holding in any public budget document. The dollar value Arkham cited reflects market levels at the time of the post and would shift with Bitcoin’s price.
A New Chapter for an Old UFO Story
Roswell’s link to extraterrestrial folklore dates back to July 1947, when a local rancher found metallic debris on his property. The Roswell Army Air Field initially described the wreckage as a flying disc. It retracted the statement the next day and called the find a weather balloon.
The town has built much of its identity, and most of its tourism economy, around alien iconography. The International UFO Museum and Research Center anchors a local industry built on the original story.
The Bitcoin holding adds a digital footnote to that lore. Arkham’s research team leaned into the framing, calling the donations a possible cypherpunk chapter in Roswell’s sci-fi history. Whether any of the senders identified themselves at the time remains unclear.
“Has the first extraterrestrial BTC stash been found?” Arkham teased.
Roswell joins a thin roster of US cities tied to on-chain Bitcoin activity. Miami’s Bitcoin adoption push leaned on a city-branded token rather than direct BTC custody. Most local governments hold no crypto at all.
At the federal level, the picture is larger. The Strategic Bitcoin Reserve order placed forfeited coins on the federal balance sheet. Arkham puts overall US government Bitcoin holdings near $24 billion.
Roswell’s stack is a rounding error against those figures. The story matters less for the amount than for the venue. The town is better known for tinfoil hats than treasury management.
The next question is whether Roswell ever spends the funds or leaves them to compound alongside its tourist economy. For now, the wallet sits where the donors left it, watched only by blockchain explorers and the occasional alien.
The post The UFO Capital of America Has a Bitcoin Wallet: Did Aliens Buy BTC? appeared first on BeInCrypto.

European currencies continue to trade within established ranges following the heightened volatility of recent weeks. Last week, both EUR/USD and GBP/USD declined before staging a recovery; however, the pairs are once again testing important support levels without developing a sustained directional impulse. Market participants remain cautious amid the absence of fresh geopolitical catalysts and ahead of key macroeconomic data releases from the United States.
Investor attention is primarily focused on the publication of US core Personal Consumption Expenditures (PCE) data, GDP figures, and durable goods orders. These indicators could significantly influence expectations regarding future Federal Reserve policy and determine the next direction for the dollar. Additional market influence is also coming from comments by Bank of England officials and European data on business activity and consumer confidence.
EUR/USD
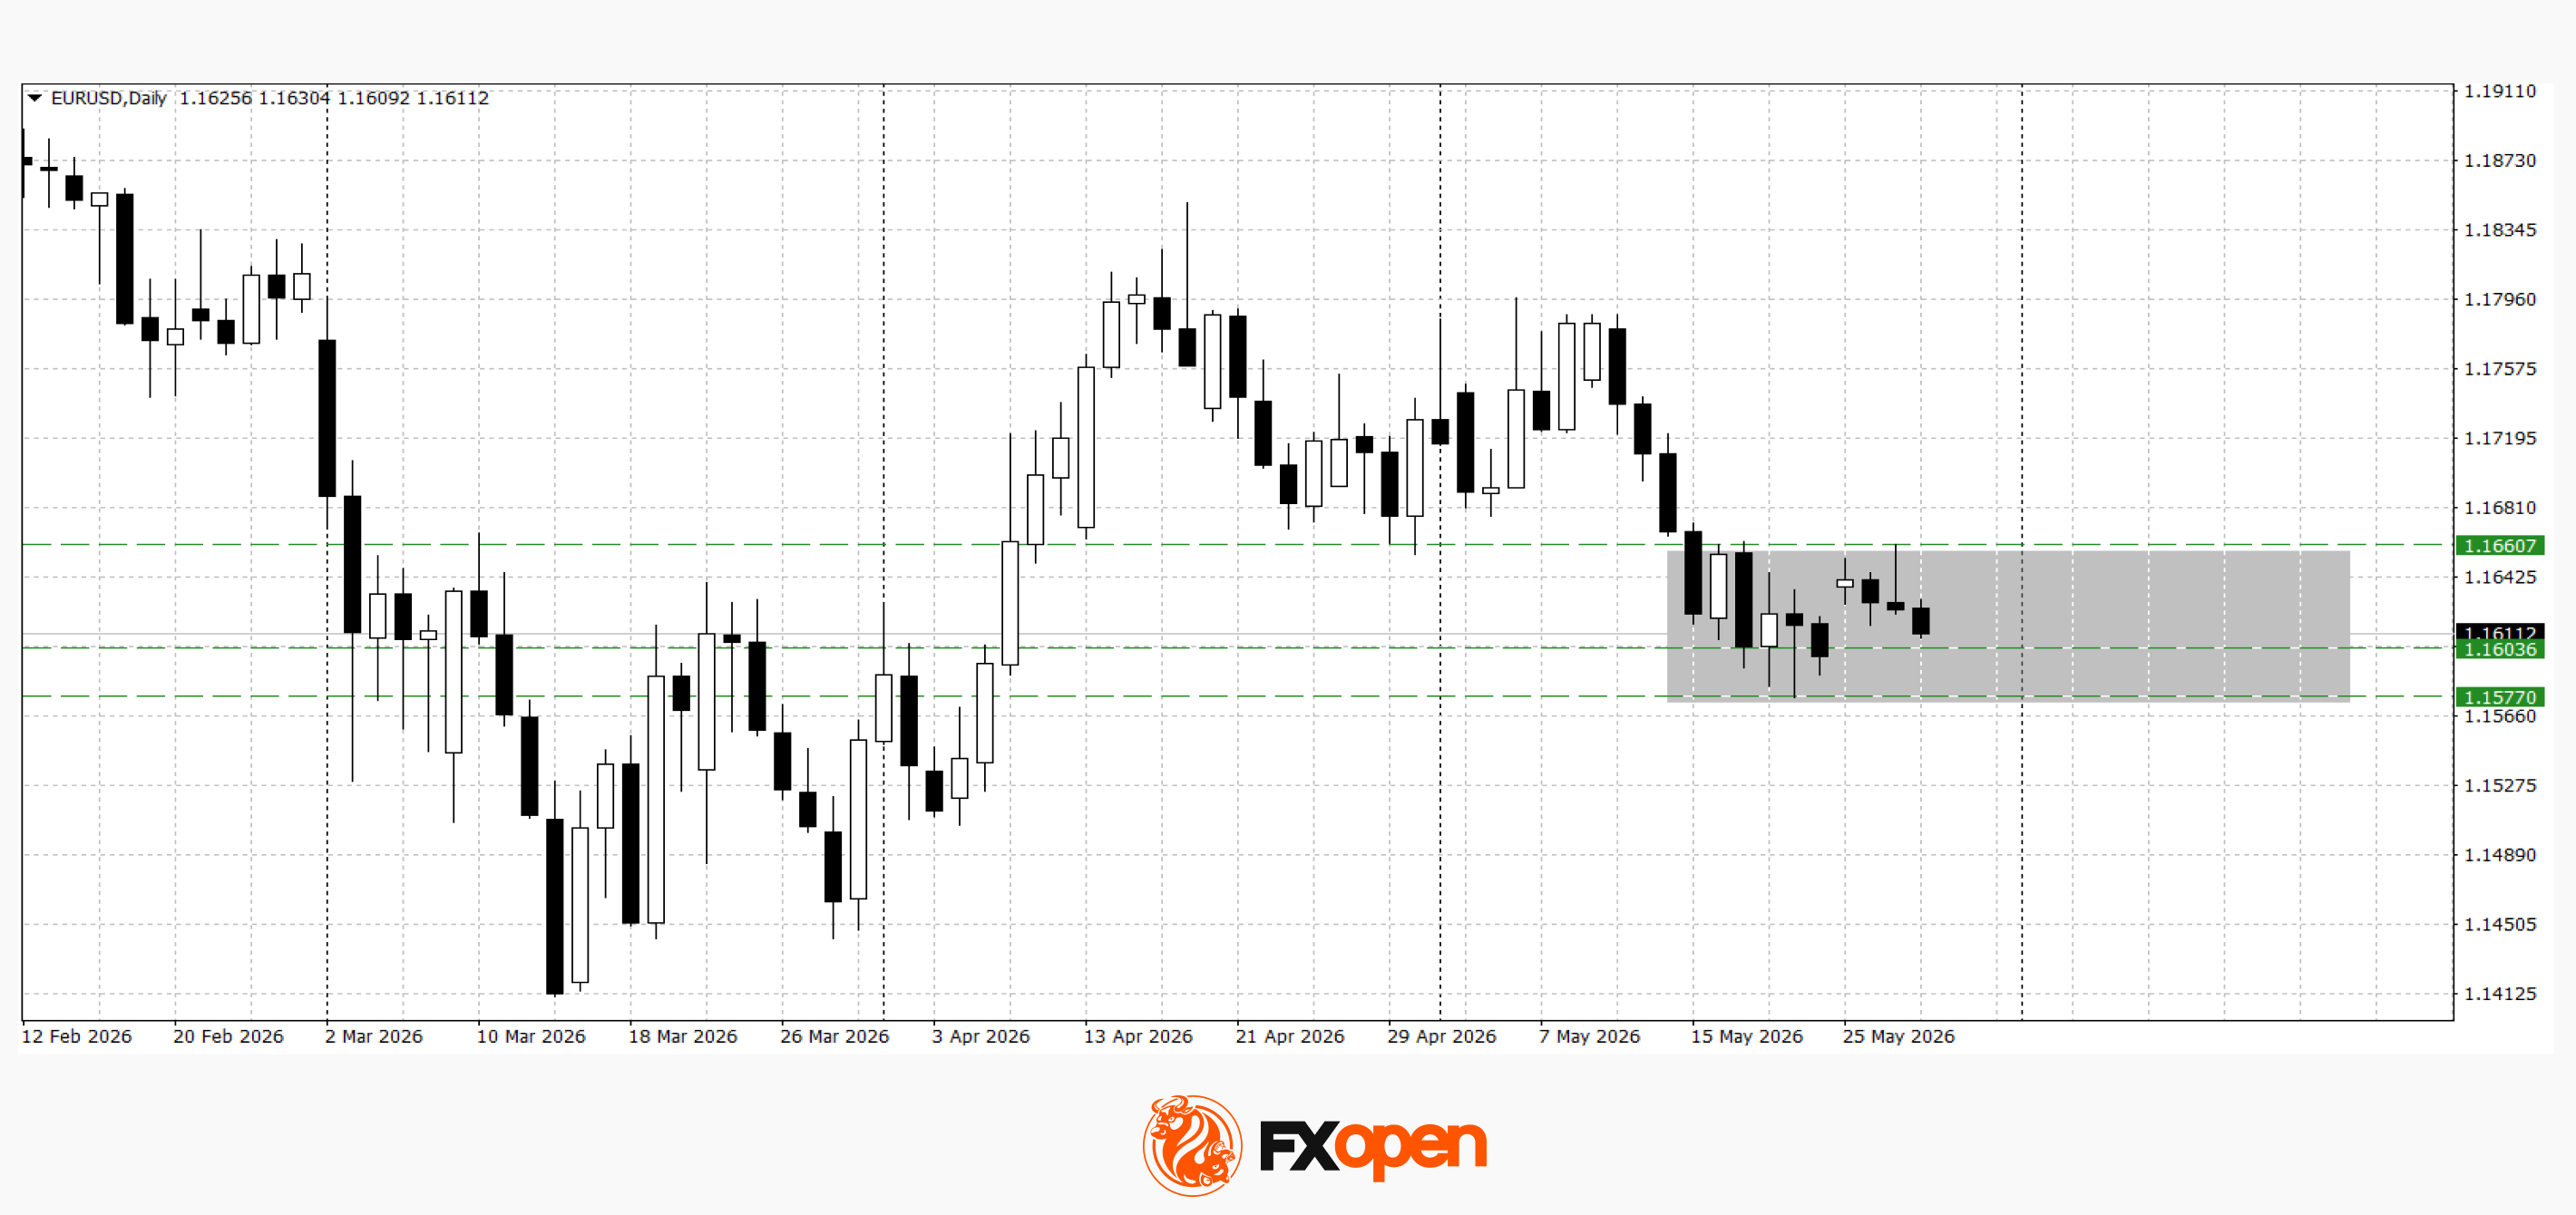
EUR/USD continues to display sideways dynamics within the 1.1600–1.1660 range. Technical analysis of EUR/USD points to the possibility of a retest of last week’s low near 1.1570 should 1.1600 shift into resistance territory. A resumption of upward movement would only become likely after a confident break and consolidation above 1.1660.
Key events for EUR/USD:
- today at 11:00 (GMT+3): Italian consumer confidence index;
- today at 13:00 (GMT+3): Spanish business confidence index;
- today at 15:30 (GMT+3): US core Personal Consumption Expenditures (PCE) price index.
GBP/USD
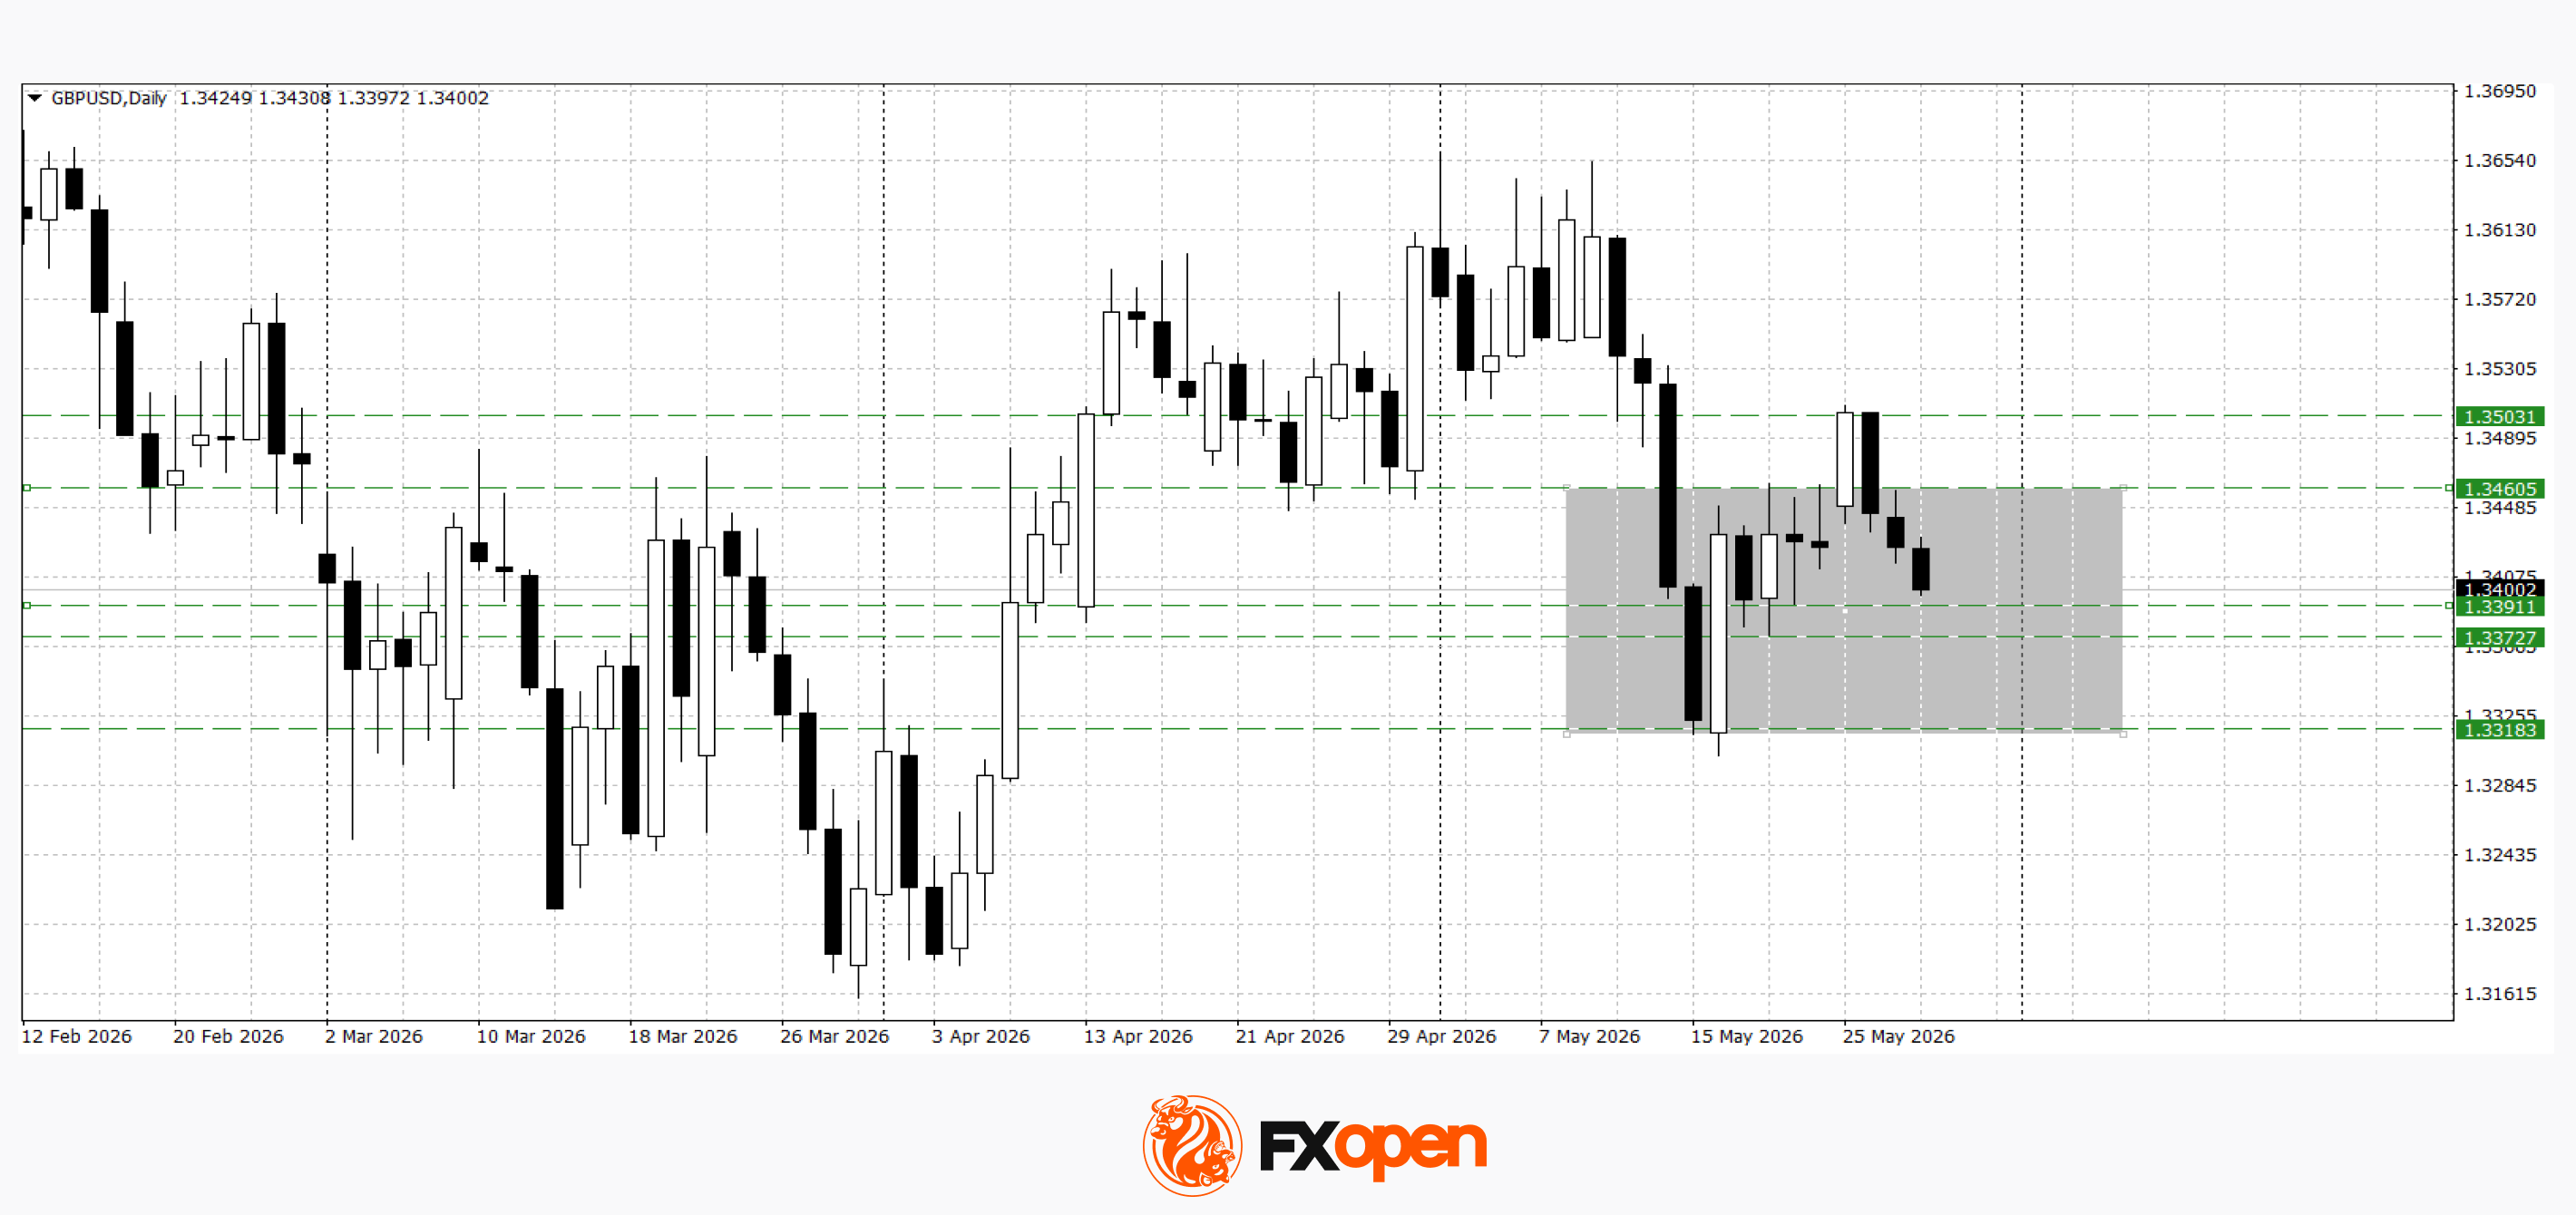
Following an upward correction, GBP/USD has once again come under pressure. However, the recent low near 1.3300 remains intact, preserving the likelihood of continued range-bound trading. Technical analysis of GBP/USD indicates the possibility of a test of the nearest support zone at 1.3370–1.3390. A break below this area could lead to a decline towards 1.3300, while a confident rebound from it may return the pair to the 1.3460–1.3500 range.
Key events for GBP/USD:
- today at 11:05 (GMT+3): speech by Bank of England Financial Policy Committee member Sarah Breeden;
- today at 15:30 (GMT+3): US GDP data;
- today at 17:00 (GMT+3): US new home sales.
Overall, EUR/USD and GBP/USD continue to trade in conditions of range-bound price action and subdued market activity. The further direction of European currencies will depend on the release of key US economic data, comments from central bank officials, and the broader dynamics of geopolitical risks across global markets.
Trade over 50 forex markets 24 hours a day with FXOpen. Take advantage of low commissions, deep liquidity, and spreads from 0.0 pips (additional fees may apply). Open your FXOpen account now or learn more about trading forex with FXOpen.
This article represents the opinion of the Companies operating under the FXOpen brand only. It is not to be construed as an offer, solicitation, or recommendation with respect to products and services provided by the Companies operating under the FXOpen brand, nor is it to be considered financial advice.
Crypto World
XRP Price Falls Below $1.30, But Expert Says Something “Is Happening, The SEC is Doing it”

XRP price is falling, with more than 3% drop in a day as it is trading at $1.29. The $1.30 support zone, long treated as the floor of this corrective cycle, has cracked under sustained selling pressure. But at least one analyst thinks the real story isn’t on the XRP chart at all, it’s in Washington.
Finance expert Levi Rietveld went viral this week after posting on X: “I TOLD YOU XRP FAM!!!! ITS HAPPENING!!!! THE SEC IS DOING IT!!!,” attaching a video in which he argued the Federal Reserve is preparing to inject an initial $7 billion into the economy next week as the opening move of a quantitative easing cycle.
Rietveld contends that coordinated liquidity expansion across the U.S., China, and Europe would dramatically expand global M2 money supply, pushing capital into risk assets, including crypto. When more dollars circulate, investors chase yield further out on the risk curve.
Whether or not the Fed delivers, XRP’s price structure has deteriorated meaningfully over the past 48 hours.
Discover: The Best Crypto to Diversify Your Portfolio
Can XRP Price Reclaim $1.35?
The 89% bearish sentiment reading, paired with an Extreme Fear score of 25 on the Fear & Greed Index, captures the mood precisely. XRP has shed 10% over the last 2 weeks and sits a long way from its $3.65 peak.
Trading volume has jumped to above $2 billion, but mostly coming from sellers dumping the coin.
Technically, XRP has broken down from a triangle/pennant formation, lost the $1.35 pivot, and is now falling from the $1.30–$1.32 demand zone that previously launched a strong upside impulse. The 50-day moving average is declining, and the price is printing lower lows in a classic bearish market structure.

$1.30 is the neckline of a head-and-shoulders pattern, a close below that level could trigger an 18% measured move toward the $1.12–$1.20 area, and it’s now happening.
If today closes below $1.30, this would likely confirm a prolonged breakdown, opening downside targets at $1.20 and potentially $1.10 if selling accelerates.
Discover: The Best Token Presales
Bitcoin Hyper Attracts Rotation Capital
Watching a position bleed 10% in a month has a way of clarifying priorities. For traders reassessing exposure at current XRP levels, where upside to meaningful resistance at $1.60 is roughly 20% and downside risk to $1.10 is just as wide, the risk-reward calculus looks uncomfortably symmetrical.
That’s the moment early-stage infrastructure players start attracting attention. As XRP struggles to recover, capital is visibly rotating into higher-beta opportunities.
Bitcoin Hyper ($HYPER) is one presale drawing that flows. It positions itself as the first-ever Bitcoin Layer 2 with Solana Virtual Machine (SVM) integration, delivering sub-second finality and low-cost smart contract execution on top of Bitcoin’s security layer, targeting performance metrics that exceed Solana.
The presale has raised $32 million at a current token price of $0.0136, with a huge 36% APY staking rewards active for early participants. The Decentralized Canonical Bridge enables native BTC transfers into the ecosystem without wrapped-token counterparty risk.
Research Bitcoin Hyper before the current presale stage closes.
The post XRP Price Falls Below $1.30, But Expert Says Something “Is Happening, The SEC is Doing it” appeared first on Cryptonews.
Crypto World
Critical Pi Network (PI) Update, Ripple (XRP) Price Crash, and Altcoins in Danger: Bits Recap May 28
The past 24 hours were very eventful, especially in the altcoin scene, which saw many cryptocurrencies plummet amid a weakening broader market and escalating military tensions in Iran.
As CryptoPotato reported, the US struck down Iranian drones, and Iran retaliated by striking a US base in Kuwait. All in all, the ceasefire has been openly breached and put in question, resulting in turmoil across both legacy and crypto markets.
Let’s have a look at some important events concerning Pi Network, Ripple’s XRP, and a few other altcoins that took place very recently.
Critical Pi Network Update: Here’s What You Need to Know
According to an official post from yesterday, the underlying blockchain protocol behind Pi Network is currently undergoing an upgrade. This means that every single node running on the mainnet has to upgrade to v24.
The Pi Mainnet is upgrading to Protocol 24 – Deadline: June 2.
The Pi Mainnet has successfully upgraded to Protocol 23. All Mainnet nodes are required to complete this step before the deadline to remain connected to the network.
Details here: https://t.co/9VehO7hhj1
— Pi Network (@PiCoreTeam) May 27, 2026
The deadline for this is June 2nd, 2026. The developers also recommend that operators shouldn’t upgrade all of their nodes at once, and to divert traffic during the process to other nodes.
Per the provided documentation, the upgrade itself should be very quick.
“Internal data migrations are quick. Expected downtime is less than 15 minutes.”
It’s worth noting, though, that nodes that fail to upgrade risk being disconnected from the canonical chain, which could cause broader network instability.
Ripple’s XRP Tumbles 3.5%
The entire crypto sector is down today, and XRP is no exception. The altcoin plunged by 3.5%, dropping below $1.27 before recovering slightly.

There is no local catalyst for the move, and it follows the broader market very closely. It’s also worth noting that the trading volume increased considerably during the downturn. It’s up more than 42% over the past 24 hours, at $2.44 billion.
On the other hand, fundamentals associated with the XRP Ledger are seemingly improving, with new proposals aiming to augment the way pools are deployed already underway. The idea is to give more flexibility to pool deployers and developers that would better correspond to the constantly shifting market conditions.
Altcoins Stress Test: US Gov’t About to Dump?
Last but not least for this recap, Arkham Intelligence flagged an on-chain move associated with holdings of the US Government.
“The US Government just moved $1.9 million of Alameda funds. The USG seized $13 million of Alameda’s assets from Binance over 3 years ago. They just moved $1.89M of RNDR, UNI, SAND, MASK, and AXS to Coinbase Prime. Are they about to sell the seized funds?”
The US Government just moved $1.9 Million of Alameda funds.
The USG seized $13M of Alameda’s assets from Binance over 3 years ago. They just moved $1.89M of RNDR, UNI, SAND, MASK and AXS to Coinbase Prime.
Are they about to sell the seized funds? pic.twitter.com/vHzgeZKybu
— Arkham (@arkham) May 27, 2026
It’s worth noting that the size is not considerable, and most of the mentioned altcoins do have market depth to absorb any potential sales. However, investors might think of any disposals as a show of no confidence, which could lead to subsequent negativity. Time will tell.
The post Critical Pi Network (PI) Update, Ripple (XRP) Price Crash, and Altcoins in Danger: Bits Recap May 28 appeared first on CryptoPotato.
The ICT Turtle Soup is a price action strategy built around false breakouts. It targets failed moves at major support and resistance levels across forex and other markets. Turtle Soup trading focuses on liquidity sweeps that trap breakout traders before price reverses. It uses the reversal that often follows a stop run for entry timing.
This article covers the Turtle Soup forex setup along with its core components. Let’s discuss the conditions traders watch for and the entry framework that goes with them.
What Is the ICT Turtle Soup Pattern?
The ICT Turtle Soup is a reversal approach based on failed breakouts at key support and resistance levels. This forex reversal strategy comes from the Inner Circle Trader (ICT) methodology and frames failed moves as setups.
Traders aim to identify and take advantage of situations where the price briefly moves beyond a major support or resistance level, only to reverse direction shortly after. This movement is often seen in ranging markets where prices oscillate between established highs and lows.
The concept behind ICT Turtle Soup trading is rooted in the idea of stop hunts and market imbalances. When the price breaks out, it often triggers stop-loss orders set by other traders, creating a temporary imbalance. A failed breakout occurs when price returns inside the prior range after sweeping a swing level.
The ICT Turtle Soup strategy seeks to capitalise on this by entering trades in the opposite direction once the breakout fails and the price returns to its previous range.
The ICT version adapts the original Turtle Soup setup from Linda Raschke and Larry Connors. In the ICT strategy, forex traders apply it on intraday charts using liquidity and order flow, not fixed 20-day breakout rules.
Typically, traders look for signs of a false breakout. This often shows as price briefly moving above a recent high or below a recent low. Price then fails to sustain the move.
ICT Turtle Soup vs Breakout Strategies
The Turtle Soup strategy and standard breakout trading sit on opposite sides of the same setup. Breakout traders typically enter when price clears a high or low, expecting momentum to continue. ICT Turtle Soup traders wait for that move to fail, then look to position in the opposite direction.
The choice between Turtle Soup vs a breakout strategy depends on the prevailing market context. Breakouts typically work in trending conditions where buying or selling momentum drives continuation. Turtle soup setups work around range edges where liquidity sits and breakouts often fail.
Core Elements of the ICT Turtle Soup Setup
The ICT Turtle Soup setup uses several elements working together to identify failed breakouts. Each element provides context for where price might sweep liquidity before reversing back inside the prior range.
The core elements traders typically work with include:
- Order flow and market structure across higher and lower timeframes
- Liquidity and stop hunts at swing highs and swing lows
- Internal and external liquidity zones inside the range
- Order blocks and imbalances as supportive context
Each element below shows how price typically reacts during a Turtle Soup trading setup.
Order Flow and Market Structure
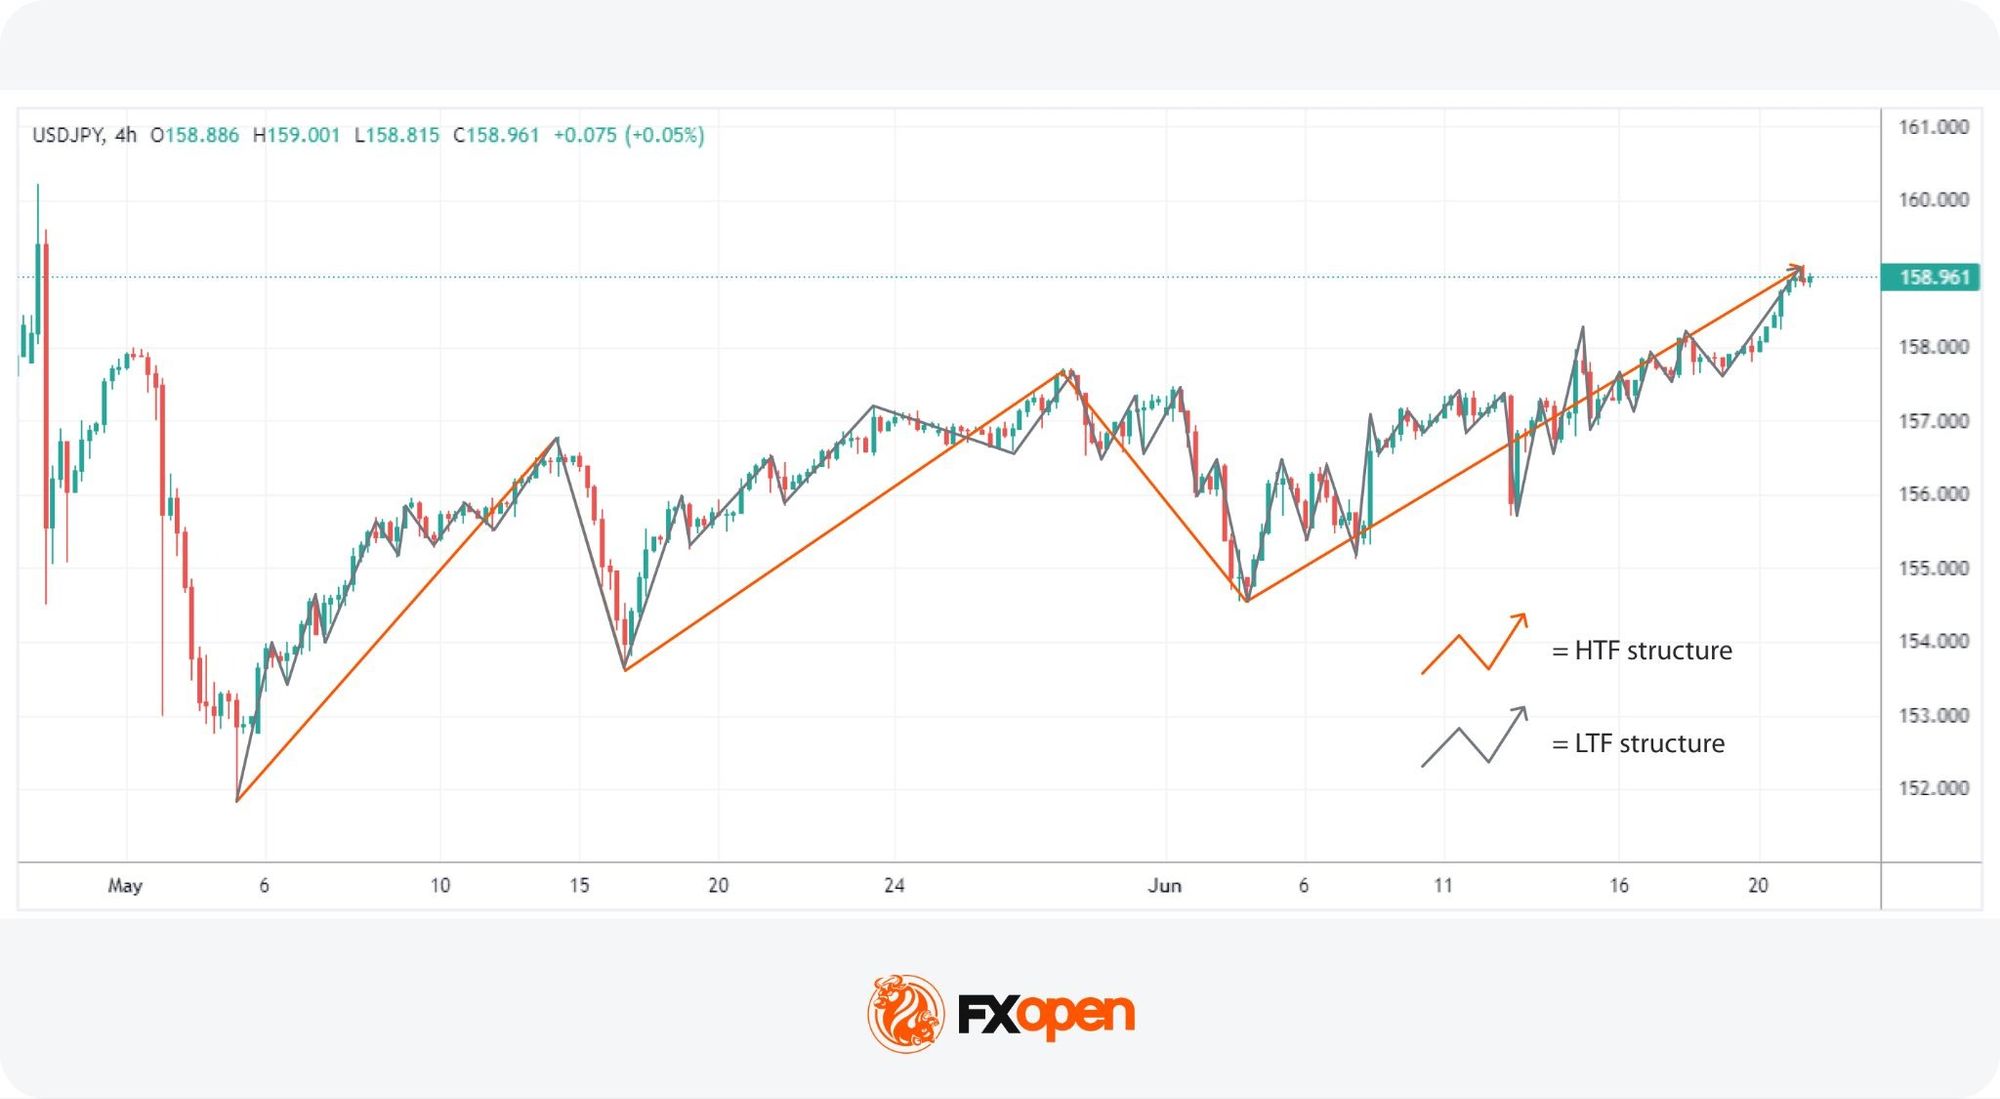
Order flow and market structure are critical in analysing the ICT Turtle Soup pattern. This involves observing price movements and traders’ behaviour in different timeframes.
Order flow refers to the sequence of buying and selling activity that drives price. Market structure organises that activity into recognisable patterns of highs and lows. Together, they describe the directional bias of a market.
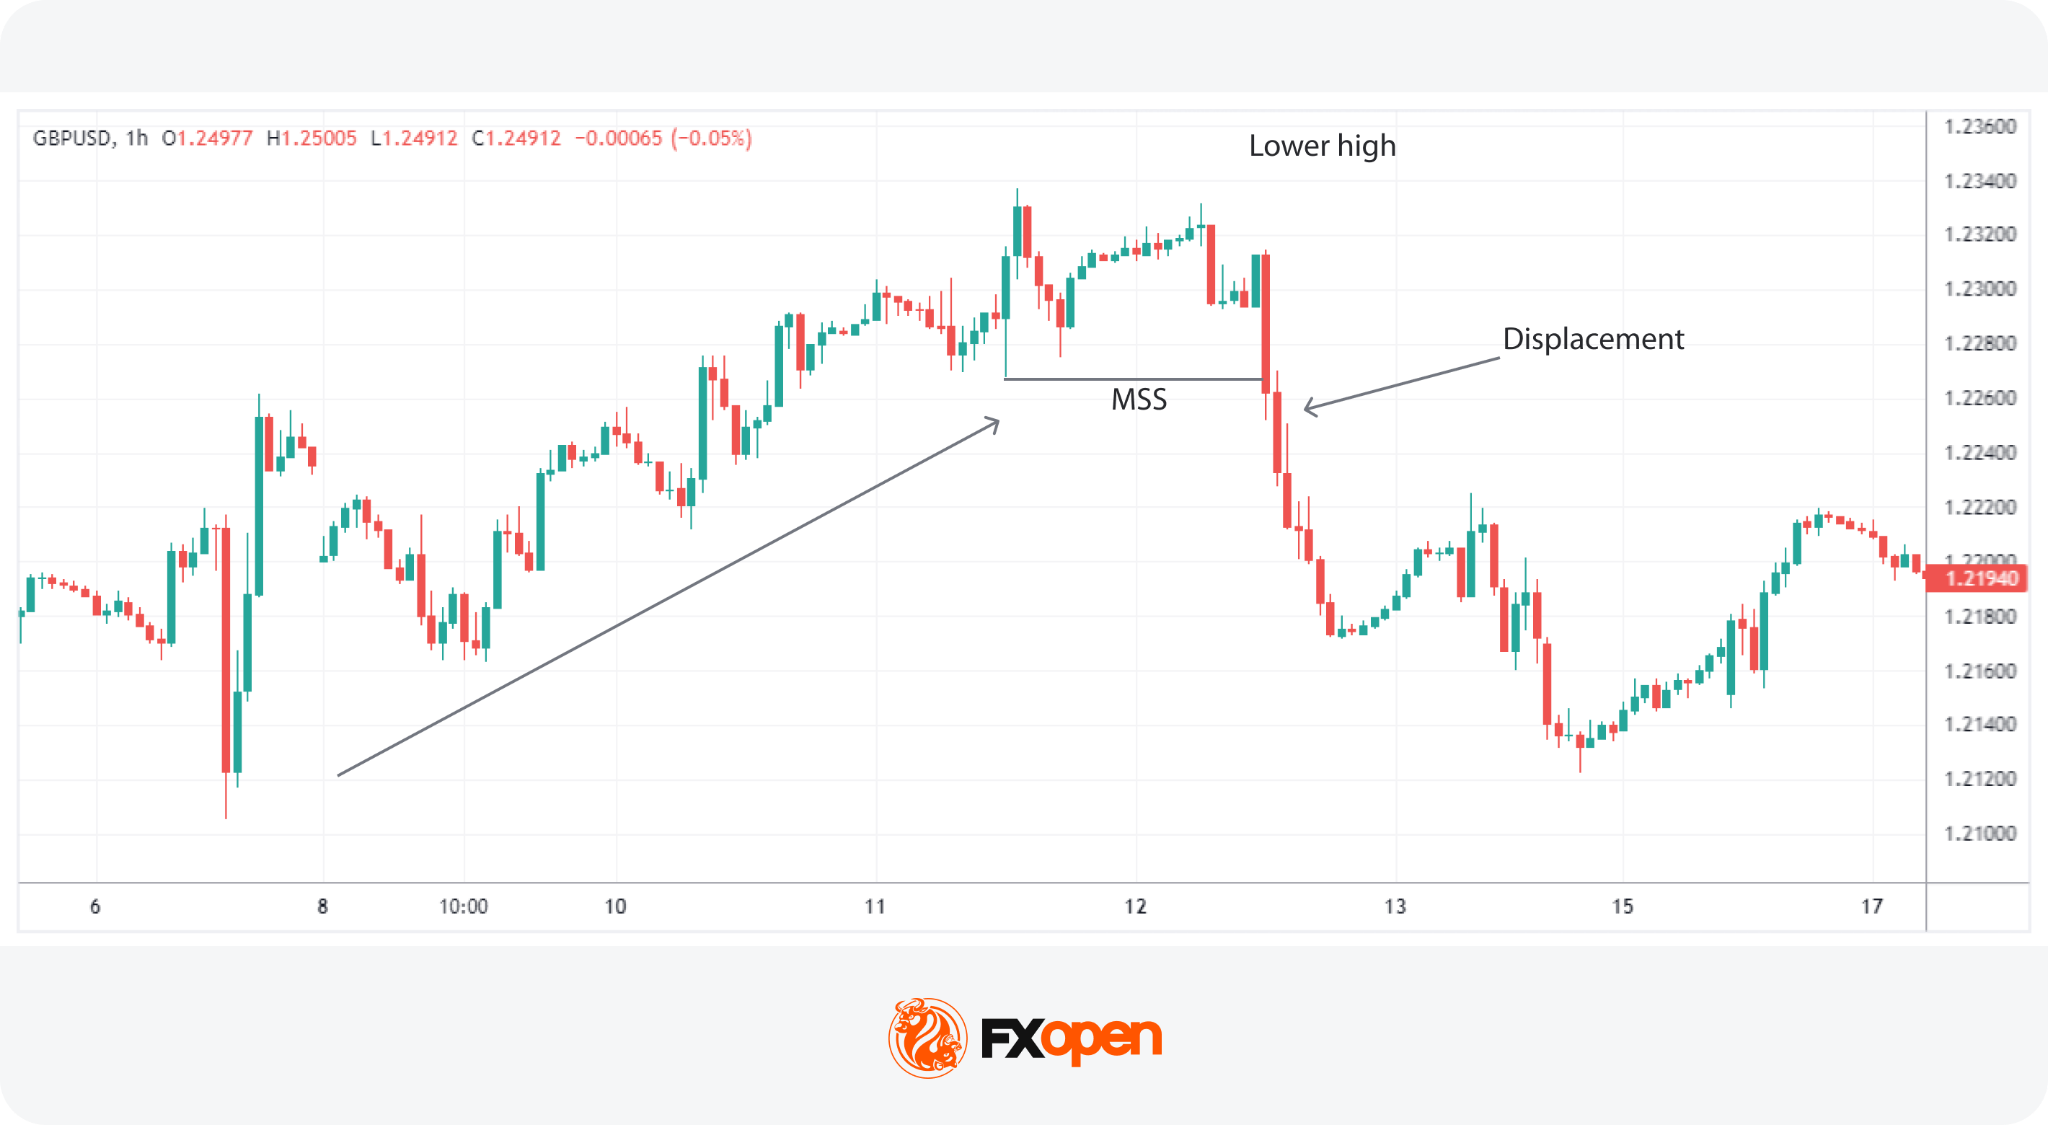
Traders also track a Market Structure Shift (MSS), which signals a potential change in trend direction. An MSS appears when price breaks an opposing swing point with displacement. Displacement here means a strong, single-direction candle that closes well beyond the broken level.
If you want to analyse higher and lower timeframe price movements, consider using FXOpen’s TickTrader platform.
Higher Timeframe Structure
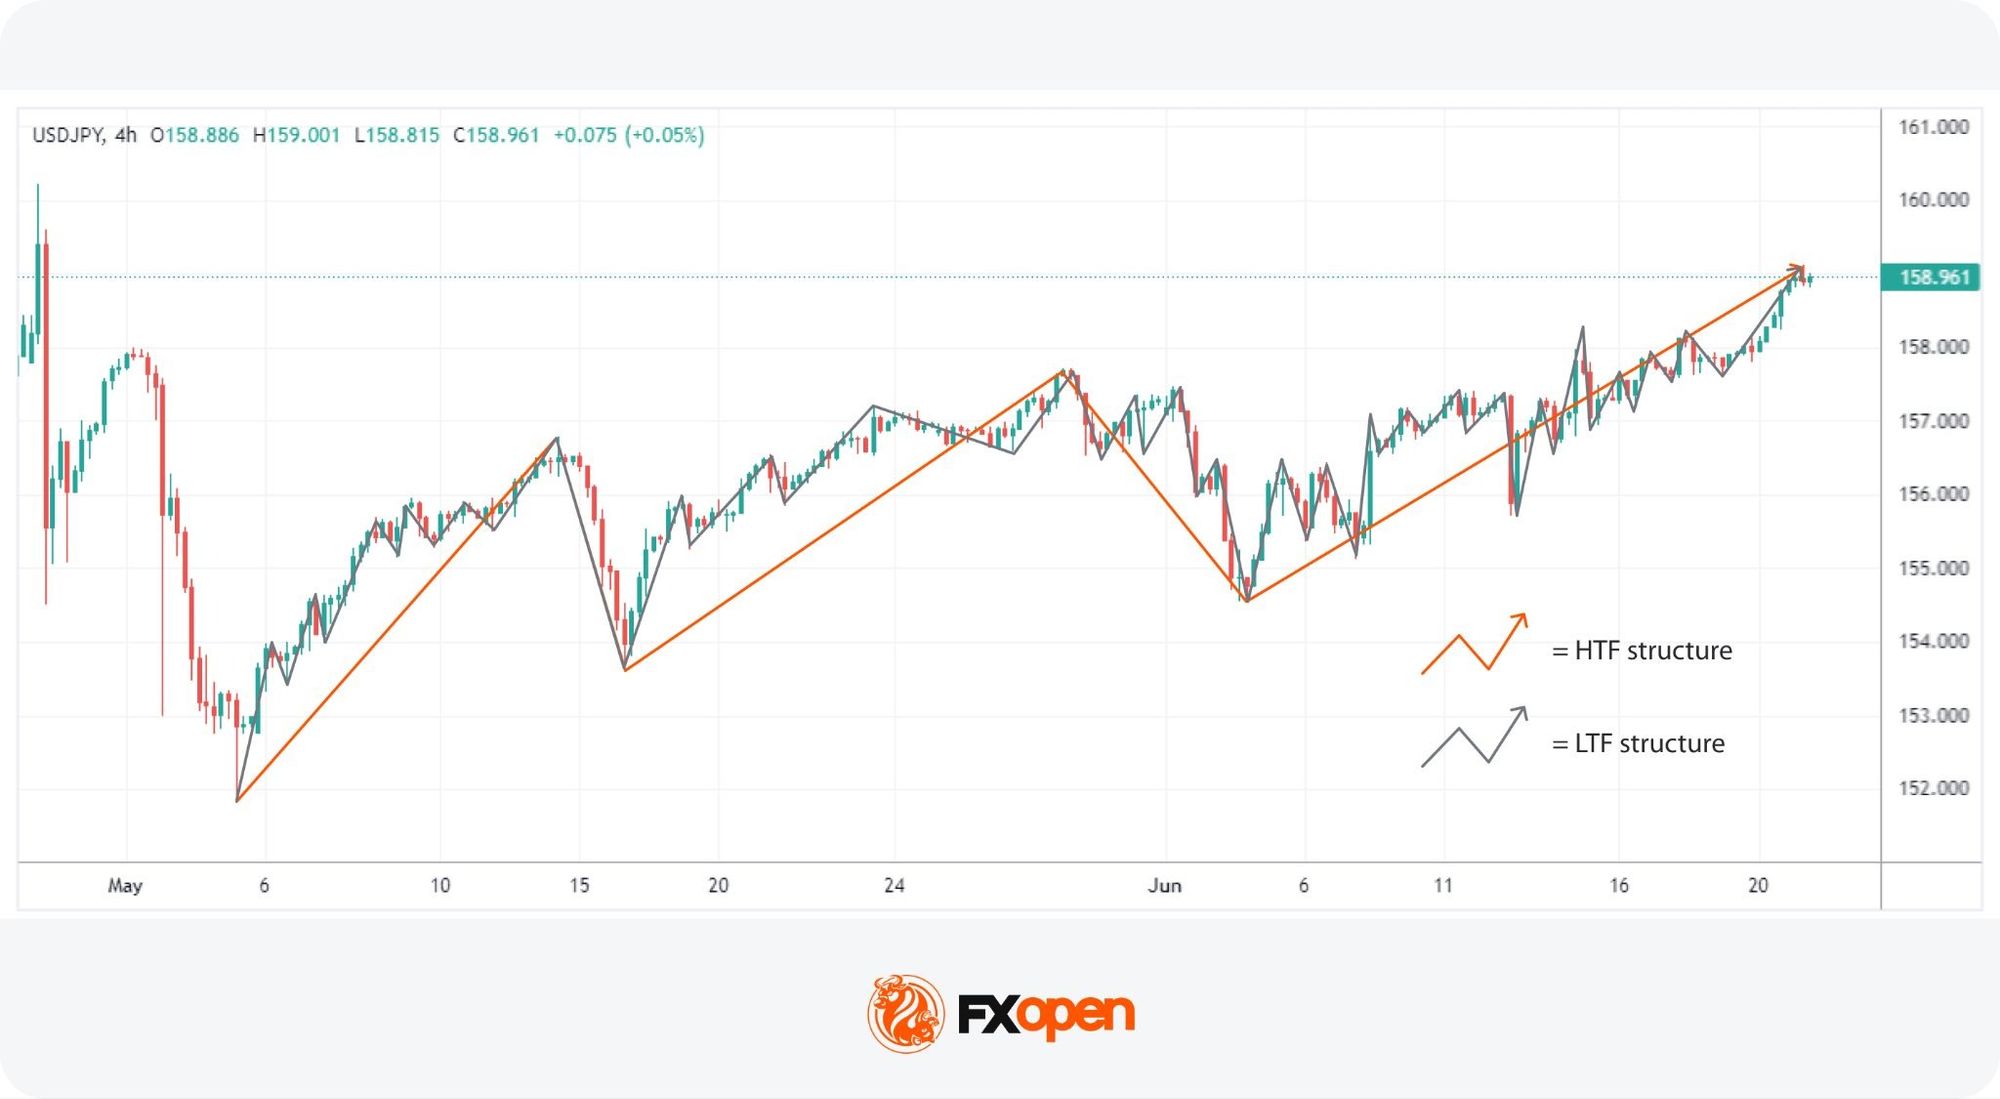
This refers to the broader trend governing the lower timeframe trend. For traders using the 15m-1h charts to trade, this might mean structure visible on 4h or 1d charts.
Higher timeframe structures may help traders identify the major support and resistance levels. These levels are important as they mark the boundaries within which the market generally oscillates. Traders use these to determine the prevailing market direction and potential areas where false breakouts (stop hunts) are likely to occur.
This higher timeframe view sets the directional bias for the Turtle Soup setup. A market making higher highs and higher lows suggests a bullish bias, where traders typically look for long-side setups after liquidity sweeps below swing lows. The reverse applies in a bearish structure of lower highs and lower lows.
Lower Timeframe Structure
Lower timeframe structures are examined on hourly or minute charts. These provide a more detailed view of price action within the higher timeframe’s range. They also account for the bullish and bearish legs that dictate a broader higher timeframe trend.
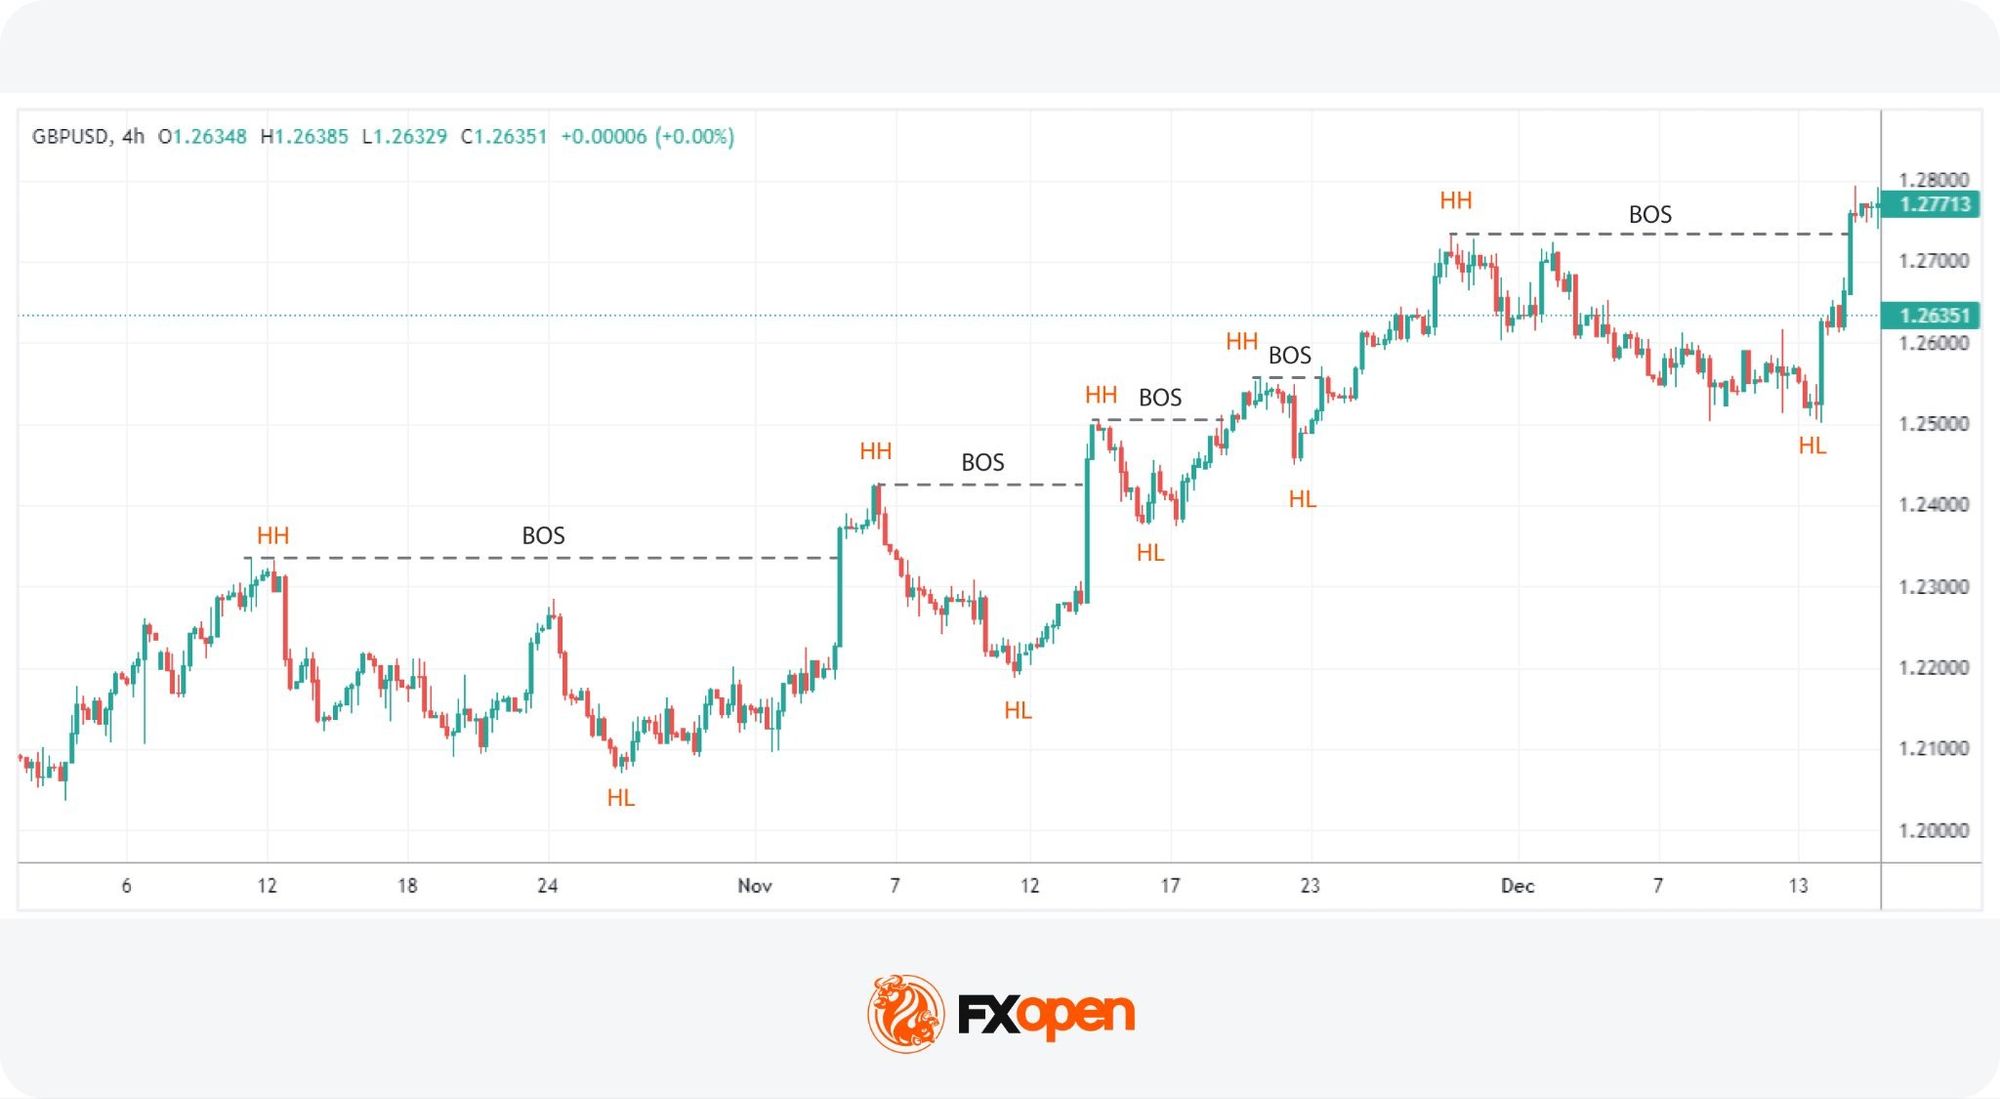
On these charts, traders watch for a Break of Structure (BOS) that aligns with the higher timeframe bias. A BOS occurs when price breaks a recent swing high or low in the trend’s direction. Displacement supports the move when a strong candle closes well beyond that swing point with limited pullback.
Together, these signals confirm the lower timeframe is aligning with the Turtle Soup setup bias.
Liquidity and Stop Hunts
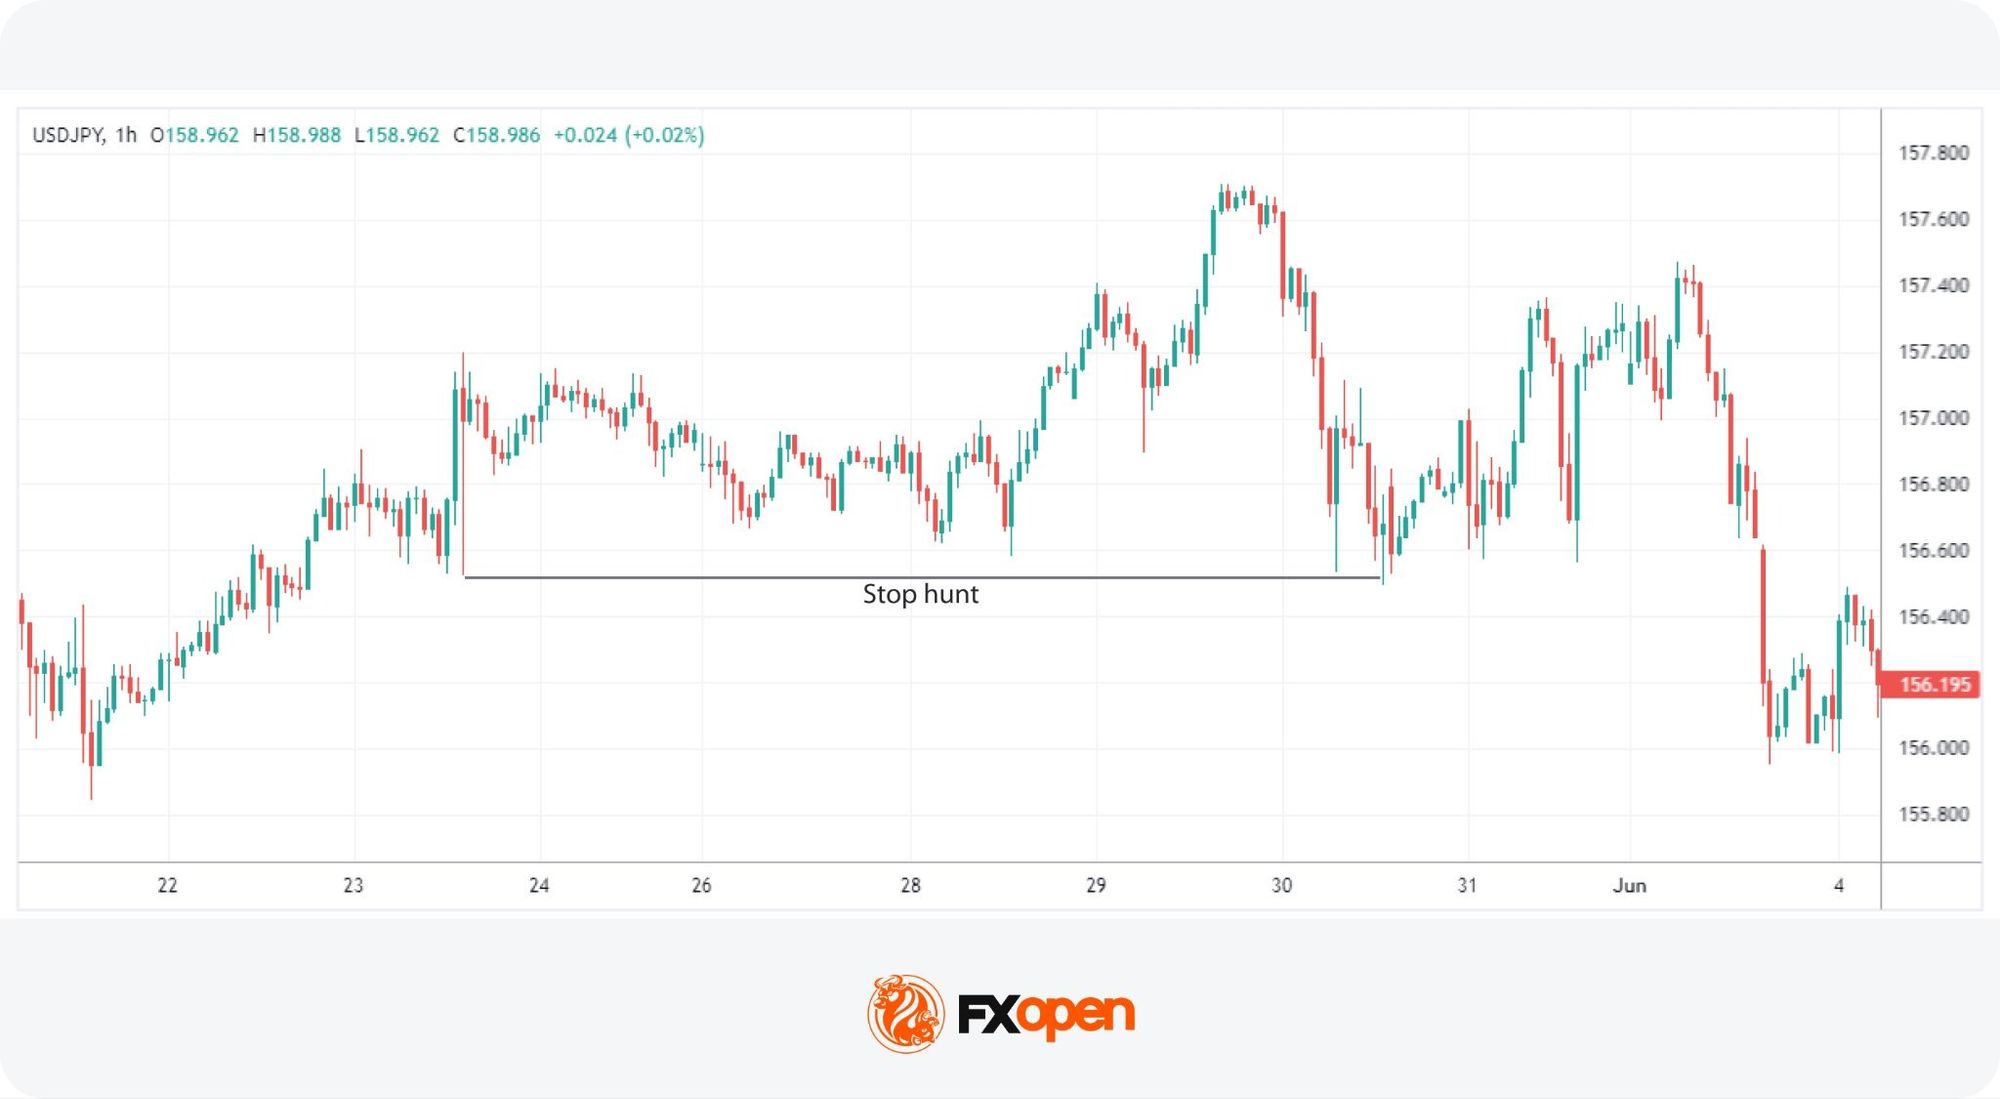
In general trading terms, liquidity represents how easy it is to enter or exit a market. However, in the context of the ICT Turtle Soup pattern, areas of liquidity can be identified beyond key swing points.
These pools of stop-loss orders sit just above swing highs and just below swing lows. These orders are ready to be triggered if price reaches the level.
Stop hunts in trading, also known as a liquidity sweep or stop run, are central to Turtle Soup setups. They occur when price moves through a resistance or support level, triggering clustered stop-loss orders that sit beyond. Triggered stops create a liquidity spike that allows price to reverse back into the range. Traders applying the ICT Turtle Soup strategy typically position against the initial breakout direction once that liquidity has been swept.
Internal and External Liquidity
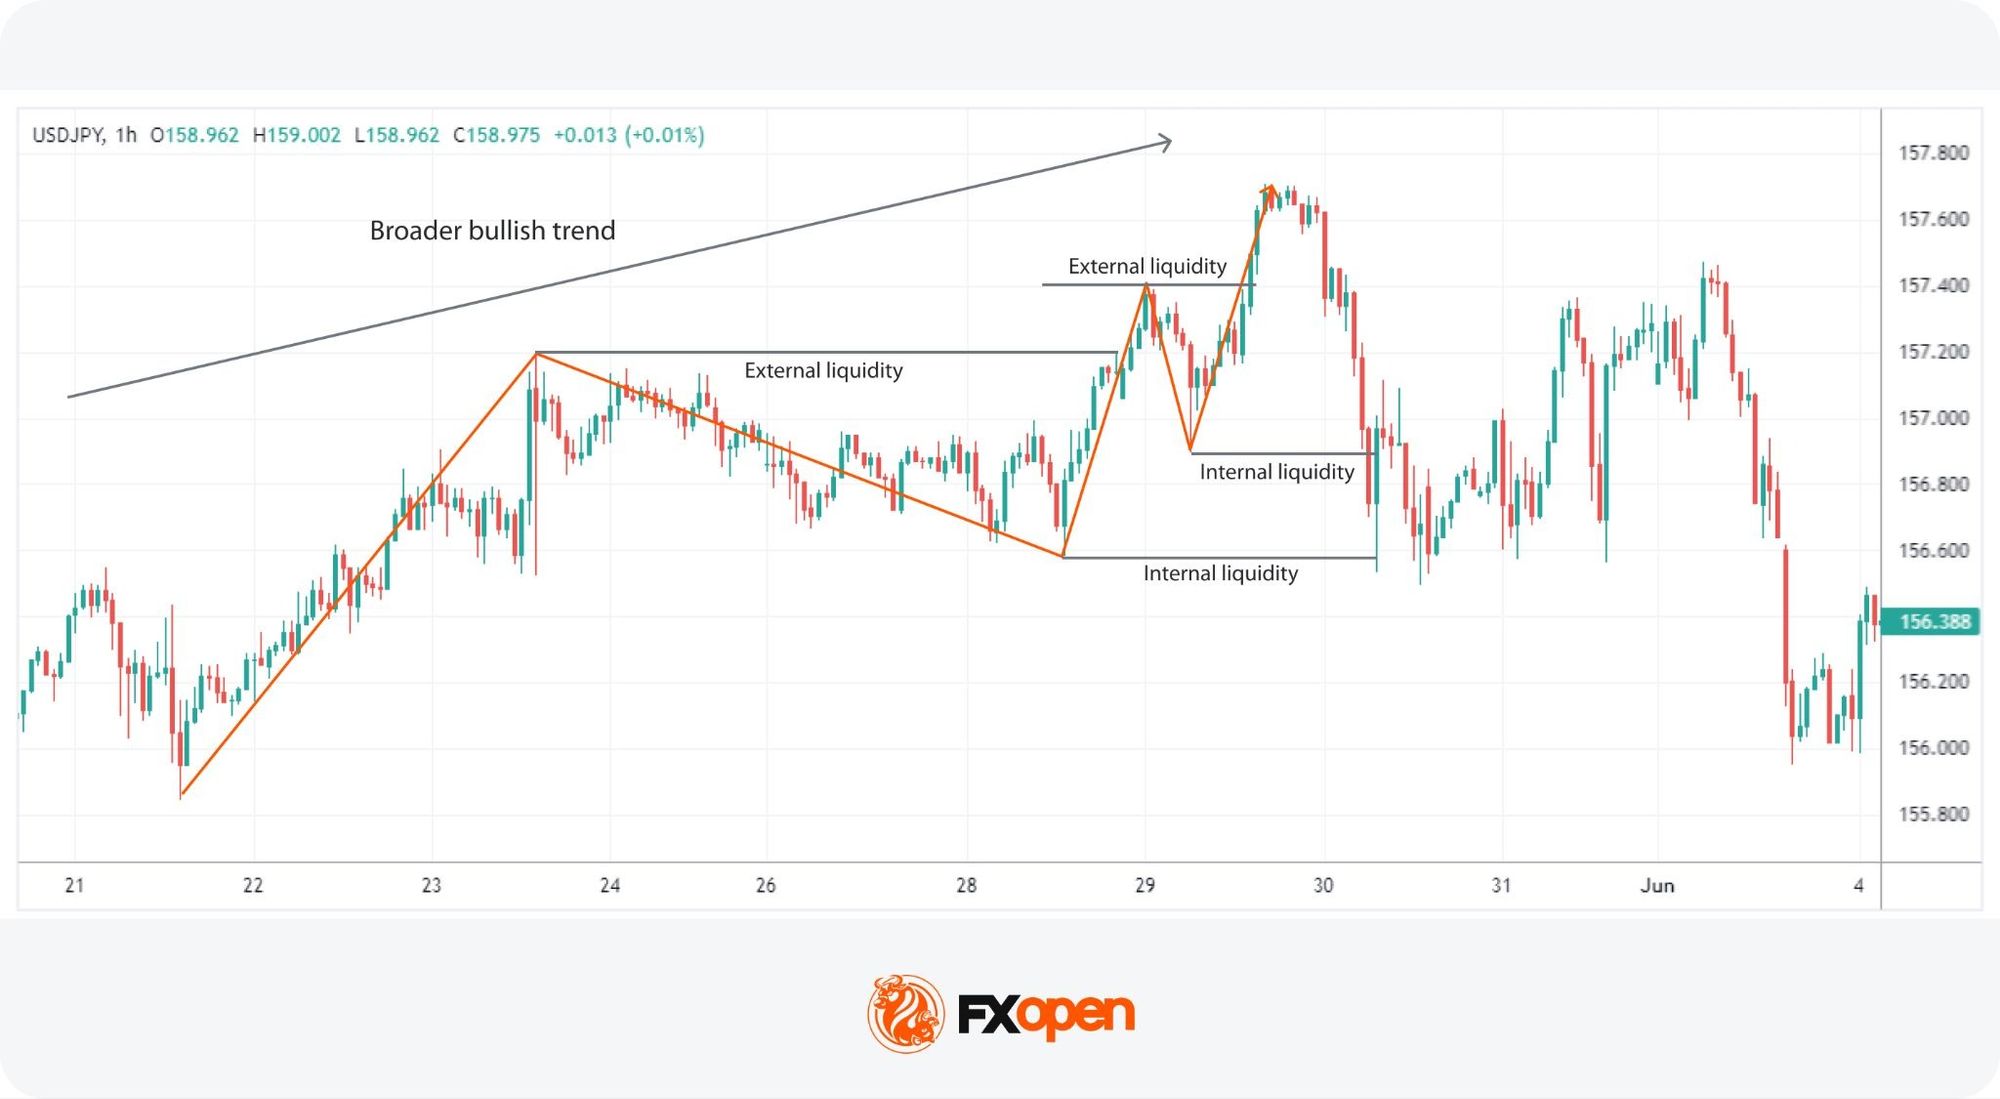
Internal and external liquidity sit on opposite sides of the higher timeframe range. Identifying both is central to Turtle Soup forex setups, since each plays a different role.
Internal liquidity refers to the liquidity available within the range of the higher timeframe structure. It involves identifying smaller support and resistance levels within the larger range. In a bullish leg, internal liquidity rests beneath each higher low. In a bearish leg, it sits above each lower high. This internal liquidity is often swept to start a counter-move within the broader trend.
External liquidity involves liquidity that exists outside the major highs and lows of the higher timeframe trend. The swing low where a bullish leg started is one external liquidity zone. The swing high where a bearish retracement began is another external liquidity zone.
Quick reference:
- Internal liquidity: inside the higher timeframe range, beneath higher lows (bullish) or above lower highs (bearish).
- External liquidity: outside the higher timeframe range, at the extremes that defined the leg.
Context Tools: Order Blocks and Imbalances
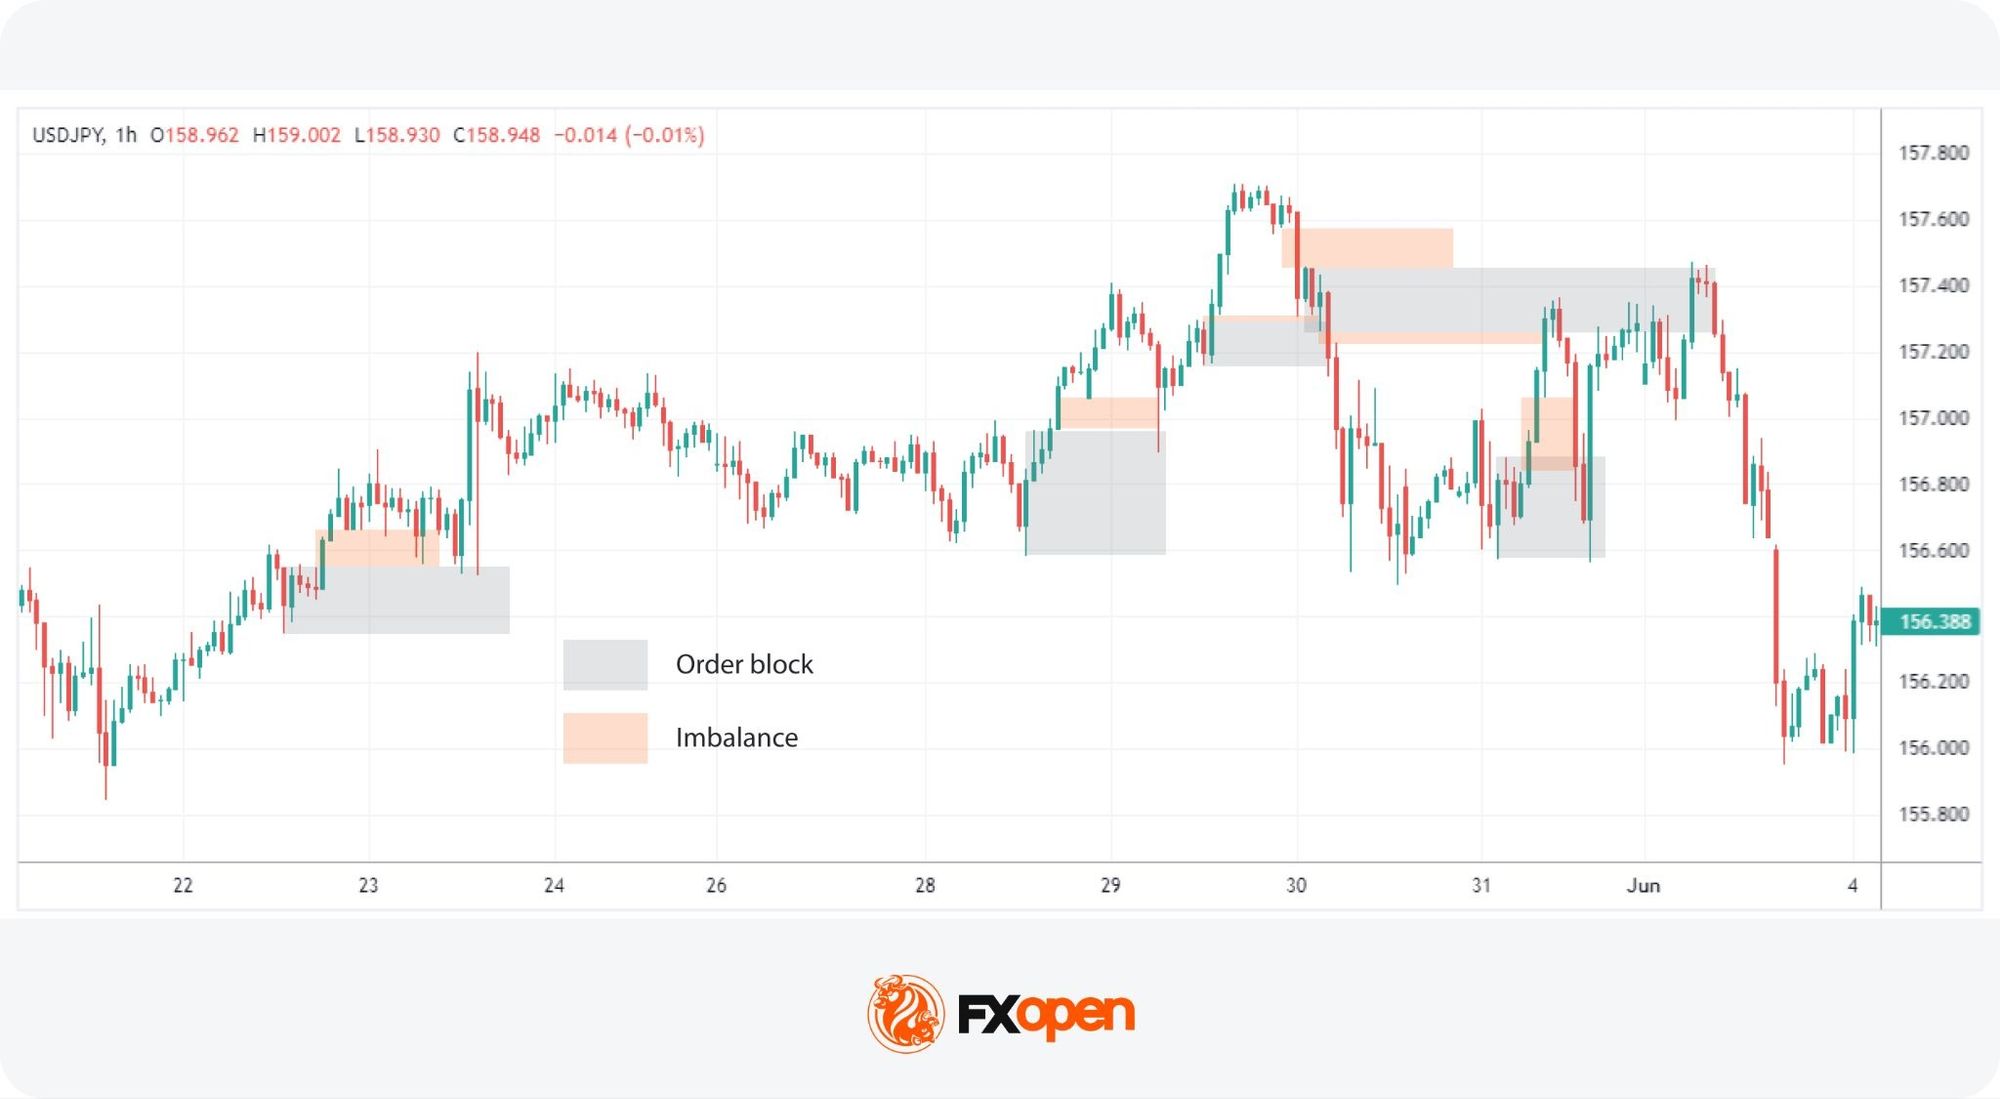
While not directly involved in the ICT Turtle Soup setup, order blocks and imbalances act as supportive context rather than required components. Understanding them can provide insight into where the price might head and the general market context.
Order blocks are areas where significant buying or selling activity has previously occurred, often due to institutional orders. These blocks represent zones of support and resistance where the price is likely to react.
- Bullish order blocks form at the base of upward moves and often act as support on a revisit.
- Bearish order blocks form at the top of downward moves and often act as resistance.
Imbalances, or more precisely fair value gaps (FVGs), are price regions where the market has moved too quickly. When price rapidly moves in one direction, it leaves behind an area with little trading activity. The market often returns to fill these gaps before continuing.
ICT Turtle Soup Setup Conditions
The ICT Turtle Soup setup forms when several conditions appear together on the chart. Each condition narrows the context until a failed breakout becomes the likely outcome.
The conditions for this liquidity grab trading strategy traders typically look for include:
- A defined higher timeframe bias
- Marked internal liquidity inside that bias
- A liquidity sweep that fails to hold
- Lower timeframe confirmation aligned with the higher timeframe direction
Establishing a Bias
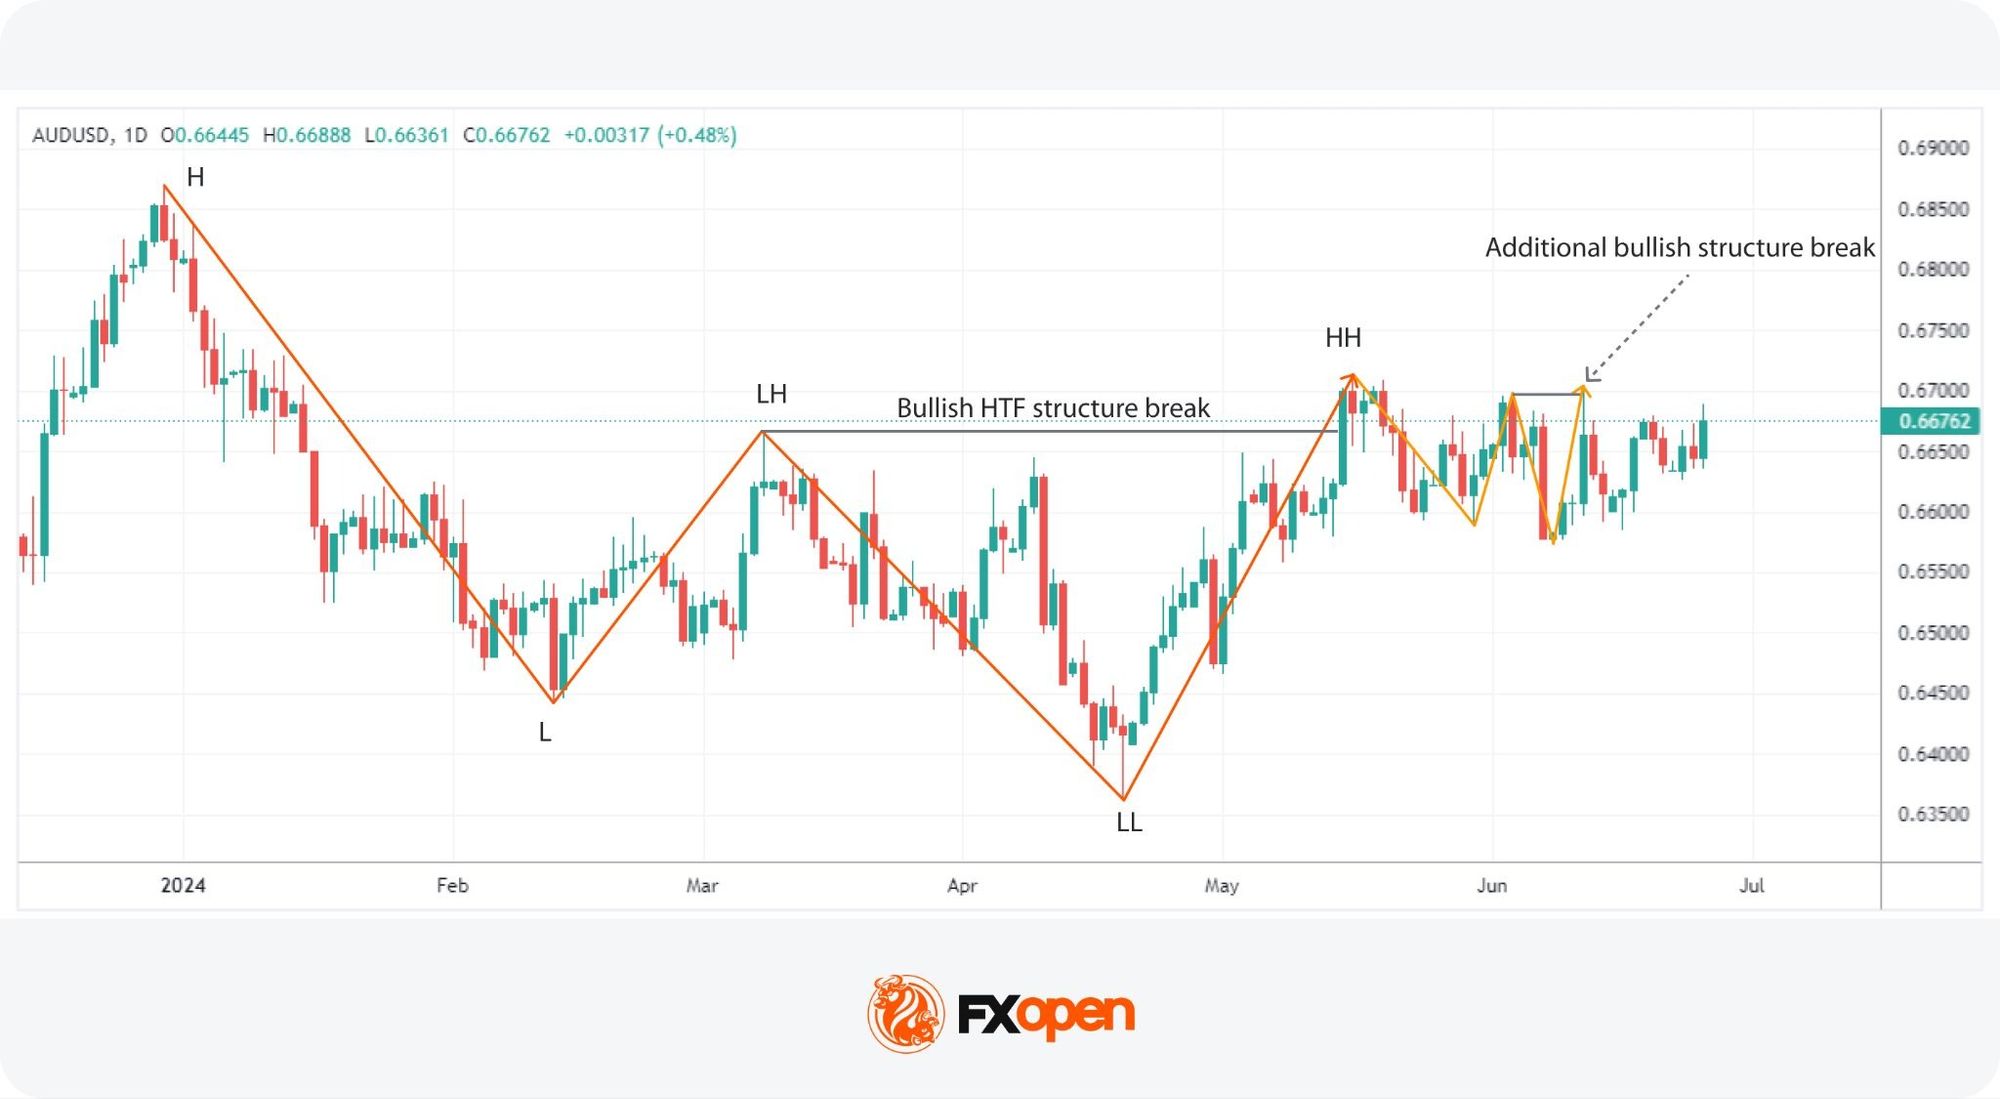
Traders begin by analysing the higher timeframe trend, such as the 4h daily charts, to establish a market bias. This analysis may help determine whether the market is predominantly bullish or bearish.
Measurable criteria for the bias typically include:
- A break of structure in one direction on the higher timeframe
- A series of higher highs and higher lows for a bullish bias
- A series of lower highs and lower lows for a bearish bias
- Price respecting key swing points without violating them in the opposite direction
Once the bias is set, traders only look for setups that align with that direction.
Identifying Internal Liquidity
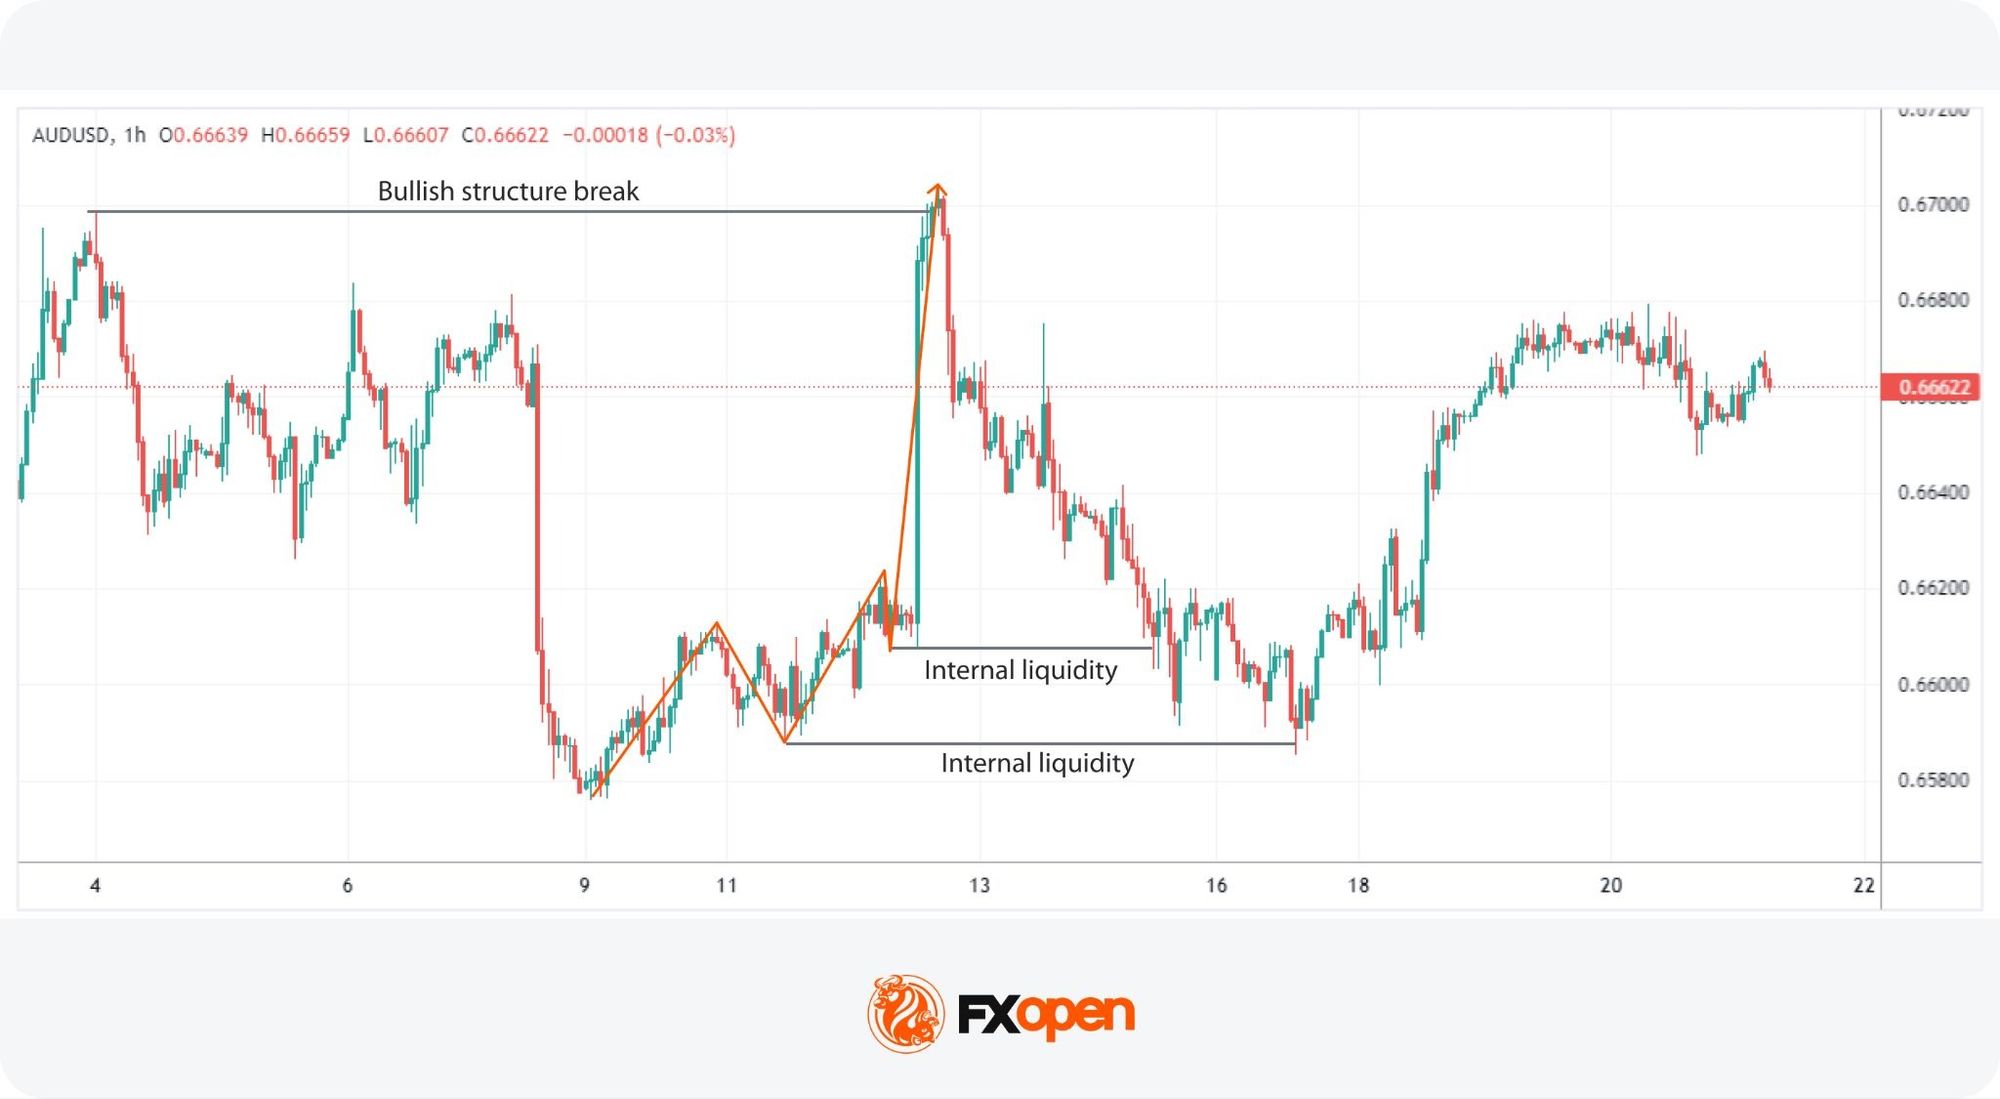
Once the higher timeframe trend is established, traders mark levels of internal liquidity inside the broader leg.
Internal liquidity typically rests in these locations:
- Below recent swing lows in a bullish leg
- Above recent swing highs in a bearish leg
- Beneath equal lows or above equal highs, where stop clusters build
- At round-number levels that attract retail stop placement
These zones are likely to attract stop-loss orders, making them probable targets for a liquidity sweep before the higher timeframe trend resumes.
Liquidity Sweep Trading Condition
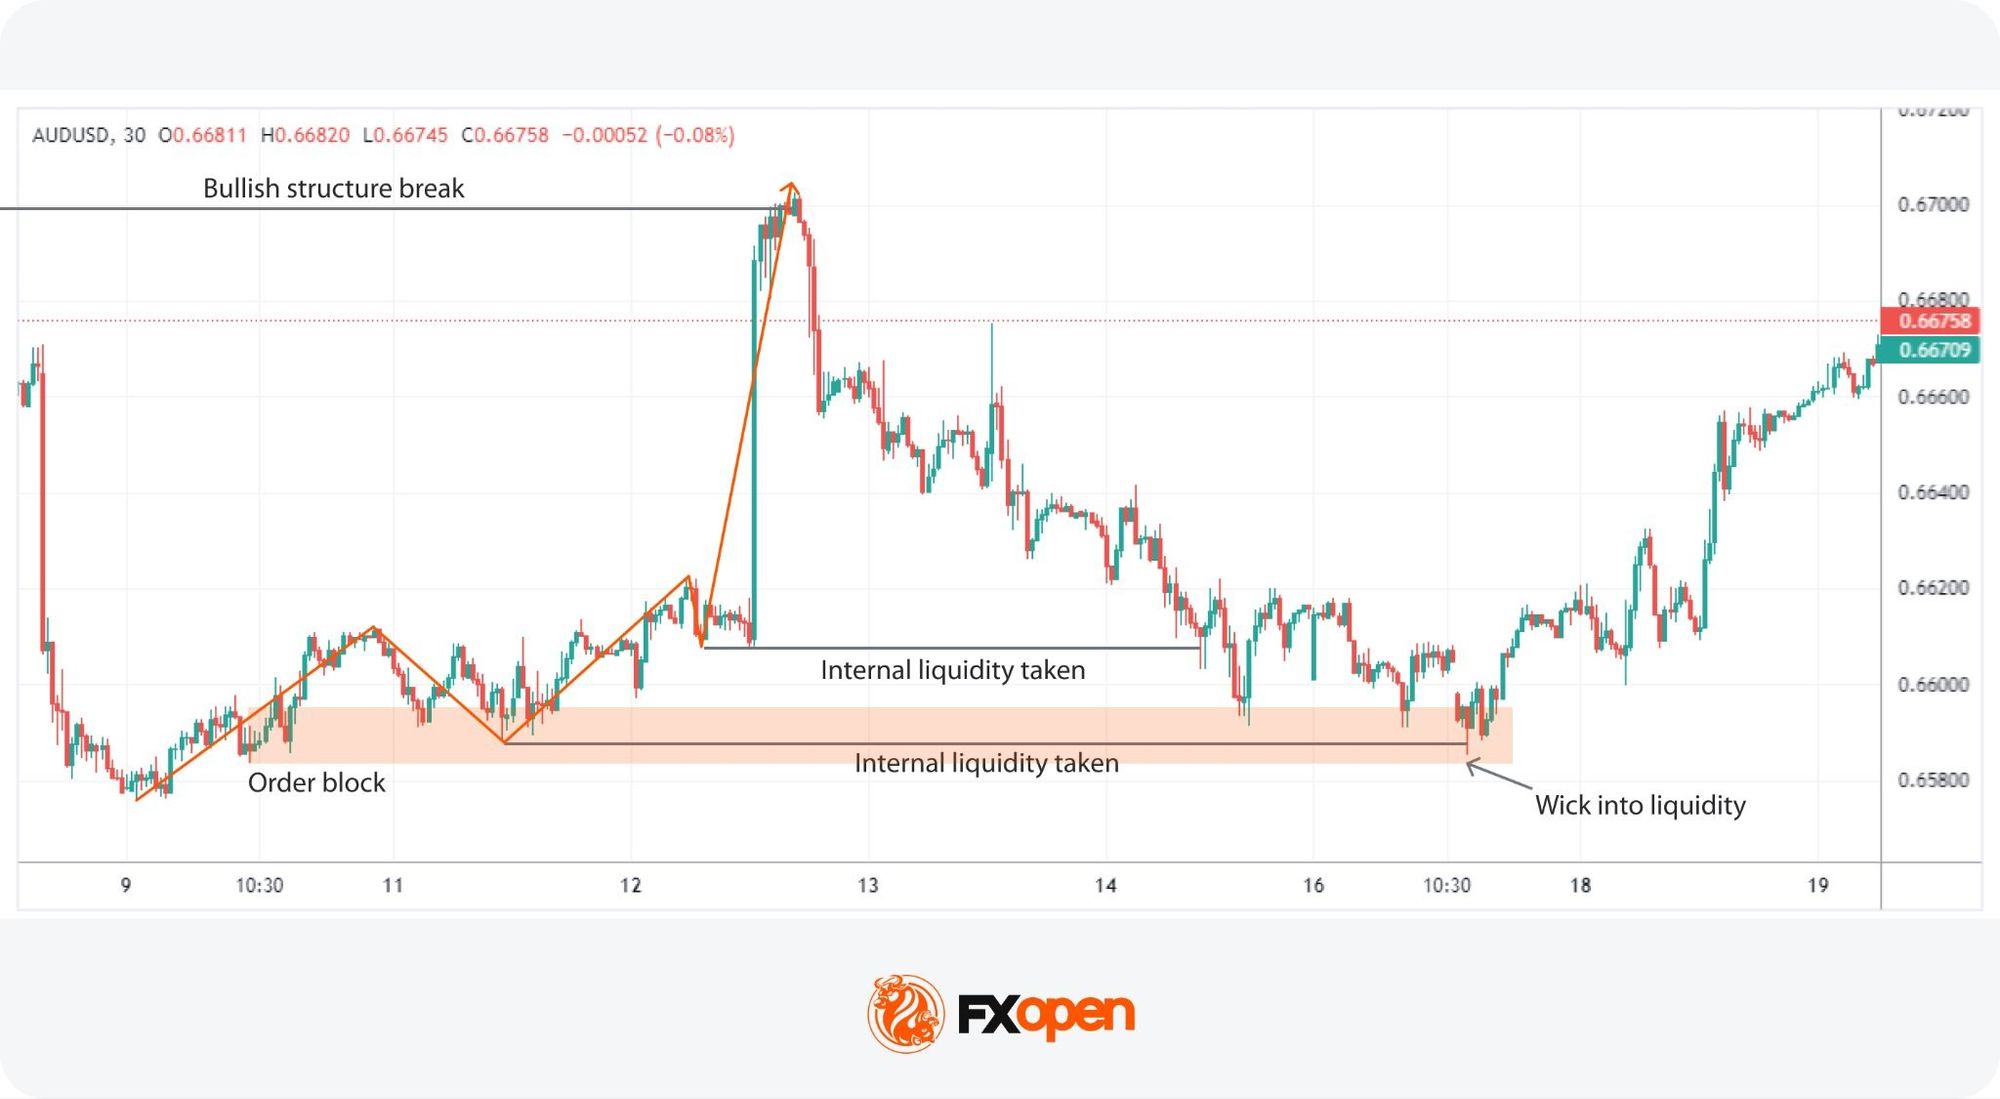
The condition is met when price briefly breaks through a marked internal liquidity level, then reverses back inside the range. This typically happens when stop-loss orders are triggered before price quickly returns.
Confirmation comes from wick and close behaviour. Price should sweep the level with a wick that extends beyond it, then close back inside the prior range on the same candle. A small wick relative to the candle body suggests the sweep absorbed liquidity efficiently.
The setup fails when price closes beyond the swept level instead of reversing. A close outside the range, especially with continuation in the next candle, signals a genuine breakout rather than a Turtle Soup condition.
Lower Timeframe Confirmation
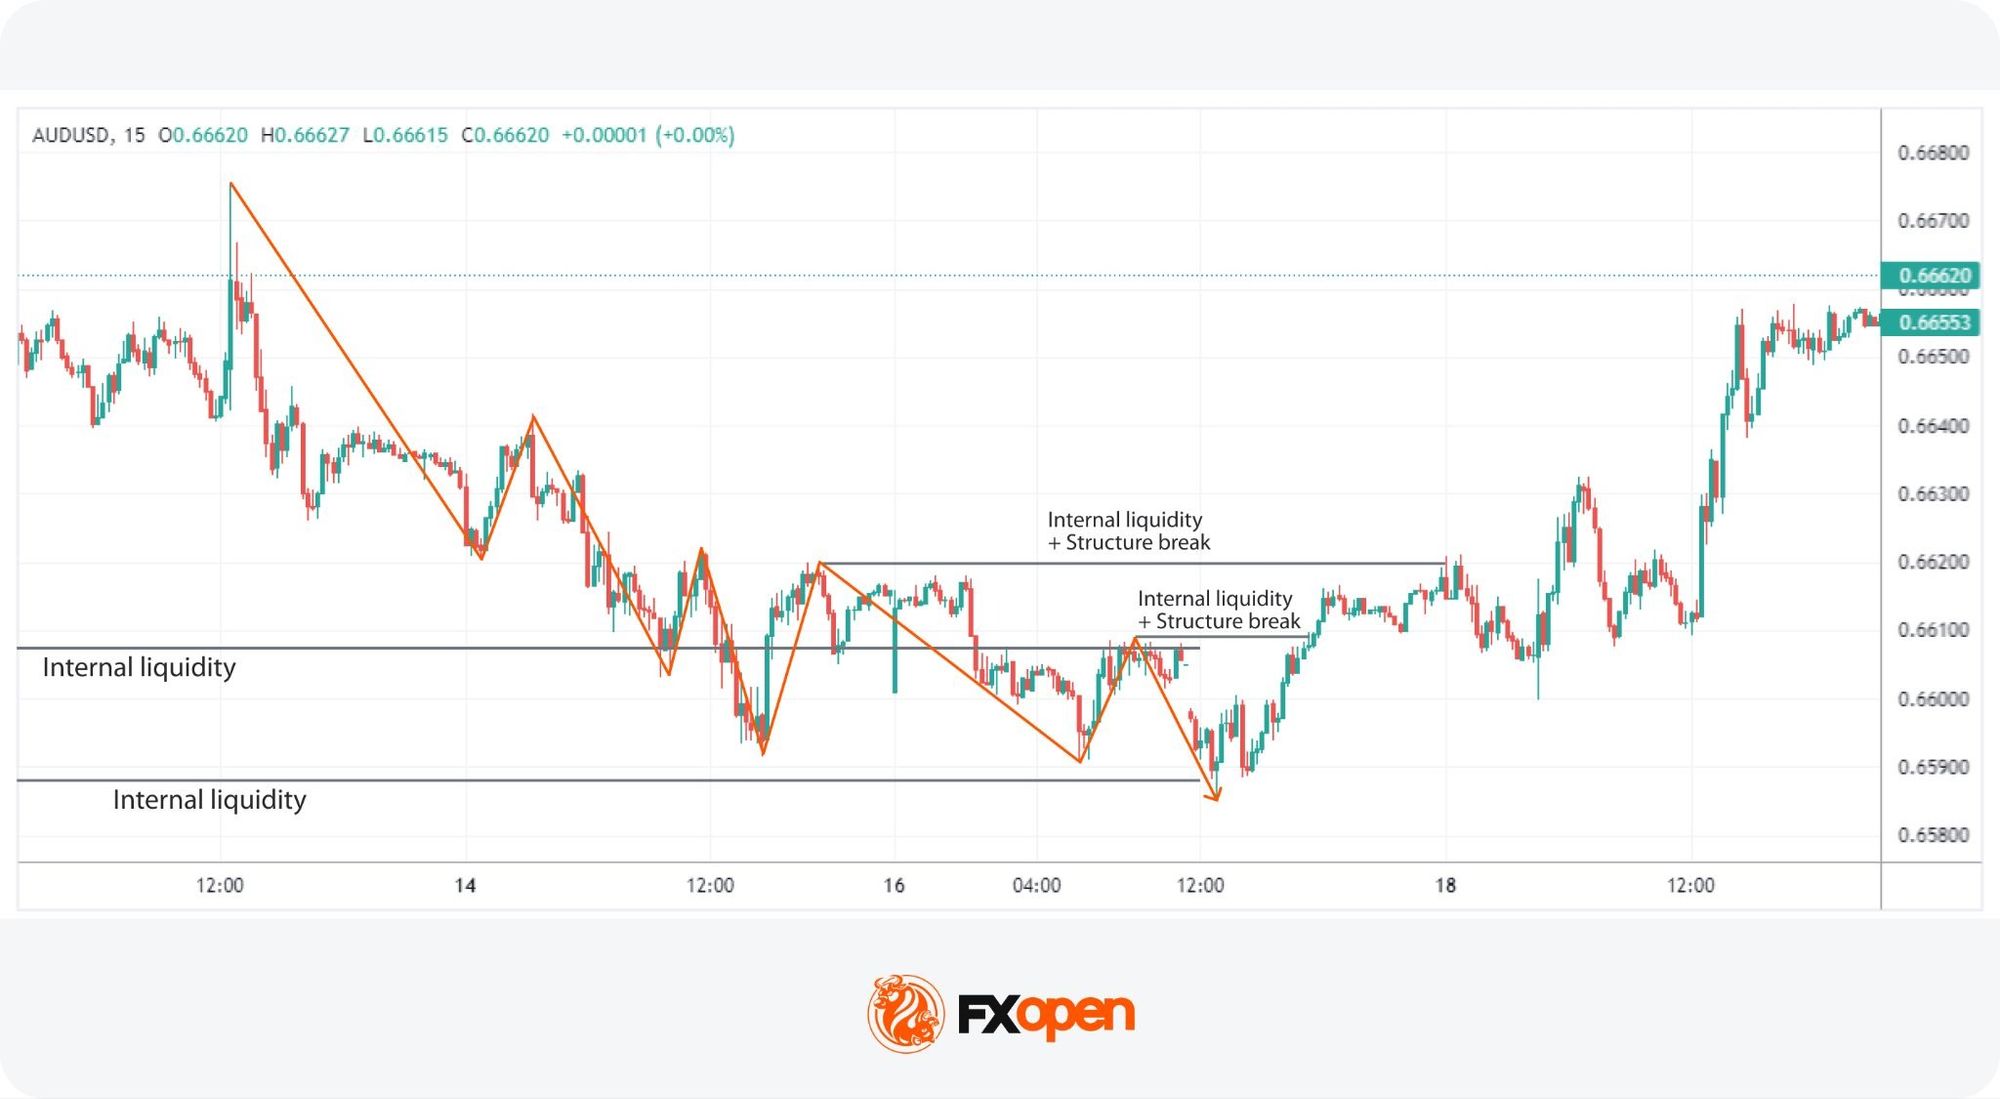
After identifying a liquidity grab beyond this internal liquidity level, traders look for an entry on a lower timeframe. They watch for a Market Structure Shift (MSS) in the direction of the higher timeframe bias. Displacement supports the shift when a strong candle closes well beyond the lower timeframe swing point.
Price often retraces back into the range to fill an imbalance before continuing. This retracement frequently meets an order block left behind by the displacement candle. The combination of MSS, displacement, and an order block retest typically gives a precise entry zone aligned with the higher timeframe direction.
Entry, Stop Loss, and Targets
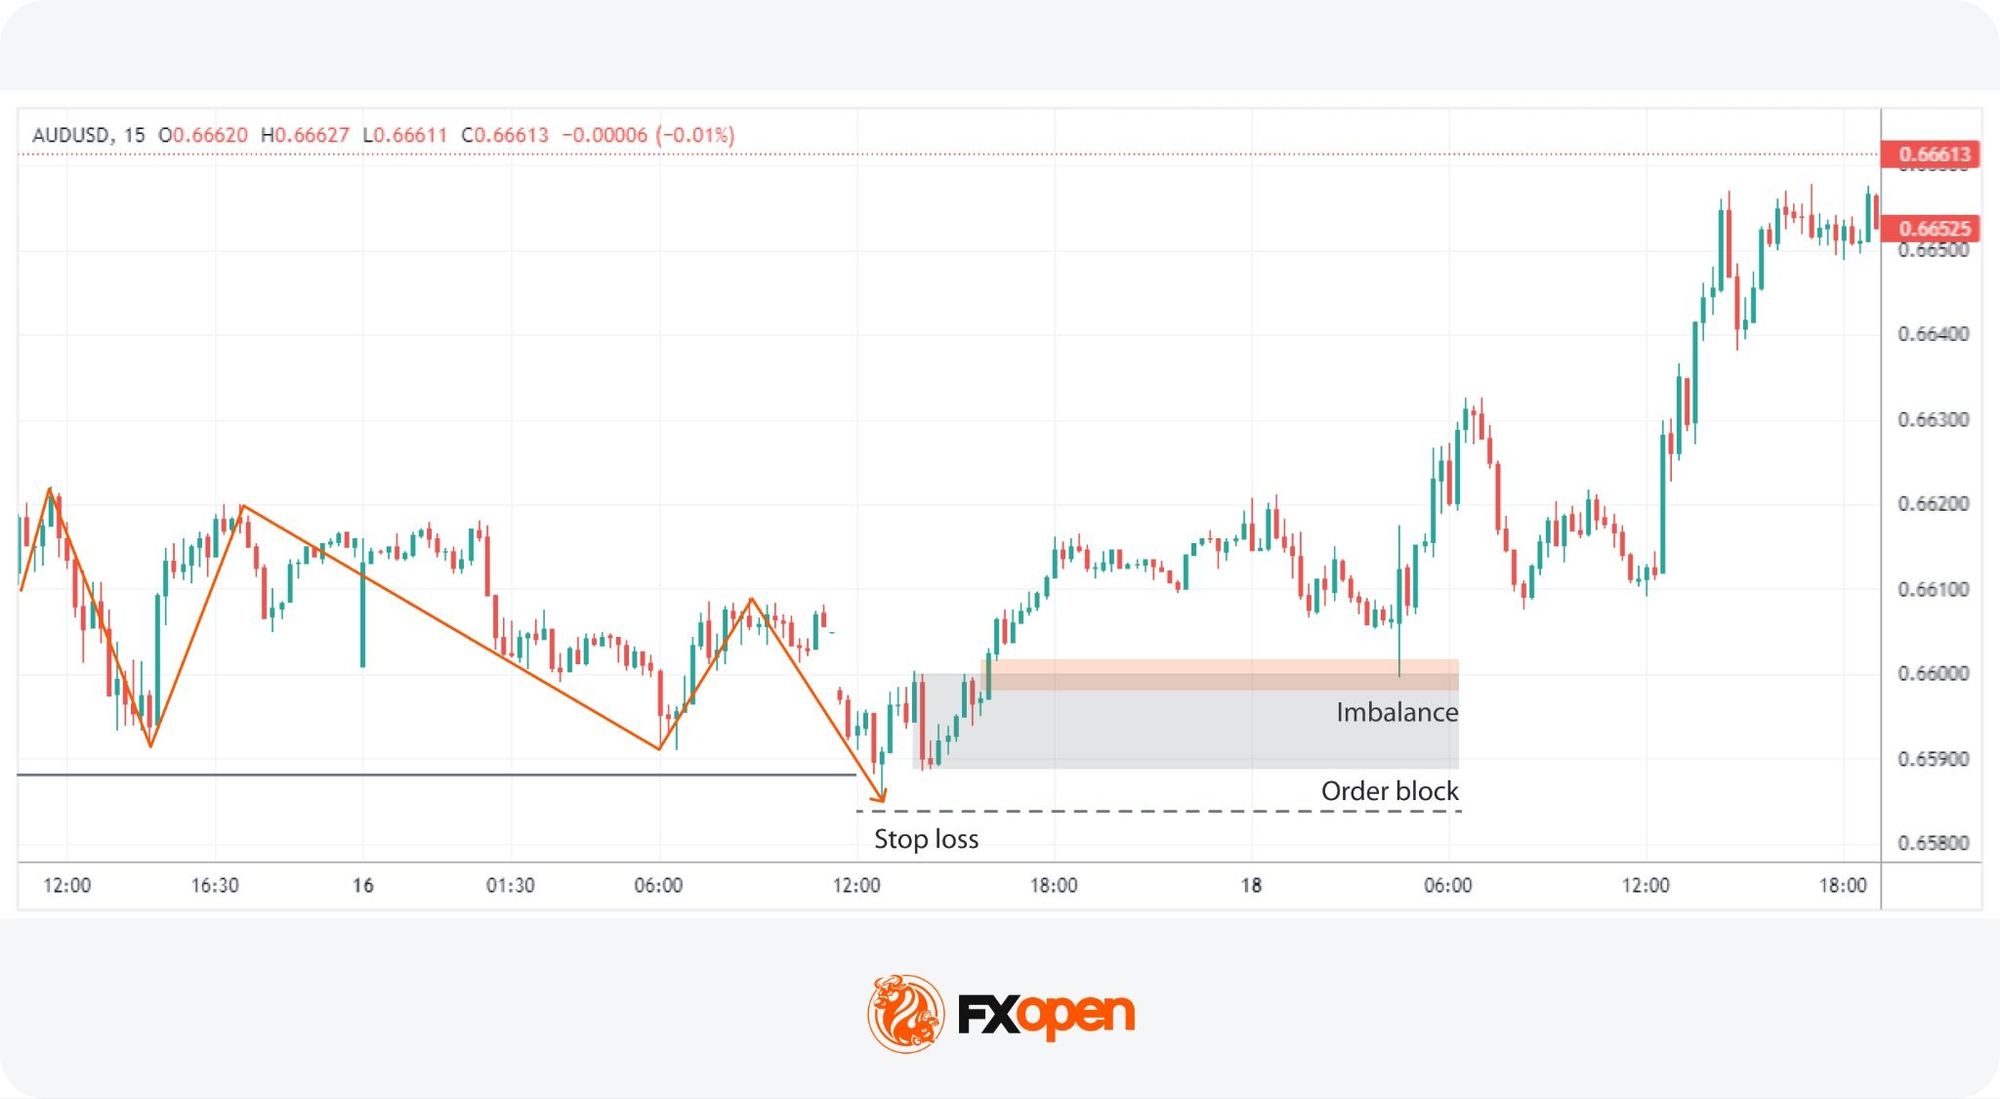
Once the conditions described above appear together, traders typically position in the direction of the higher timeframe bias. The setup gives a clear framework for entry, stop loss, and target placement.
- Entry zone: A limit order at the order block left behind by the displacement candle, in line with the higher timeframe direction.
- Stop loss: Placed just beyond the liquidity sweep wick. Above the recent high for a short trade, below the recent low for a long trade.
- Targets: Set at major liquidity levels such as previous highs or lows, where significant orders are likely to sit.
Position sizing and stop placement should align with the trader’s broader risk management approach. The framework above outlines structure, but potential risk per trade still depends on account-specific factors.
Potential Advantages and Limitations
The ICT Turtle Soup pattern is a trading strategy with several potential benefits and drawbacks.
Advantages
- Defined entry framework: The setup gives a specific entry zone, stop placement, and target structure, which removes ambiguity about where to act.
- Multi-timeframe applicability: The pattern can be applied across different timeframes and market conditions, including ranging and trending markets.
- Structured risk parameters: Stop losses sit just beyond the liquidity sweep, which produces a defined risk distance for each setup.
Limitations
- Steep learning curve: Applying the setup requires familiarity with market structure, liquidity, and order flow, which takes time to build.
- Sensitive to market conditions: Highly volatile or thin markets can produce false signals where sweeps continue rather than reverse.
- Time-intensive: The setup demands monitoring multiple timeframes to identify valid conditions, which limits how many markets a trader can cover at once.
The Bottom Line
The ICT Turtle Soup is a pattern built around failed breakouts and liquidity sweeps at key support and resistance levels. It frames a reversal setup with defined conditions for bias, liquidity sweep behaviour, lower timeframe confirmation, and entry placement.
Like any approach, its outcomes depend on context. The setup tends to work where range edges hold and breakouts fail. It tends to underperform where momentum carries through swept levels. Disciplined execution, careful risk management, and alignment with the broader market context remain the deciding factors.
Traders who want to apply the framework on live markets may open a forex trading account with FXOpen and trade with tight spreads from 0.0 pips and low commissions from $1.50.
FAQs
What Is ICT Turtle Soup in Trading?
ICT Turtle Soup is a method that exploits false breakouts in trading. It identifies potential reversals when the price briefly moves beyond a major support or resistance level, triggering stop-loss orders before reversing direction. This strategy aims to take advantage of these liquidity grabs by entering trades opposite to the initial breakout direction.
What Are the Conditions for ICT Turtle Soup?
To identify the ICT Turtle Soup pattern, traders analyse higher timeframe trends to establish market bias. They then look for counter-trend moves and mark internal liquidity areas. The pattern is identified when the price taps these liquidity zones and reverses quickly, often leaving a small wick. This signals a liquidity grab and potential trade setup in the direction of the higher timeframe trend.
How May Traders Use the ICT Turtle Soup Pattern?
According to theory, using the ICT Turtle Soup pattern involves several steps. First, traders establish a market bias based on higher timeframe analysis. Then, they look for liquidity grabs at marked internal liquidity areas, indicating false breakouts. The next step is to confirm the setup on a lower timeframe by observing a similar liquidity grab and structure break. Lastly, they are supposed to enter trades in the direction of the higher timeframe trend, placing stop losses just beyond the liquidity grab and targeting key liquidity levels for profit-taking.
What Is a Turtle Soup Setup in Forex Markets?
A turtle soup setup in forex markets is a failed breakout pattern at a key swing level. Price briefly breaks a recent high or low and sweeps clustered stop-loss orders. It then reverses back inside the prior range. Traders typically position against the initial breakout once the sweep is confirmed.
What Confirms a Liquidity Sweep in ICT Trading?
A liquidity sweep is confirmed by specific wick and close behaviour. Price should extend beyond a marked swing point, then close back inside the prior range. The wick reaches past the level while the candle body stays inside. A close beyond the level without reversal suggests a genuine breakout instead.
Is Turtle Soup a Reversal or Continuation Pattern?
Turtle soup is classified as a reversal pattern, not a continuation pattern. It targets failed breakouts where price moves through a level and then returns inside the prior range. The setup positions against the initial breakout direction rather than with it. Continuation patterns take the direction of the breakout instead.
This article represents the opinion of the Companies operating under the FXOpen brand only. It is not to be construed as an offer, solicitation, or recommendation with respect to products and services provided by the Companies operating under the FXOpen brand, nor is it to be considered financial advice.

Ethereum has cracked the $2,000 psychological floor, and the price prediction is not getting better. It just keeps getting bearish. ETH currently trades below the $2k round number, down by almost 5% in a day.
The second biggest coin just plunged to as low as $1,970 at the depths of the selloff, with funding rates flipping positive as long positions started to take control. Meanwhile, US-listed spot ETH ETFs recorded $67 million in net outflows just yesterday, bringing cumulative outflows to $102 million in just 2 days of this week.
Data also shows that wallets holding more than 10,000 ETH have dropped to just 1,050, down by 70 addresses in a month. This is an event of whale distribution at a measurable pace.
Crypto risk-off sentiment, weakness in Treasury markets, and macro equity pressure are compounding ETH’s breakdown.
Discover: The Best Crypto to Diversify Your Portfolio
Ethereum Price Prediction: $2,150, or $1,500 Next Stop?
ETH’s technical picture deteriorated sharply after losing a key ascending trendline and the $2,100–$2,000 support band. Both the Chaikin Money Flow (CMF) and MACD have turned decisively bearish, confirming sustained capital outflows and accelerating downside momentum.
RSI and Stochastic oscillators are deep in oversold territory, which ordinarily hints at a bounce, but oversold can stay oversold in a genuine trend break.

Bulls would want ETH to reclaim $2,150–$2,200 on volume. This could trigger a short squeeze toward $2,350. A reversal in ETF flows or a positive macro catalyst could catalyze this move.
Or, we could yet again go to a long stretch of price consolidation between $1,850 and $2,100, grinding sideways as the market digests the breakdown before attempting recovery. Retail dip-buyers provide a floor; institutional sellers cap the upside.
However, a confirmed close below $1,850 could open the $1,700 zone. If that gives way, we could see downside targets ranging from $1,500 to $1,300.
The invalidation level to watch is simple right now. Any sustained hold above the $2,000 zone neutralizes the current breakdown structure. Below it, the path of least resistance remains south. Some analysts remain constructive on ETH’s longer-term positioning, but near-term, the bear is in charge.
Discover: The Best Token Presales
LiquidChain Targets Early Mover Upside as Ethereum Struggles
When Ethereum bleeds 12% in two weeks, and institutional outflows hit, some capital doesn’t sit on the sidelines waiting for a bounce; it rotates. ETF data suggests a portion of that rotation is already finding its way into earlier-stage infrastructure plays.
This trend is worth tracking because the risk/reward math at ETH’s current market cap is fundamentally different from a project still in presale.
What happens when three great chains are meticulously unified? — LiquidChain (@getliquidchain) May 25, 2026
The LiquidChain L3.  ⟁https://t.co/vqvBcdSQYC pic.twitter.com/I6itOtiDP4
LiquidChain ($LIQUID) is a Layer 3 infrastructure project positioning itself as the cross-chain liquidity layer, fusing liquidity from Bitcoin, Ethereum, and Solana into a single execution environment.
The architecture centers on four pillars: a Unified Liquidity Layer, Single-Step Execution, Verifiable Settlement, and a Deploy-Once Architecture that lets developers ship once and access all three ecosystems.
The presale has raised north of $800K at a current token price of $0.01464, with more than 1400% APY in staking rewards as a bonus for early buyers. If cross-chain fragmentation is the problem, unified liquidity layers are the logical fix.
Research LiquidChain before the presale closes.
The post Ethereum Price Prediction: ETH Falls Below $2K, Now What? appeared first on Cryptonews.


The White House’s regulatory review office is examining a proposed Commodity Futures Trading Commission (CFTC) rule on prediction markets, according to a federal filing that could shape how platforms such as Kalshi and Polymarket operate across the U.S.
A RegInfo.gov entry shows that the proposal was received by the Office of Information and Regulatory Affairs on May 26 under Executive Order 12866, triggering a review of what the CFTC describes as a proposed rule on “Prediction Markets.” The filing does not include the text of the proposed rule.
The move marks one of the clearest signs yet that the CFTC is preparing a broader federal framework for event contracts, following months of legal and political battles over sports and election markets.
Illinois, New Jersey and other states have argued that sports-linked event contracts effectively function as online betting markets. Kalshi and the CFTC have countered that designated contract markets regulated under federal commodities law fall under the agency’s exclusive authority.
The executive order governs how major federal regulations are vetted before publication, requiring agencies to submit significant rules for economic and policy analysis. OIRA, a division within the Office of Management and Budget, oversees the process.
The timing comes days after President Donald Trump publicly backed the CFTC’s authority over prediction markets, as CoinDesk previously reported, calling it “critically important” that the agency retain “exclusive authority” over the sector in a Truth Social post.
The proposal follows a March advance notice of proposed rulemaking in which the CFTC sought public comment on which prediction market contracts may be prohibited as “contrary to the public interest,” including contracts tied to elections, gaming, and sports.
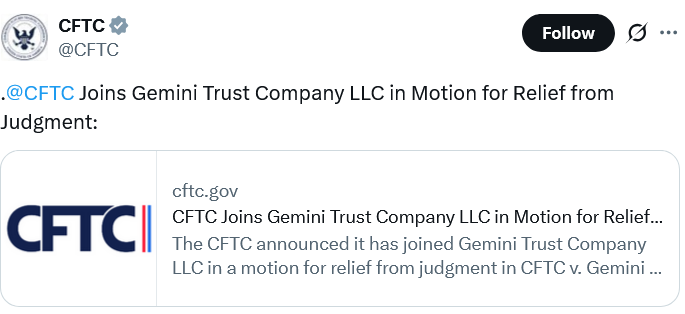
The US Commodity Futures Trading Commission has asked a federal court to vacate its $5 million settlement with crypto exchange Gemini, claiming that the agency’s enforcement action was based on flawed allegations.
Gemini settled with the CFTC and paid a $5 million fine in January 2025 in the final weeks of the Biden administration after the agency accused it of making false or misleading statements related to a Bitcoin futures contract.
The CFTC filed a joint motion with Gemini in a Manhattan court on Wednesday seeking to vacate the settlement, adding in a statement that it had reviewed the matter and concluded that the “complaint should not have been filed — and would not have been under current enforcement standards.”
The CFTC said the complaint, brought under the Biden administration, was “largely based on a whistleblower’s account known to be lacking in credibility.”
“Accordingly, the CFTC determined that continuing enforcement of the consent order’s prospective provisions serves neither the CFTC’s mission nor the public interest,” it said.
Source: CFTC
The CFTC’s request adds to a string of crypto lawsuits and investigations that the agency and the Securities and Exchange Commission have abandoned under US President Donald Trump.
Gemini co-founders Tyler and Cameron Winklevoss each donated $1 million to Trump’s election campaign in 2024.
The CFTC’s motion comes after Trump’s former CFTC chair nominee, Brian Quintenz, in September shared on X messages from Gemini CEO Tyler Winklevoss, who asked if he would review the agency’s case against the company if he were made chair.
Trump later withdrew Quintenz’s nomination and instead backed Mike Selig, a former lawyer for crypto companies who has taken a supportive stance toward the crypto industry.
The CFTC’s request seeks to end ongoing obligations imposed on Gemini under the settlement, including an injunction barring it from making false or misleading statements to the agency.
“Applying the remaining provisions — including injunctive relief — prospectively would not be equitable,” the agency said. It noted that Gemini has already paid a $5 million fine, but it was not clear if the agency would refund the penalty.
The case stemmed from allegations that Gemini made misleading statements in 2022 during the review of a Bitcoin futures contract, particularly regarding its auction volumes and liquidity.
The CFTC said these claims were relevant to assessing risk and the contract’s approval.
Related: CME Group to launch regulated Bitcoin volatility futures
The CFTC’s complaint relied on allegations from a whistleblower in 2017, who claimed that Gemini inflated trading activity and volumes to distort user demand.
The agency argued in its latest filing that the whistleblower’s allegations were based on statements from Gemini’s former chief operating officer and a subordinate, who allegedly made threats against Cameron and Tyler Winklevoss, and was allegedly known to lie about material facts.
The CFTC also argued that Gemini was a victim of fraud, claiming that two customers exploited Gemini’s “preferential fee structures through a coordinated rebate-fraud scheme.”
It also alleged that the two customers admitted defrauding Gemini of $7.5 million through this scheme, but the past leadership “did nothing with those admissions.”
Cointelegraph contacted Gemini and the CFTC for comment.
Magazine: eToro founder timed Bitcoin top perfectly due to belief in 4 year cycles
Ethereum traded below the $2,000 level as on-chain activity weakened and short-term technical indicators stayed under pressure.
Summary
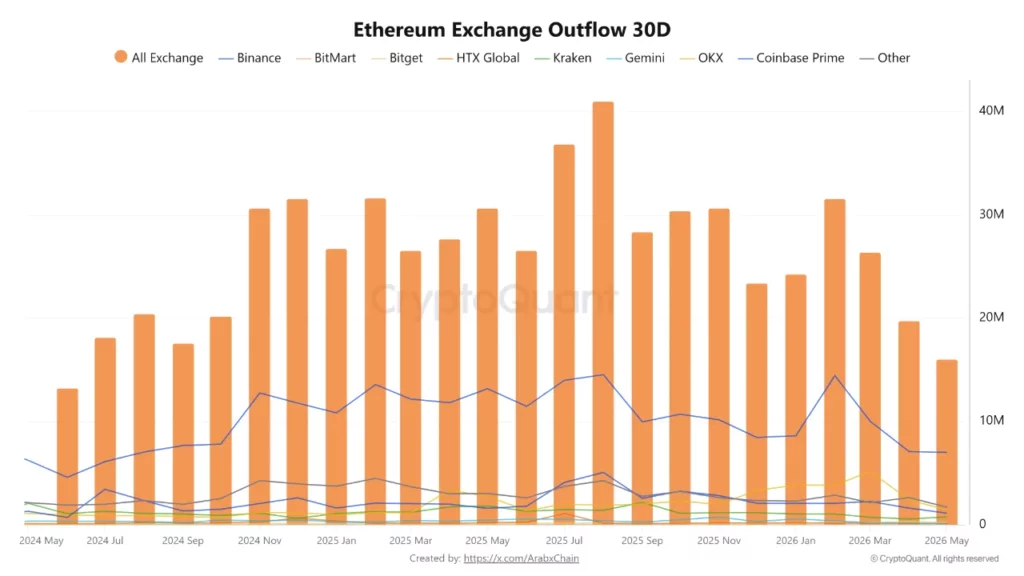
- Ethereum exchange withdrawals fell to 16.05 million ETH, their lowest level since June 2024.
- Failed transactions and exchange inflows have increased slightly as ETH trades below $2,000 support.
- RSI near 29.69 places Ethereum close to oversold levels, but sellers still control momentum.
The move came as exchange withdrawal data dropped to its lowest level since June 2024, while failed transactions and exchange inflows showed fresh signs of network and market stress.
Ethereum withdrawals fall to June 2024 low
Data from the Ethereum Exchange Outflow 30D indicator showed that total withdrawals from exchanges fell to about 16.05 million ETH. Arab Chain said the reading marked the lowest level since June 2024.
Lower exchange withdrawals can show that fewer users are moving ETH away from trading platforms. This often points to slower long-term accumulation, especially when price action remains weak or range-bound.
Binance led Ethereum withdrawals with about 7.00 million ETH. OKX followed with around 1.43 million ETH, while Coinbase Prime ranked third with about 1.12 million ETH. Kraken, Bitget, and HTX Global recorded lower withdrawal activity.
The drop does not give a direct bearish signal on its own. Still, it shows that off-exchange activity has slowed at a time when Ethereum is trying to hold key support levels.
Failed transactions and inflows add pressure
Separate on-chain data shared by nino showed that Ethereum failed transactions may be rising. The same update also pointed to a slight increase in exchange inflows.
The analyst described the failed transaction count as “may be experiencing an upward trend” and said the mix of network friction and exchange-bound liquidity “could possibly indicate a somewhat bearish outlook.”
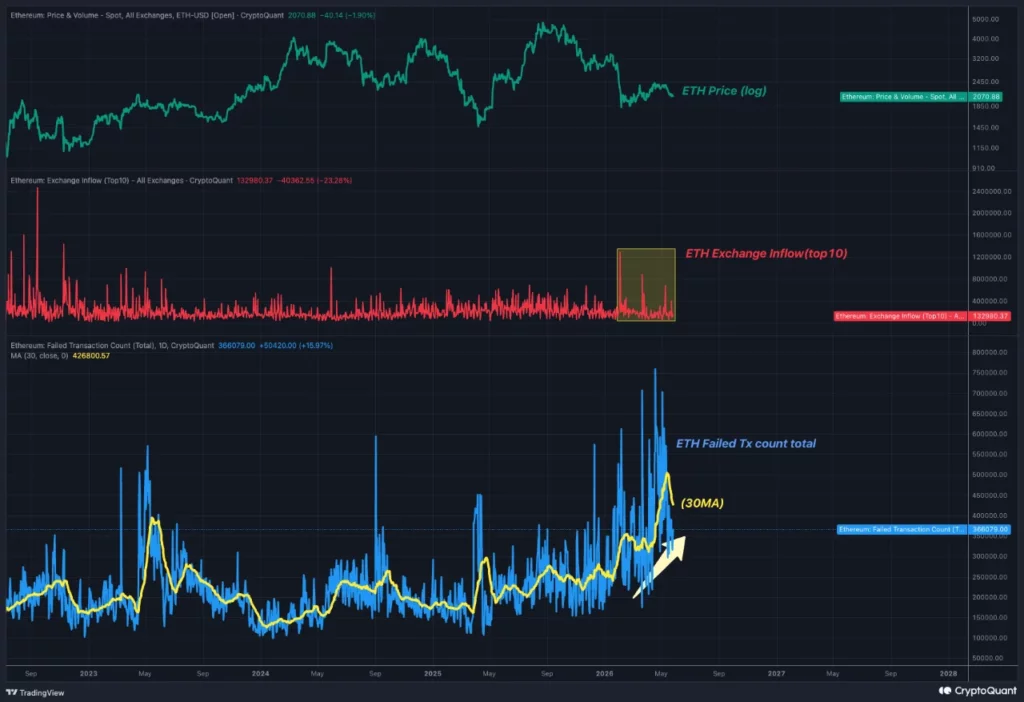
A rise in failed transactions can suggest higher network friction, user errors, or pressure around smart contract activity. It does not always mean demand is falling, but it can weaken confidence when paired with soft price action.
Exchange inflows can also carry market risk. When more ETH moves onto exchanges, traders may prepare to sell, hedge, or reposition. That does not confirm selling, but it adds caution during a weak market.
Ethereum price breaks below $2,000
Ethereum (ETH) traded near $1,986 after falling below the $2,000 mark. The move placed ETH under a key psychological level that traders often watch during market pullbacks.
As previously reported by crypto.news, the broader crypto market remained under pressure on May 28 after Bitcoin and Ethereum broke key support levels. The report said more than $900 million in leveraged crypto positions were liquidated across the derivatives market.
Ethereum also fell as the total crypto market weakened. Bitcoin dropped below $73,000, while major altcoins also posted losses as traders reduced exposure to risk assets.
Santiment said Ethereum’s drop below $2,000 triggered more “buy the dip” calls from retail traders. The firm warned that strong crowd optimism after a sharp decline can sometimes mean the market still has more downside before fear returns.
ETH technical analysis shows bearish bias
Ethereum remains below the Bollinger Band midline near $2,169. That shows short-term weakness because price has not reclaimed the central range.
ETH is also trading close to the lower Bollinger Band near $1,957. This area now acts as a key support zone. A break below it would show stronger downside pressure and could expose lower price levels.
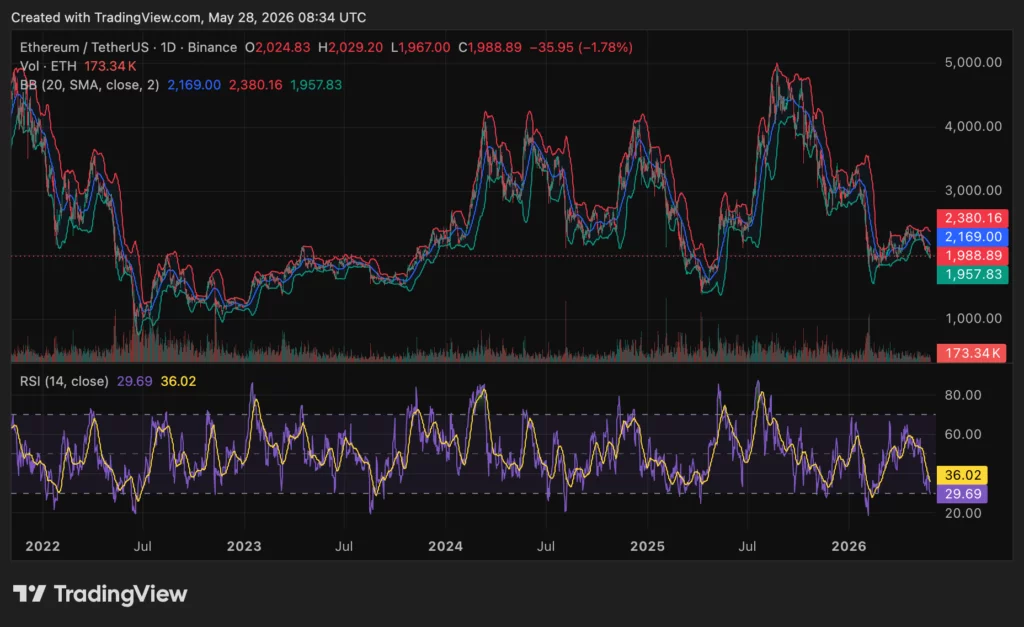
The Bollinger Bands are compressing after the recent decline. The upper band sits near $2,380, while the lower band sits near $1,957. A recovery above $2,169 would be the first clear sign that the short-term structure is improving.
The RSI stands near 29.69, below its moving average near 36.02. This confirms weak momentum and seller control. However, the low RSI also means ETH is close to oversold territory, where short-term relief bounces can form if buyers return.
For now, Ethereum’s short-term setup remains bearish. Holding the $1,950–$1,970 area is important. A drop below that range could keep sellers in control, while a move back above $2,169 would ease pressure and help rebuild recovery momentum.
Disclosure: This article does not represent investment advice. The content and materials featured on this page are for educational purposes only.
Crypto World
Crypto News, May 28: Why is Crypto Down? IBIT ETF Biggest Outflow, Trump Strikes Iran, But “Never Let Crypto Down”
Crypto markets opened Thursday deep in the red as traders scrambled to answer one question. Why is crypto down today?
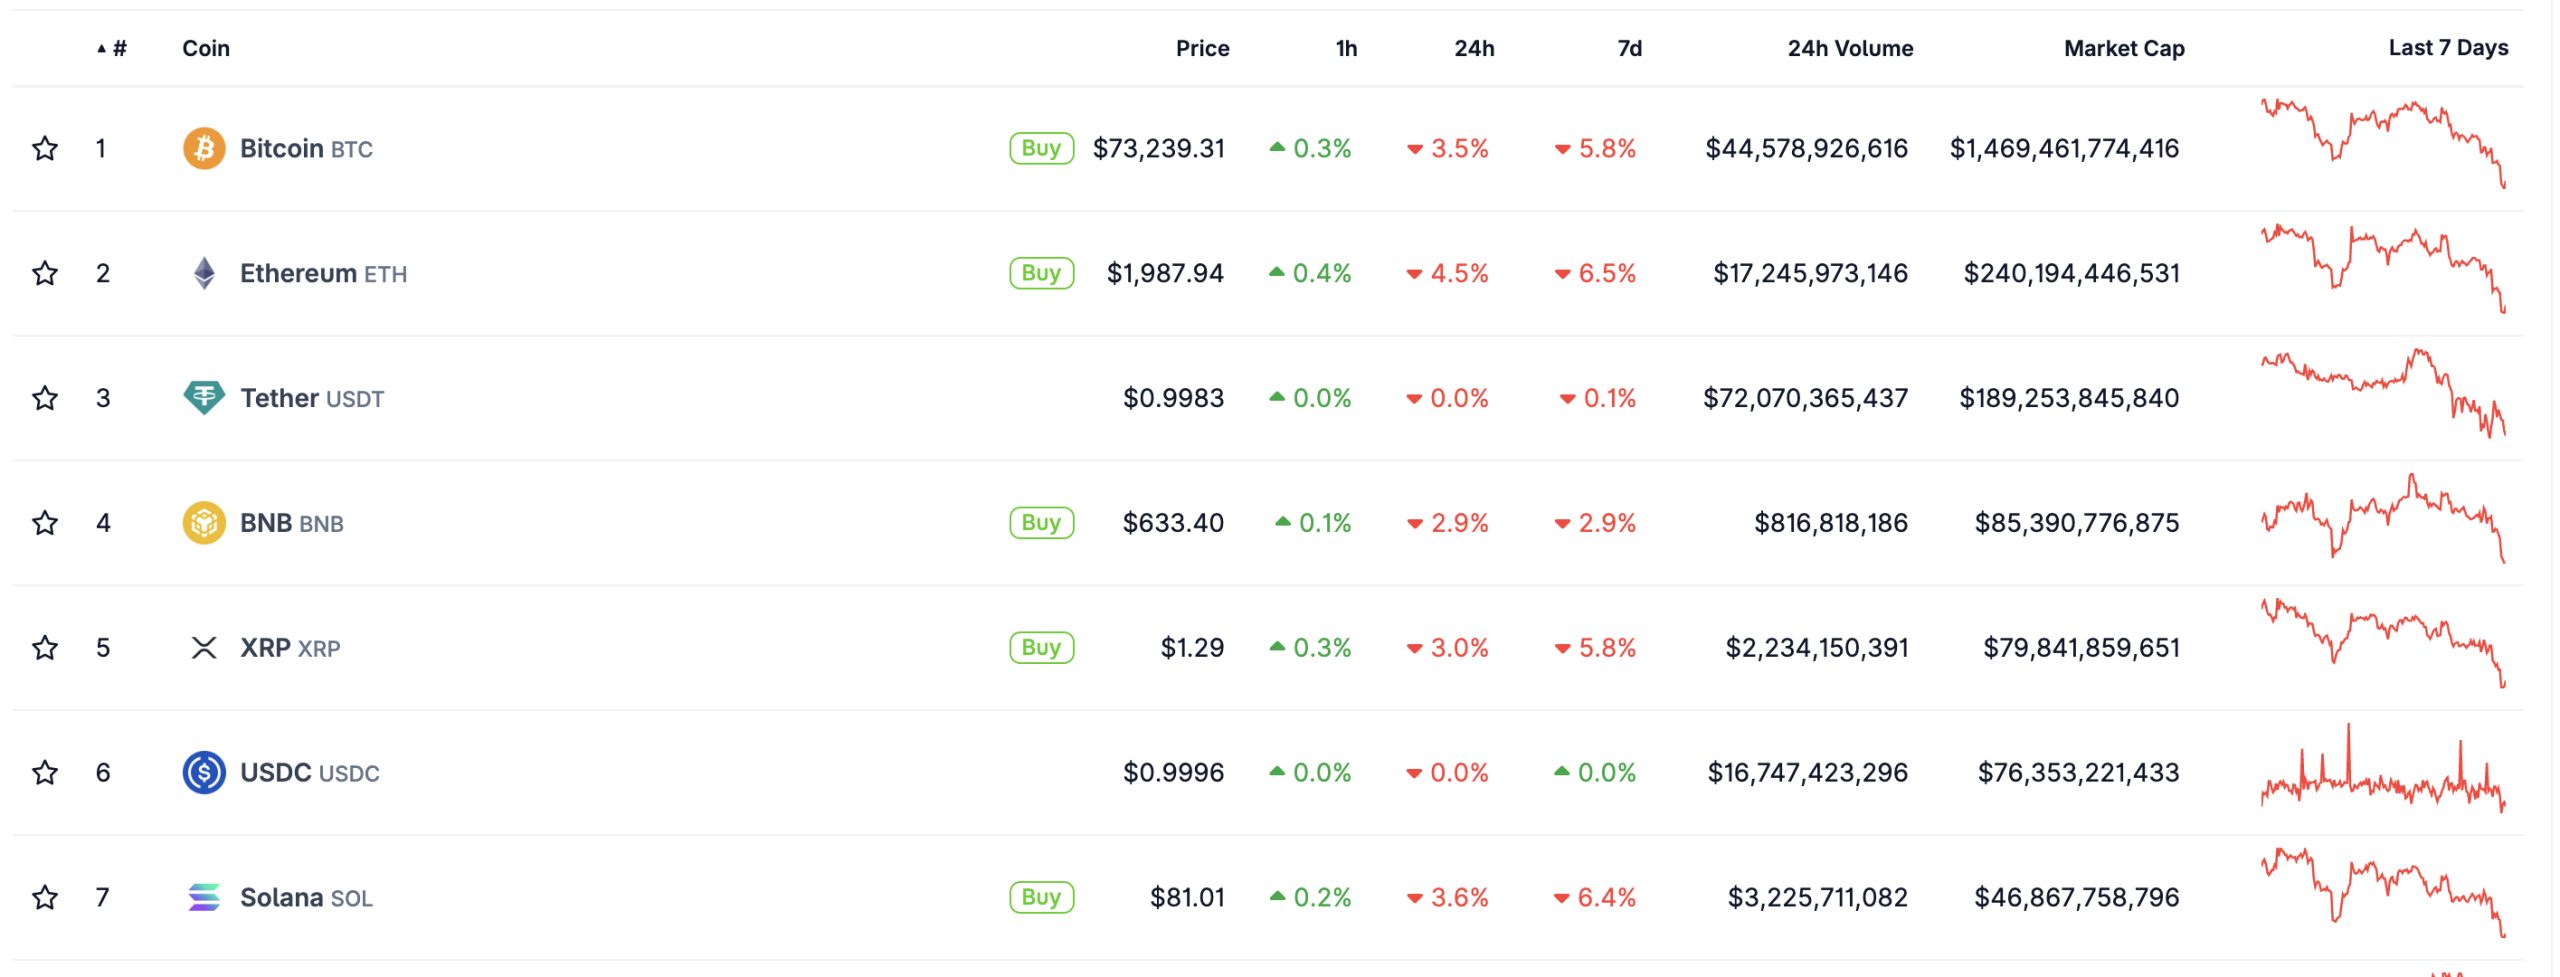
Bitcoin briefly slipped below $73,000 while major altcoins, including Ethereum, Solana, XRP, and BNB, followed the sell-off. The downturn came as markets absorbed a wave of liquidations, record-breaking IBIT ETF outflows, and escalating Trump-Iran tensions following reported strikes across the Middle East.

Despite the chaos, President Donald Trump doubled down on his pro-crypto stance, declaring he would “never let crypto down” while accusing former SEC Chair Gary Gensler of nearly destroying the industry. Trump also promised to codify a future-proof digital asset framework that “crypto haters” could not reverse.
Why Is Crypto Down?
Why crypto down became the dominant narrative, with CoinGlass data showing $936 million in liquidations over the past 24 hours. Long positions accounted for $873 million of the wipeout as aggressive bullish bets were flushed from the market.
Bitcoin alone saw $355 million in liquidations, followed by Ethereum at $242 million, Solana at $26 million, XRP at $19 million, and smaller but notable losses across BNB futures.

This decline is also happening amid a sharp risk-off shift across global markets. Geopolitical uncertainty tied to Trump-Iran developments pushed investors away from speculative assets, while crypto futures open interest fell another 1.2%.
Pressure intensified ahead of Friday’s massive options expiry, with $7.5 billion in crypto contracts set to settle. Bitcoin’s max pain level currently sits near $69,000 while Ethereum’s is under $2,000, setting the stage for heightened volatility as we unwind hedges.
Meanwhile, Pump.fun continued unloading SOL, dumping another 100,000 tokens worth $8.3 million as part of its $780 million sell-off campaign.
Discover: The best crypto to diversify your portfolio with
IBIT ETF Records Historic Outflow
BlackRock’s IBIT ETF posted its largest single-day outflow ever, shedding $527.8 million. The redemption extended the fund’s losing streak to eight straight trading days, bringing total outflows close to $1.8 billion. This IBIT ETF sell-off heavily contributed to Bitcoin’s drop and marked the largest withdrawal episode since the product launched.

However, despite the outflows, the fund still controls nearly $60 billion in assets and represents roughly 4% of Bitcoin’s circulating supply, with cumulative net inflows still sitting above $56 billion overall.
The IBIT ETF weakness coincided with rising Treasury yields and a flight from risk assets. While Grant Cardone’s firm reportedly bought another 130 BTC during the dip, bullish narratives were overshadowed by the sheer scale of ETF selling pressure.
Why is Crypto Down? Trump and Iran Headlines
Trump-Iran tensions became another major catalyst behind today’s market weakness after reports of fresh kinetic strikes across the Middle East rattled investors globally.
Bitcoin quickly lost momentum below $73,000 as people moved toward safer assets. Yet even as geopolitical fears intensified, Trump continued reinforcing his support for crypto.
“We will never let crypto down,” Trump said, while criticizing Gensler and what he called the “anti-crypto army” for driving innovation offshore. Trump also pledged to establish permanent digital asset market structure legislation designed to protect the industry from future regulatory reversals.
TRUMP SAYS GENSLER "NEARLY DESTROYED" CRYPTO IN AMERICA
"We will codify a future-proof digital asset market structure that cannot be undone by crypto haters." pic.twitter.com/WGuB620VEp— Coin Bureau (@coinbureau) May 27, 2026
At the same time, Senator Cynthia Lummis urged Congress to send the Clarity Act to Trump immediately, warning that failure to pass the bill this session could undermine America’s position in the global crypto race.
The proposed framework would further cement the United States as a crypto hub and aligns closely with Trump economic messaging during the escalating Iran crisis.
Discover: The best pre-launch token sales
Bullish Signals Still Emerging Beneath the Panic
Despite the brutal sell-off, several longer-term bullish developments continue building. VanEck CEO Jan van Eck remains constructive on Bitcoin long term, though he warned that 2026 historically aligns with the weaker phase of the four-year halving cycle. According to Van Eck, the current correction resembles a normal cycle reset.
Adoption metrics also continue climbing. Crypto-linked payment cards reached a record $7.8 billion in cumulative transaction volume, with monthly usage growth surging 230% since May 2025.
Traditional finance remains active as well. Goldman Sachs recently raised its S&P 500 year-end target to 8,000, a move that could eventually benefit crypto markets.
Even in derivatives markets, some traders see potential upside. Ether shorts clustered near the $2,000 level could face a massive short squeeze worth nearly $2 billion if ETH decides to flip the script from current levels.
Overall, today’s session highlights exactly why crypto down remains the dominant market narrative in the short term. ETF outflows, leveraged liquidations, geopolitical stress, and options expiry volatility have combined into a perfect storm for risk assets. Yet underneath the panic, institutional adoption, regulatory progress, and expanding real-world crypto usage continue moving forward.
Follow us here for market updates today.
Discover: The best pre-launch token sales
The post Crypto News, May 28: Why is Crypto Down? IBIT ETF Biggest Outflow, Trump Strikes Iran, But “Never Let Crypto Down” appeared first on Cryptonews.
Bitcoin’s price tumbled, losing more than 3.5% in the past 24 hours.
The move saw the cryptocurrency decline by over $2,000, resulting in elevated liquidations across derivatives positions, which currently amount to slightly less than $1 billion.

There are a few reasons for this, so let’s have a look at the most likely ones.
US Resumes Strikes on Iran
As CryptoPotato reported earlier today, the US resumed strikes on Iran. To be precise, they targeted an Iranian military site, while the US shot down a total of four Iranian drones, which posed a threat around the Strait of Hormuz, according to available coverage.
Speaking on the matter, an official told Reuters:
“These actions were measured, purely defensive, and intended to maintain the ceasefire.”
That said, there already was a retaliation on behalf of Iran, which struck a US base in Kuwait. The country’s IRGC released a statement, confirming the attack, and saying that “aggression will not go unanswered.”
Oil prices surged on the news, rising 5% and putting additional strain on the global economy, which in turn had an immediate impact on Bitcoin’s price. The latter is widely seen as a risk-on asset, meaning that geopolitical uncertainty is much more likely to negatively impact its short-term value.
$1.3B Block Sale on BlackRock
Yesterday, we reported that someone offloaded 29 million shares of IBIT (BlackRock’s spot Bitcoin ETF). That position alone was worth a whopping $1.3 billion, officially making it the largest block trade of this kind and marking the largest single-day outflow from BTC ETFs.
Now that we have more context, it raises the question: did the entity have inside information about what’s to come?
Speculation aside, spot Bitcoin ETFs have grown to a position of importance and liquidating large portions surely have more than just an immediate impact on the price. They signal confidence (or the lack of) in the asset and a $1.3 billion block sale is surely to raise more than just a few eyebrows.
The post 2 Reasons Bitcoin Price Crashed Below $73,000 Today appeared first on CryptoPotato.
EUR/USD and GBP/USD Range-Bound Ahead of Key US Data

Medicide: Why Israel Killed Ahmad Hariri and Other Paramedics

Marcus Rashford’s imminent talks with Man United as Arsenal ‘discuss’ transfer


-

 Crypto World7 days ago
Blockchain.com files with SEC for U.S. IPO
-

 Fashion6 days ago
Holiday Weekend Open Thread – Corporette.com
-

 Politics3 days ago
Bridgerton Season 5: Cast, Release Date And Everything We Know So Far
-
 Crypto World6 days ago
Bitcoin Accumulation Weakens as BTC Realized Losses Hit $600M
-

 Tech3 days ago
Microsoft’s quiet Claude Code retreat and the real cost of enterprise AI
-

 Business6 days ago
Dell Technologies DELL Stock Surges 15% on AI Server Momentum and Analyst Upgrades in 2026
-

 Crypto World5 days ago
Robinhood crypto COO Tanya Denisova exits
-

 Business4 days ago
NYT Strands Answers May 24 2026 Revealed for Puzzle No. 812 Theme Summer Essentials
-

 Business6 days ago
Trump Invests $1M-$5M in Kura Sushi USA Chain With 27 California Locations
-

 Politics6 days ago
Makerfield: a tale of two social-media histories
-
 Crypto World6 days ago
Space X IPO Is ‘Bad News’ for Tech Stocks: But What About Bitcoin?
-

 Business1 day ago
Selena Gomez Reportedly Upset Over Benny Blanco’s Comments on Her ‘Terrible’ Diet
-
 Crypto World6 days ago
MicroStrategy’s Saylor Says Miners No Longer Set Bitcoin Price, Another Force Has Taken Over
-

 Tech6 days ago
WhatsApp ads could make Irish debut after discussions with DPC
-

 Business3 days ago
BTS Sells Out Four Las Vegas Shows at Allegiant Stadium for ARIRANG World Tour
-
Tech22 hours ago
The Samsung pay deal is the moment Korean unions changed register
-
 NewsBeat7 days ago
Charity run by Reform leader Malcolm Offord accused of ‘law breaking’ over Scottish registration
-
 Tech6 days ago
A 0.12% parameter add-on gives AI agents the working memory RAG can’t
-

 Tech3 days ago
Westone Audio and Etymotic Acquired by Fidelity Collective in Major IEM Market Move
-

 Crypto World6 days ago
AI infrastructure race heats up as IREN pitches full-stack strategy, WhiteFiber lands $160M deal
You must be logged in to post a comment Login