

Crypto World
Three Sui mainnet halts in 48 hours traced to an upgrade bug by developers

A new feature shipped in Sui’s v1.72 release exposed an edge case in the Layer-1 blockchain’s gas-charging logic that halted mainnet three separate times across May 28 and May 29, with each fix either triggering or exposing the next failure, the Sui Foundation said in a post-mortem published Sunday.
The first outage began at roughly 7 a.m. PT on Thursday and lasted close to seven hours.
According to the foundation, it stemmed from a rare issue in how the network charged gas for transactions paying with a mix of the new address-balance feature and traditional coin objects. The bug caused validators to crash with an underflow error when a transaction was canceled for insufficient funds, but the gas-smashing routine still tried to spend those same funds.
Think of a coin object as a digital banknote. A user’s SUI balance isn’t a single number — it’s a stack of distinct “notes,” each with its own ID, that can be moved or combined. The wallet might hold three coin objects worth 60, 30, and 10 SUI rather than a single 100-SUI balance. To pay for something, the network combines the notes it needs.
Validators are computers (and the operators behind them) that run the network by processing transactions, voting on which ones are valid, and keeping the chain alive.
The core team brought the network back up around 1:30 p.m. PT with what it called an “interim fix” that addressed the most common version of the bug but carried “a known issue with a low probability of causing a halt.” The team accepted that risk to restore the mainnet quickly while a more robust fix was developed.
The known risk materialized the next morning. A second outage began around 5 a.m. PT on Friday, when a transaction triggered a masked variant of the same bug, in which the insufficient-funds error was overridden by another cancellation reason, bypassing the interim patch. The core team finished a more robust fix, and validators adopted it by about 9:40 a.m. PT.
The third halt was a knock-on from the second. When validators restarted to install the robust fix, validator participation in the protocol that bootstraps the network’s on-chain randomness fell below the required threshold, and randomness disabled itself as designed.
(On-chain randomness is a protocol the network uses to produce a number nobody can predict or fake, even though every validator has to agree on the same value. Apps that depend on chance — lotteries, certain games, random NFT mints — can’t run without it.)
A latent bug then failed to persist that disabled state to disk, leaving validators unaware on the next restart that randomness had been turned off. The next epoch change stalled for close to six hours as randomness-dependent transactions piled up in a paused queue.
No user funds were at risk during any of the outages, and no committed transactions were reverted, the foundation said.
SUI dropped roughly 8% during the cascade to a low of $0.90 and was trading near $0.90 on Monday, leaving the token down about 19% on the week, per CoinDesk data.
The events represent Sui’s third major reliability incident since its 2023 mainnet launch, following a two-hour transaction scheduling bug in November 2024 and a six-hour consensus divergence in January 2026.

A $1.26 billion block trade in BlackRock’s iShares Bitcoin Trust (IBIT) made last week was likely a whale making a quick exit on a directional trade, says Greg Cipolaro, the head of research at financial services company NYDIG.
On Tuesday, an unknown trader sold 29.2 million shares of BlackRock’s IBIT on a dark pool, a private trading platform that institutions use to discreetly make large trades outside public markets, sparking speculation about who made the trade and why.
Cipolaro said in a research note on Friday that several indicators were “consistent with a large directional holder exiting a concentrated position rather than a contemporaneous basis-trade unwind.”
He added that the seller accepting the sale at $1.01 below the market price of $44.17, forgoing $29.5 million in exchange for immediate execution, and using a private trading platform, pointed to such a large directional holder exiting.
Large transactions can move markets and affect overall sentiment. However, in this case, Bitcoin (BTC) slid 2.8% over the day after the trade. Bloomberg ETF analyst Eric Balchunas said at the time the market absorbed the sale well despite the significant block sale.
“The key unanswered question is whether the seller was responding to idiosyncratic constraints or expressing a broader investment view,” Cipolaro said.
“While the transaction details themselves cannot answer that question, they do, however, demonstrate that at least one sophisticated holder was willing to pay approximately $29.5 million to eliminate a $1.26 billion bitcoin-linked position immediately.”
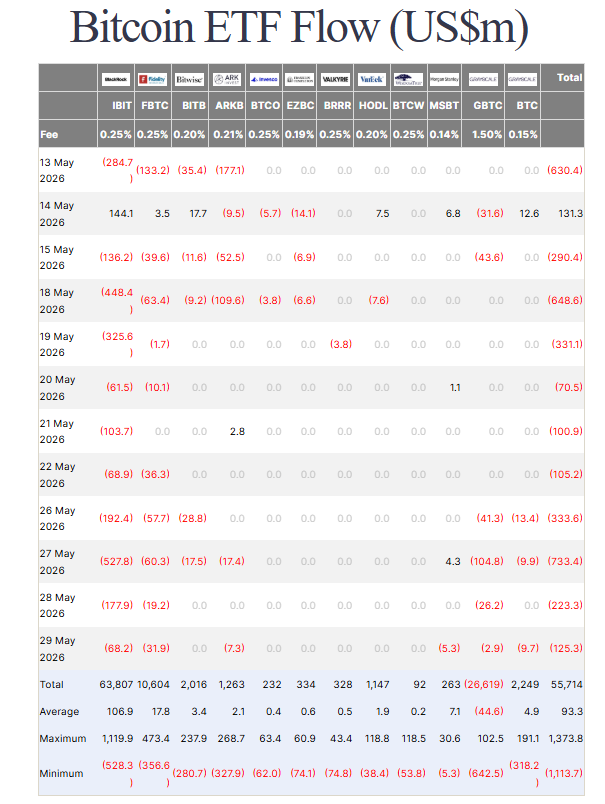
US-listed Bitcoin ETFs have now recorded 11 straight trading days of net outflows, with a $333.6 million outflow on the same day as the massive IBIT trade, according to Farside Investors data.
More than $2.9 billion has now flowed out from the ETFs since May 14, the last recorded net inflow across multiple funds.

U.S.-listed Bitcoin ETFs have recorded 11 straight trading days of net outflows. Source: Farside Investors
Related: Bitcoin falls out of the global top 10 assets as market cap dips below $1.5T
Meanwhile, sentiment has also been volatile. The Crypto Fear & Greed Index, which measures overall crypto market sentiment, returned a score of 29 out of 100 on Monday, indicating “fear” in the market. It also posted an average rating of “fear” for May.
Cipolaro said the methods used by the whale entity to sell show urgency, but the motive remains unclear. He speculates that it could have been a forced sale driven by investor redemptions and balance-sheet constraints or an attempt to reduce the risk of exiting over multiple sessions.
“Public data cannot distinguish conclusively between these explanations,” he said.
“However, the weakening technical backdrop, ongoing ETF outflows, and willingness to pay a substantial execution premium for immediacy are more consistent with discretionary liquidation rather than investor redemptions or a portfolio rebalance.”
Magazine: Big Questions: Do we really only need 2–5 cryptocurrencies?
Crypto World
Whitehat developer unlocks $2 million stuck in a 2016 Ethereum ICO contract for nine years


A security researcher who goes by 0xflorent worked with the team behind a 2016 Ethereum (ETH) ICO contract to unlock about $2 million in ether that had sat trapped for nine years, in a coordinated whitehat recovery that exploited an integer-overflow flaw the original developers had never patched.
The contract belongs to HongCoin, a 2016 token sale that fell short of its funding goal and was supposed to auto-refund investors’ ether but failed to do so because of a bug in the refund function.
0xflorent’s path unfroze 1,003.62 ETH, with 48 original investors now eligible to claim. Two have done so, retrieving a combined 96.5 ETH worth roughly $193,000, he said in an X thread Sunday.
First white-hat exploit on Ethereum: I unlocked 1,003.62
Ξ ($2,000,000) trapped in a 2016 ICO smart contract
for 9 years.The 48 original investors can now claim their funds. pic.twitter.com/lyh5iyaDu7
— 0xflorent.eth (@0xFlorent_) May 31, 2026
The contract’s refund logic rejected any holder whose token balance exceeded a global counter that years of partial refunds had dragged down to 356, capping further refunds at 3.56 ETH.
0xflorent found that an admin function on the contract, restricted to HongCoin’s multisig wallet, lacked the integer-overflow protections later built into the Solidity programming language. Calling it with a specific input value reset a holder’s balance to one, allowing the refund check to pass and releasing the funds.
The recovery was not a unilateral exploit, however. Because the admin function required HongCoin’s multisig to execute, 0xflorent emailed the team, validated the unlock sequence on a test fork of Ethereum’s mainnet, and the team itself signed the unlock transactions.
It signed 41 transactions, one per blocked holder, freeing the roughly 1,000 ETH that was truly stuck. Another seven holders held small enough balances to refund directly without the workaround.
It is the second such recovery 0xflorent has publicized in eight days.
On May 24, he said he had returned 19.329 ETH, worth about $40,590, to its original owners, including 5.141 ETH from a failed January 2018 ICO and 14.190 ETH from seven expired atomic swaps in a Liquality Wallet user account that had become inaccessible after the wallet shut down in 2024.
The recovery lands during a heavy stretch of DeFi exploits, with April alone seeing hundreds of millions of dollars drained across protocols, headlined by a roughly $293 million hit on Kelp DAO.

Key Takeaways
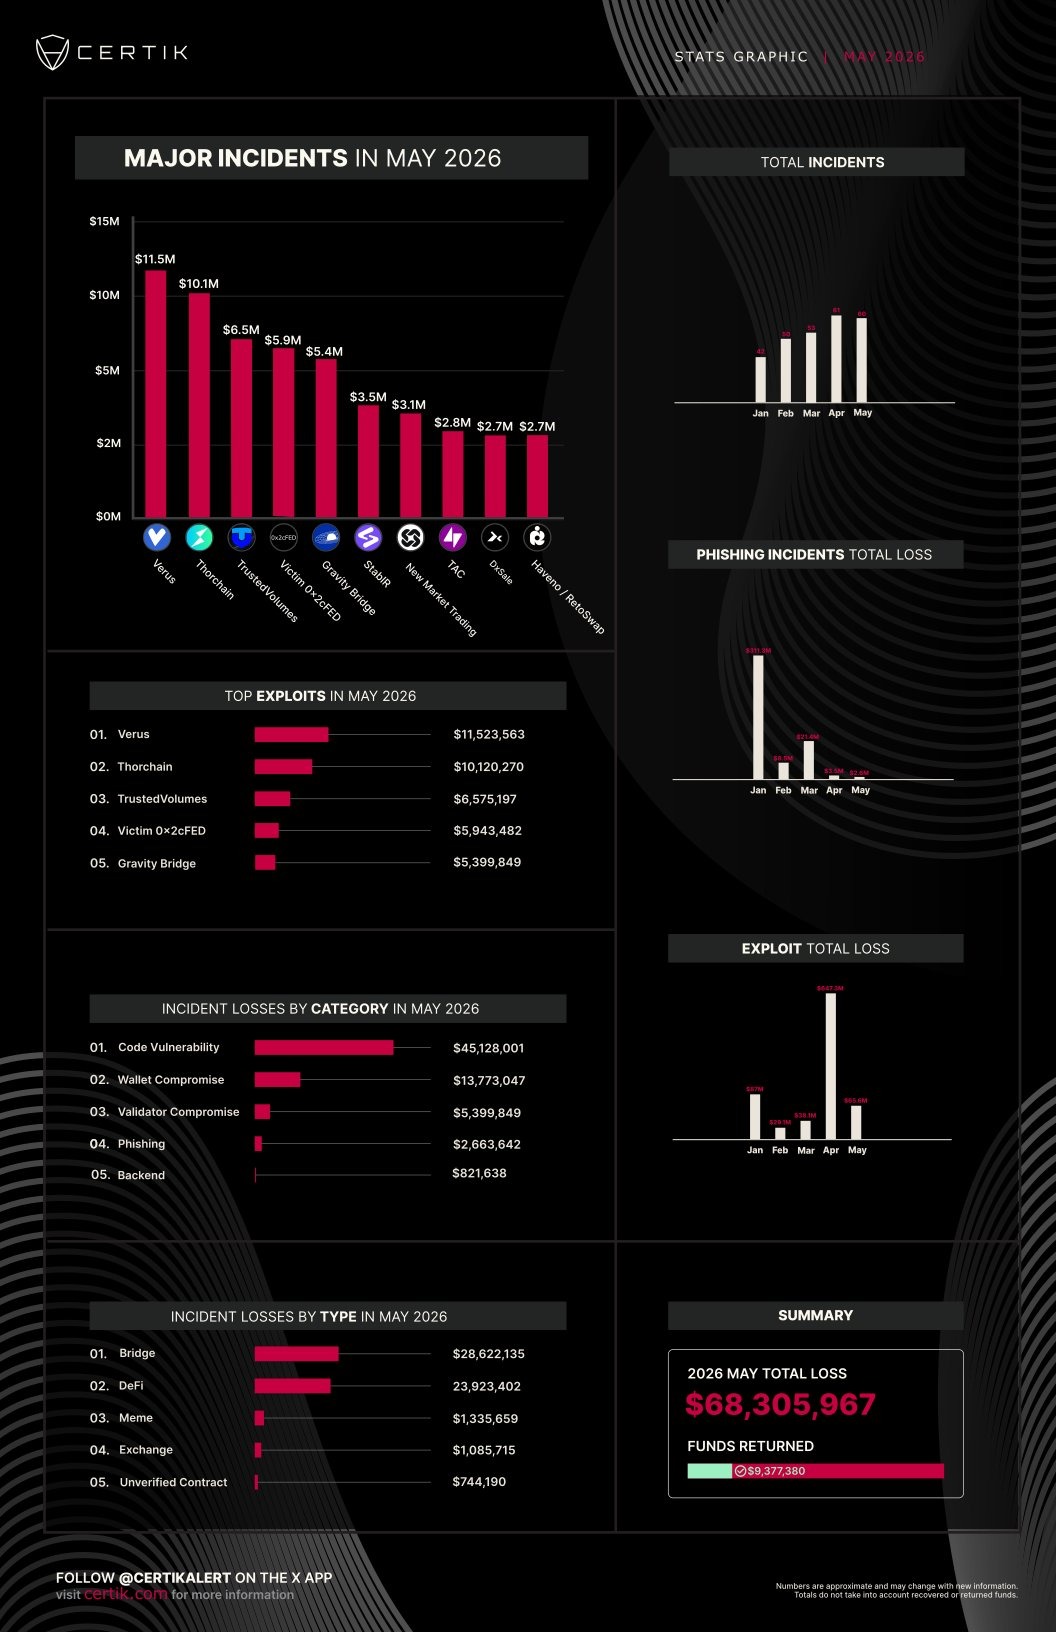
- May 2026 witnessed cryptocurrency security losses totaling $68.3 million, representing a 90% decrease compared to April’s $650 million
- This marks the third occasion in 2026 where monthly losses remained below the $100 million threshold
- A cross-chain bridge exploit targeting Verus Protocol resulted in the month’s most significant single incident at $11.5 million
- Flawed code implementations were responsible for approximately 66% of total damages, equating to roughly $45 million
- Cross-chain bridge infrastructure emerged as the primary target category, representing 42% of aggregate monthly losses
Blockchain security analysis firm CertiK reports that cryptocurrency platform vulnerabilities resulted in $68.3 million in losses throughout May, marking a dramatic 90% reduction from April’s staggering $650 million figure.
The security firm published their findings via X, highlighting that May represents the third consecutive month in 2026 where total security-related losses stayed beneath the $100 million mark.
April’s numbers had established one of the most severe monthly records for the industry. When the massive $1.5 billion Bybit breach from February 2025 is excluded, April’s figure represented the highest monthly loss total documented since March 2022. The Kelp DAO incident, which cost $291 million, drove much of April’s elevated losses.
May’s security landscape proved considerably calmer by comparison.
Phishing schemes accounted for $2.6 million of the monthly total. Security efforts resulted in approximately $9.4 million in stolen cryptocurrency being either recovered or voluntarily returned throughout the period.
Bridge Protocols and Programming Errors Dominated Vulnerability Landscape
The month’s most substantial security breach occurred on May 18 when Verus Protocol’s cross-chain bridge infrastructure was compromised, resulting in $11.5 million in stolen assets. THORChain experienced the second-largest incident, with attackers successfully extracting $10.1 million during a mid-May security breach.
Cross-chain bridge platforms represented the most frequently exploited infrastructure type, accumulating $28.6 million in losses—constituting 42% of May’s total damages.
Programming vulnerabilities emerged as the predominant root cause when measuring losses by dollar value. Approximately $45 million, representing roughly 66% of aggregate losses, stemmed from defective code implementations. Wallet breaches and private key compromises ranked second among attack vectors, accounting for $13.7 million in stolen funds.
According to DeFiLlama’s tracking data, May recorded 29 distinct security incidents. Private key compromises were implicated in seven of these separate attacks.
The month concluded with two final incidents reported on May 30, affecting both Alephium Bridge and Gravity Bridge platforms. Alephium sustained $815,000 in losses while Gravity Bridge lost $5.4 million—both breaches attributed to compromised private key security.
CertiK’s analysis additionally identified an emerging trend involving AI-enhanced malware deployment throughout May. Threat actors increasingly targeted cryptocurrency and artificial intelligence developers through compromised code repositories, manipulating AI-powered coding assistants to execute malicious operations.
Despite the improved figures relative to April, cybersecurity experts emphasize that cross-chain bridge infrastructure and private key management protocols continue to represent significant vulnerability areas requiring attention throughout the remainder of 2026.


Kyle Samani said Web3 is dead, adding that DeFi and DePIN are the only major crypto sectors left with a clear role.
Summary
- Kyle Samani said Web3 is dead, naming DeFi and DePIN as crypto’s remaining core sectors.
- Eli Ben-Sasson said crypto faces identity pressure as institutions enter while longtime crypto OGs leave.
- Recent reports show DeFi, DePIN, and tokenization still draw broad market attention globally.
“Web3 is dead. All we have is DeFi and DePIN,” Multicoin co-founder Kyle Samani said in a post on X.
The comment came in response to a wider debate started by StarkWare CEO and Zcash co-founder Eli Ben-Sasson. Samani’s remark framed Web3 as a fading label, while pointing to decentralized finance and decentralized physical infrastructure networks as the areas still carrying clear market use.
Samani remains one of the better-known investors linked to Solana, Helium, and other crypto infrastructure plays. He stepped back from Multicoin’s day-to-day work earlier in 2026, but has continued to speak about crypto markets and remains tied to Forward Industries.
Ben-Sasson points to crypto identity crisis
“Crypto seems to be going through an identity crisis,” Eli Ben-Sasson said on X.
Ben-Sasson said several long-time crypto figures have left, while institutions and traditional finance firms are showing more interest. He said this shift challenges crypto’s core story because the sector once positioned itself against those same institutions.
His comment reflects a debate already playing out across the market. Crypto started as a movement built around open networks, self-custody, and less reliance on banks. In 2026, much of the new capital and product growth is linked to ETFs, tokenized assets, stablecoins, and regulated finance firms.
DeFi and DePIN remain in focus
Samani’s comment puts DeFi and DePIN at the center of the debate. DeFi covers lending, trading, stablecoins, and other financial tools that run on blockchain networks.
DePIN refers to blockchain-linked physical infrastructure. This can include wireless networks, storage, computing, sensors, and other real-world systems supported by token incentives.
Recent market reports show why these two sectors still attract attention. Standard Chartered has projected large growth in tokenized assets by 2028, with mature DeFi protocols expected to handle much of the activity.
DePIN has also become a clearer market category. Projects in the sector aim to connect blockchain rewards with real infrastructure instead of focusing only on digital apps and token communities.
TradFi interest changes crypto’s debate
The stronger role of institutions has changed how crypto talks about adoption. Banks, asset managers, payment firms, and trading companies now play a larger part in the market.
This creates tension for builders who view crypto as an open alternative to the financial system. It also gives crypto projects a new source of liquidity, users, and regulated products.
Samani’s post did not argue that crypto itself is finished. Instead, it suggested that broad Web3 branding has lost force, while DeFi and DePIN still offer clearer use cases.
The debate now turns on what crypto can prove in real markets. For Samani, finance and infrastructure remain the clearest answers.
Losses from exploits of crypto platforms fell to $68.3 million in May, down almost 90% from the $650 million lost in April, says crypto security company CertiK.
“After a particularly bad April, May is now the third month of 2026 to record losses under [$100 million],” CertiK posted to X on Sunday.
Around $2.6 million of the total crypto stolen in May was due to phishing attacks, while roughly $9.4 million was recovered or returned, it added.
Excluding the $1.5 billion hack on Bybit in February 2025, April saw the highest losses recorded in a month since March 2022, with the largest loss that month coming from a $291 million exploit of Kelp DAO.
An exploit of Verus Protocol’s cross-chain bridge on May 18 was the largest in terms of losses last month, with $11.5 million stolen. THORChain was second after an exploit in mid-May saw $10.1 million stolen from the protocol.
Code vulnerabilities were the category with the highest value of losses over the month, with about 66% of the total, or around $45 million lost. Wallet or private key compromises were the second-most costly, with $13.7 million stolen.
Cross-chain bridges were the most targeted, with $28.6 million, or 42% of the total monthly losses, followed by decentralized finance protocols.

Crypto exploit losses in May reached $68.3 million. Source: CertiK
Related: Scammers make $400K through fake Uniswap ads on Google
DeFiLlama data shows that there were 29 incidents in May, seven of which involved compromised private keys.
The latest two incidents, reported on May 30, were the Alephium Bridge and Gravity Bridge, which were respectively exploited for $815,000 and $5.4 million due to compromised private keys.
Malware developed with artificial intelligence assistance has also been on the rise as malicious actors targeted crypto and AI developers in May by compromising code repos and tricking AI coding assistants.
Magazine: HYPE chases $100 target, ETH could dump below $1800: Market Moves

The Sui Foundation, the nonprofit organization behind the Sui Network, says it has made a “major upgrade” to address issues that caused three recent outages and left the blockchain down for more than 15 hours across two days.
Sui experienced an outage on Thursday that lasted nearly six hours and two more on Friday. The first lasted eight hours and 25 minutes while the second lasted 43 minutes, according to the Sui network’s uptime dashboard. All systems are listed as operational as of Monday.
The Sui Foundation said in a blog post on Sunday that it applied an upgrade to fix the bugs that caused the outages. It also flagged several issues for improvement, such as better failure containment, end-of-epoch resilience and further investment in artificial intelligence agents, which helped with diagnoses, querying validator logs and assembling metrics.
“As of now, validators have fully addressed the known issues caused by both the original gas-charging bug and the randomness-state bug, and network activity has resumed,” the Sui Foundation said. It added that “during the outages, no user funds were at risk, and the network did not revert any committed transactions when it resumed.”
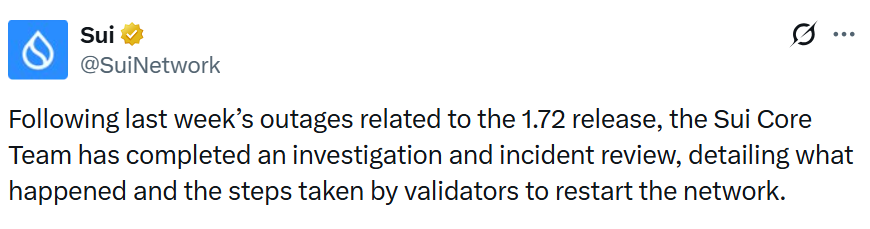
Source: Sui
Sui had a similar outage in January, which knocked the network offline for more than six hours. Another incident occurred in November 2024, when all validators were stuck in a crash loop for about 2.5 hours. Sui is the 13th-largest blockchain by total value locked at $519 million and hosts 137 protocols, according to DefiLlama.
Bugs introduced during software update
The Sui Foundation said the blockchain’s two most recent outages stemmed from “crash bugs” introduced in its 1.72 software release. The bugs impacted gas charging, causing the network to charge funds before canceling transactions for insufficient balances. This created negative balances that crashed the system
An interim fix for the initial bug triggered the third outage. The fix aimed to bring the network back online until a permanent solution could be devised, but it had “a known issue with a low probability of causing a halt.”
Related: CME Group expands crypto futures with Avalanche and Sui contracts
The Sui (SUI) token has declined since the outages. It traded at about 99 cents on Thursday before the first outage, according to data from crypto aggregator CoinGecko. It has since dropped roughly 11% and is worth about 88 cents as of Monday.
In early May, the token climbed 50% to $1.41 following several positive developments, including a Nasdaq-listed company staking a large portion of the supply.
Sui launched its mainnet in May 2023, aiming to be scalable and capable of processing transactions fast enough for mainstream financial institutions.
Magazine: HYPE chases $100 target, ETH could dump below $1800: Market Moves

Wintermute, a leading crypto liquidity provider, is expanding its institutional trading operations into prediction markets, the firm announced on Friday. The move aims to supply continuous two-sided liquidity across event contracts on prominent venues, signaling a deeper push to embed prediction markets within mainstream crypto trading infrastructure.
Wintermute, which handles an estimated $3.5 trillion in annual trading volume across crypto markets, said it would extend its reach into prediction markets without naming specific platforms. The firm described its plan as posting two-sided liquidity across event contracts, offering ongoing bid and offer prices to traders seeking real-time price discovery.
“Prediction markets have the demand profile of a major asset class but the liquidity profile of an early-stage one,” said Jake Ostrovskis, Wintermute’s head of OTC trading. “For these markets to become a reliable real-time source of probability estimates, they need sustained two-sided liquidity. That depth tightens spreads, supports larger trade sizes, and in turn improves the signal embedded in market prices.”
Wintermute emphasized that its involvement reflects a broader trajectory for prediction markets: from a niche forecasting tool to a broader venue for trading event risk. The company stated it would provide continuous bid and offer pricing across event contracts, effectively lowering trading frictions for participants.
This development aligns with a view that prediction markets can complement traditional financial signals by offering probabilistic pricing for real-world events. By introducing steady liquidity and tighter spreads, Wintermute aims to make these markets more attractive to both traders and institutions seeking hedges or directional bets on upcoming outcomes.
Source: Wintermute
This expansion also dovetails with Wintermute’s existing crypto infrastructure, which already spans spot, derivatives, decentralized finance, and over-the-counter markets. By layering prediction markets onto its ongoing operations, the firm hints at a more interconnected crypto ecosystem where event-driven prices could feed into other protocols and strategies.
Market observers have long noted that prediction markets occupy a unique position in the crypto landscape: they can act as real-time aggregators of collective probability, while also presenting liquidity challenges typical of early-stage markets. Wintermute’s entry may accelerate the broader integration of prediction-market data into decentralized finance, potentially enabling novel collateral reuse, yield strategies on locked capital, or oracle feeds derived from probabilities implied by event contracts.
Two of the industry’s most prominent prediction markets—Kalshi and Polymarket—demonstrate the scale and activity of this niche. DeFiRate estimates a combined weekly notional volume of around $5.8 billion across the two platforms, with roughly 400,000 active markets and about 42.7 million weekly transactions.1 Kalshi, regulated by the U.S. Commodity Futures Trading Commission, has historically held the largest share of market volume, accounting for about 70% of activity in the space.2
As prediction markets grow, their relationship with traditional finance and crypto markets continues to evolve. The ongoing regulatory backdrop remains a critical factor, with Kalshi’s regulatory status cited as a cornerstone of its market credibility. The expansion of liquidity providers like Wintermute could push these markets further toward mainstream adoption, as larger players bring reliability, risk controls, and scale to price discovery on event outcomes.
Beyond the immediate liquidity implications, the convergence of prediction markets with DeFi could foster broader institutional interest. If event-contract prices begin to feed into collateral frameworks or yield strategies, pools of capital might become more efficiently utilized, potentially improving capital efficiency across connected protocols. In parallel, oracle developers could leverage prediction-market prices as alternative data sources for risk assessment and automated decision-making in decentralized applications.
Industry watchers will be watching not just the uptake of liquidity but also which venues gain traction and how regulators respond to an increasingly interconnected set of markets. The balance between real-time price discovery and the risk controls required by large institutions will shape how quickly prediction markets become a staple in crypto and DeFi workflows.
What remains uncertain is which platforms Wintermute will partner with first, how liquidity provisioning will evolve as markets scale, and what the regulatory environment will allow as these markets draw more traditional and institutional participants into an ecosystem historically driven by retail traders and specialized participants.
Readers should monitor announcements from Wintermute for platform onboarding details, as well as forthcoming data on bid-ask dynamics and trading activity in prediction markets. The next few quarters will reveal whether sustained two-sided liquidity can deliver the reliability that so far has limited prediction markets from becoming a premier source of probability signals in crypto and beyond.
Notes
1 DeFiRate data cited in market coverage of Kalshi and Polymarket volume; notional weekly volume across the two platforms is around $5.8 billion, with approximately 400,000 active markets and 42.7 million weekly transactions. Source: DeFiRate, “Prediction Markets Volume.” DeFiRate.
2 Kalshi’s regulatory status and market share referenced in industry summaries noting Kalshi’s CFTC-regulated framework and its leadership in notional volume within this segment. See related coverage on Kalshi and the prediction-market landscape.
Bitcoin (BTC) has remained under pressure over the past week, falling from around $77,000 to approximately $73,140. The crypto asset experienced several sharp declines during the period, including a notable drop near $72,600 on May 28.
The latest price action suggests that the bear market remains unfinished and that deeper losses may lie ahead before recovery begins.
‘Stage 5 Is Coming’
In his latest weekly report, Doctor Profit said the market’s broader structure has not changed and that Bitcoin is still progressing through the later stages of a bear market. According to the analyst, this stage is characterized by exhaustion, sideways trading, and growing frustration among market participants.
He said these conditions are already evident in Bitcoin’s recent price action and believes they signal the market is approaching a transition to Stage 5, which he identifies as the true capitulation phase of the cycle.
Doctor Profit expects Stage 5 to begin once Bitcoin falls below $60,000. A break of that level is expected to accelerate panic across the market and trigger a more severe downturn. He added that the next phase could see forced selling by long-term holders, the collapse of a major exchange or a large market participant, or other black swan-type events that further weaken investor confidence. The analyst argued that bear markets rarely unfold in a straight line and instead tend to be lengthy, exhausting, and destructive for participants, which is why he believes many investors continue to underestimate the downside risks.
Despite Bitcoin’s decline from its highs, Doctor Profit does not believe the market has reached its final bottom. He continues to predict that Bitcoin will eventually fall into the $40,000-$50,000 region before the bear market concludes. Based on his calculations, he sees September to October 2026 as the most likely period for that bottom to form.
The analyst also pointed to several upcoming US economic data releases, such as ISM Manufacturing PMI, ADP employment figures, and nonfarm payrolls, as important events for financial markets. He explained that any signs of weakness in employment data combined with persistent inflation would place the Federal Reserve in a difficult position.
Looking ahead to the June Federal Open Market Committee meeting under Chair Kevin Warsh, the analyst said markets appear to be pricing in a dovish policy stance, but he remains skeptical that such an outcome will materialize.
Derivatives Market Still Struggles
Another factor supporting a similar outlook is the current state of the Bitcoin derivatives market. According to another analyst, Darkfost, the sector has yet to fully recover from the massive liquidation event on October 10, when nearly 71,000 BTC were wiped from open interest across major exchanges within hours. While activity has improved since then, total open interest across the Bitcoin derivatives market, excluding CME, remains below pre-liquidation levels, with roughly 351,000 BTC currently outstanding, down from nearly 375,000 BTC before the event.
However, Binance has bucked the trend, increasing both its open interest and market share since October. Such a trend could potentially indicate that trading activity has become increasingly concentrated on the exchange as investors gravitate toward deeper liquidity and market depth.
The post Here’s Why Bitcoin (BTC) Could Still Face Its Biggest Crash Ahead: Analyst appeared first on CryptoPotato.
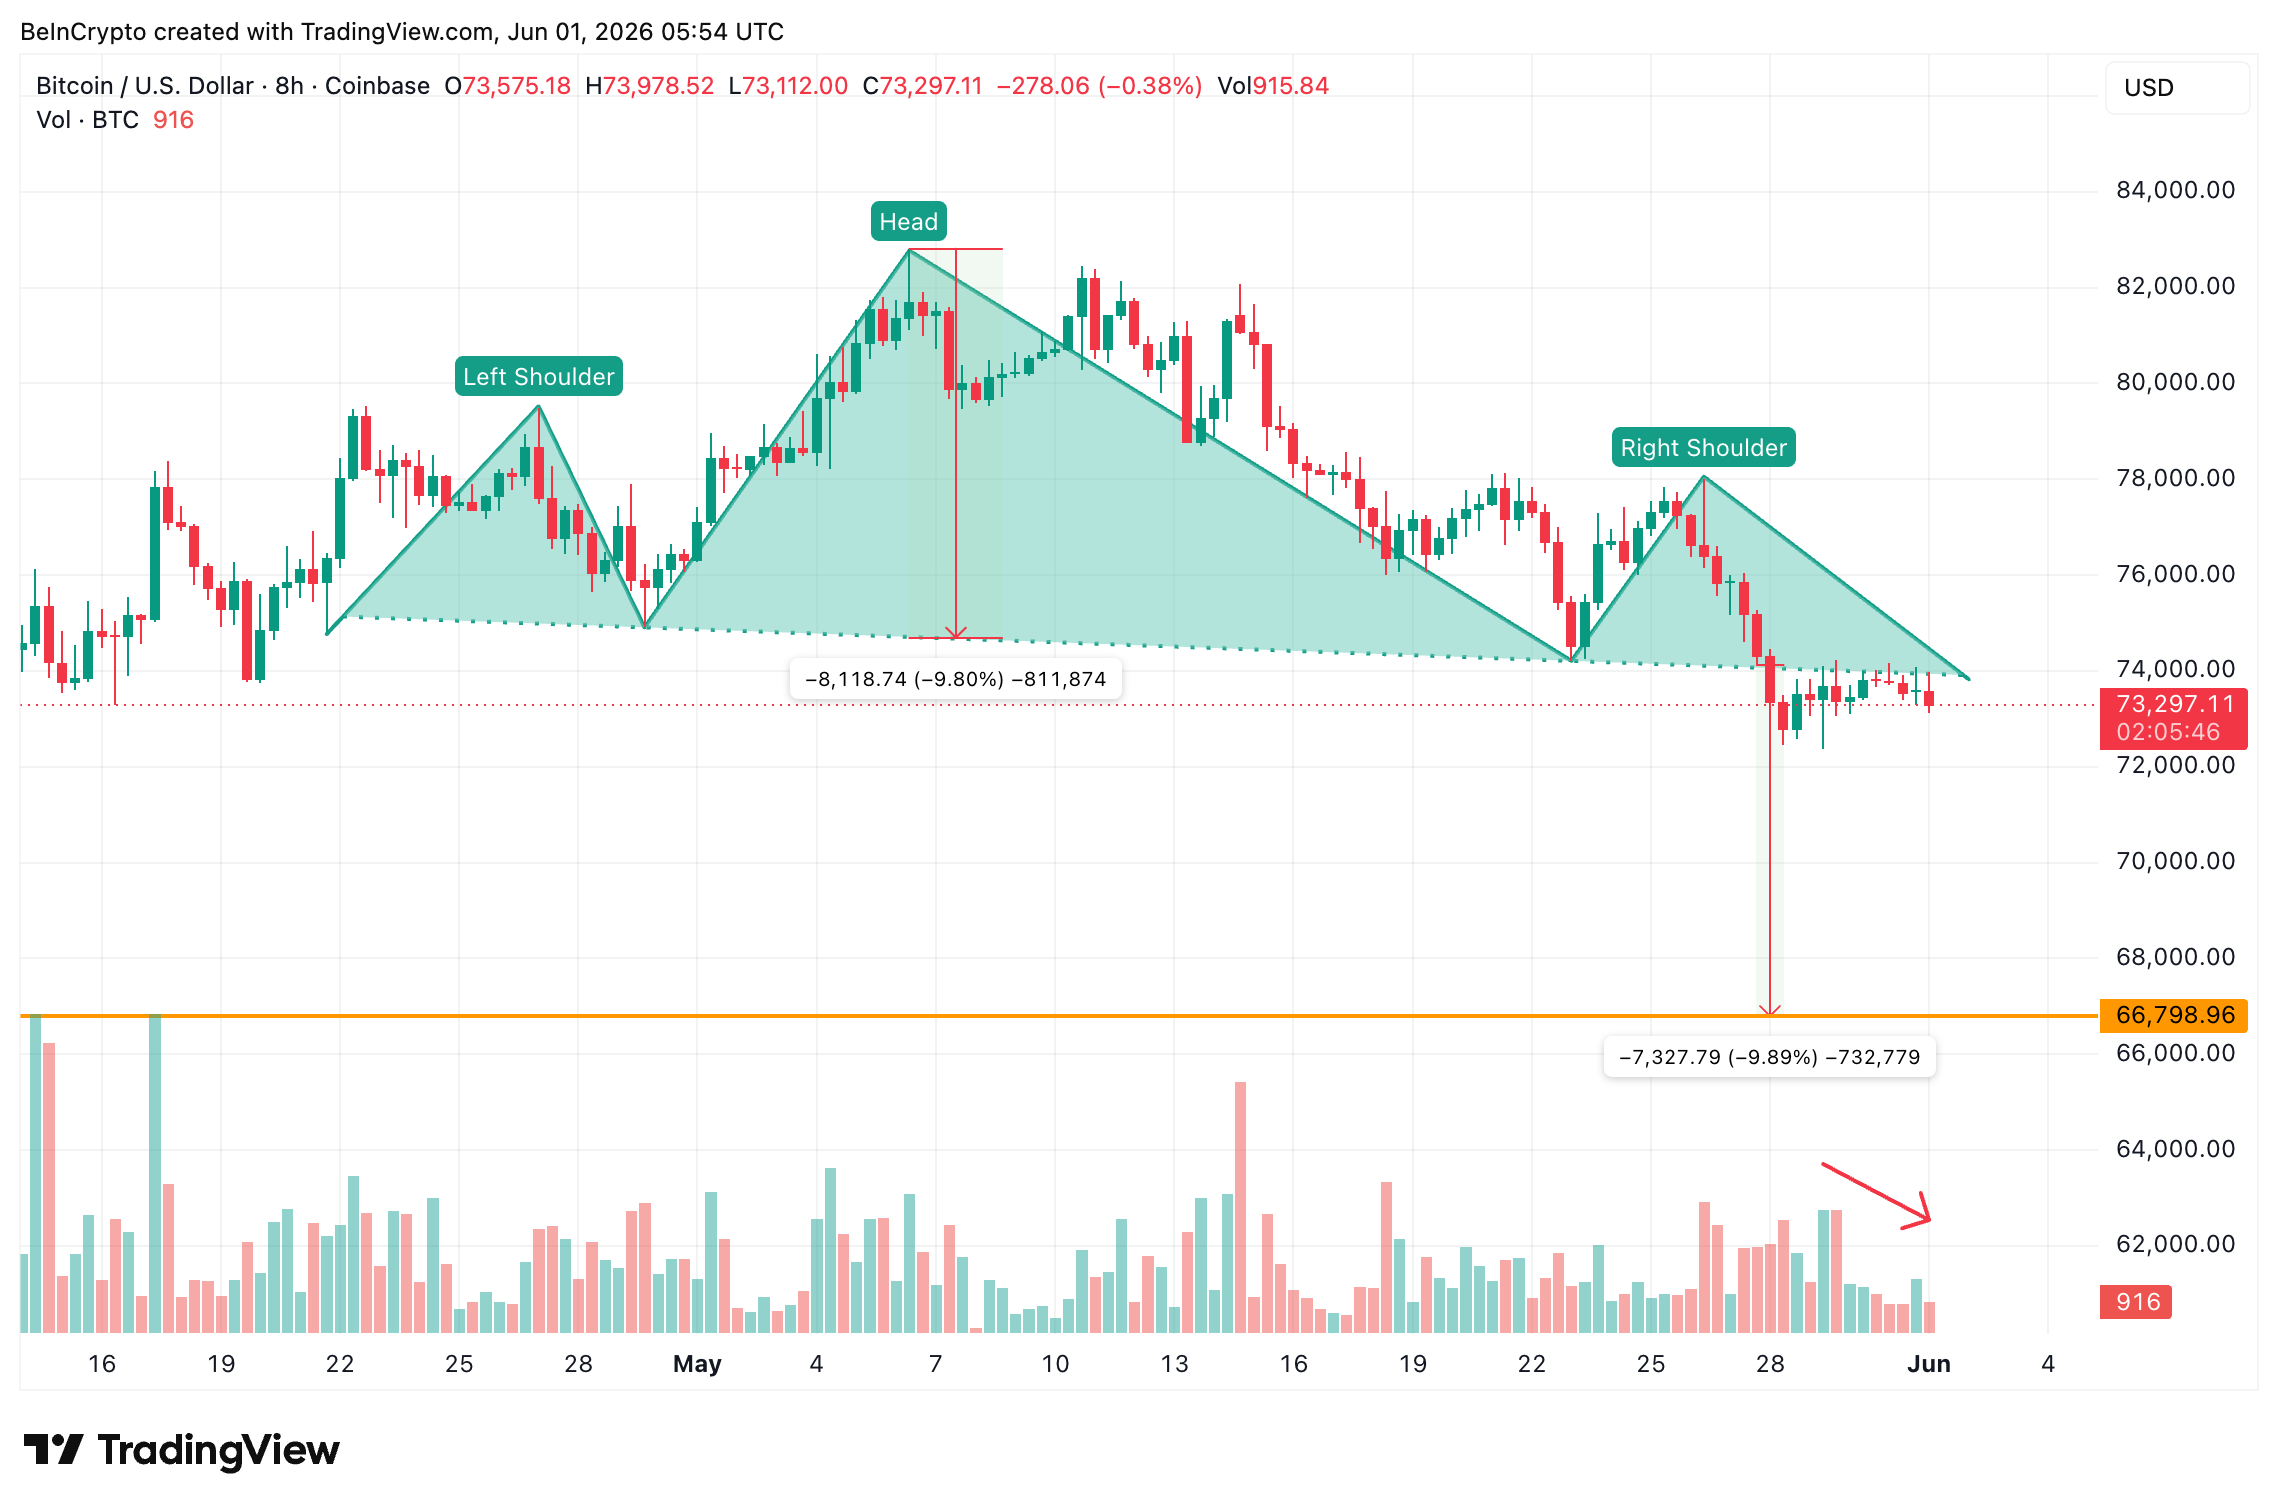
Bitcoin (BTC) price is sitting on a knife’s edge near $73,300 after a bearish pattern broke down on May 28, opening a path toward a roughly 10% slide.
Yet the breakdown has stalled. On-chain holders and a quiet derivatives market are quietly defending the line. And one technical level is the only thing standing between range-bound calm and a deeper crash.
Price Breaks Down a Bearish Pattern as Volume Dries Up
On the 8-hour chart, Bitcoin broke down from a head and shoulders pattern on May 28. It is a formation where price builds three peaks with a higher middle peak before slicing under a shared support line called the neckline. The break points lower, with $66,798 (the $66,800 zone) being the projected target. The breakdown was accompanied by a rise in sell-side volume.
Want more token insights like this? Sign up for Editor Harsh Notariya’s Daily Crypto Newsletter here.
However, the follow-through has been weak. Both green and red volume pillars have shrunk steadily since the May 28 breakdown, showing thinning interest below the neckline rather than aggressive selling.

That fading participation has let buyers defend the zone without much resistance. The result is a tight, undecided range instead of the sharp drop the pattern usually delivers. Whether that calm holds depends on what larger holders are doing beneath the surface.
Holders Add Coins as Open Interest Stays Thin
Beneath the BTC price, conviction appears to be shifting. The Hodler Net Position Change, a metric that tracks whether mid-to-long-term holders are net adding or distributing coins, has climbed since May 29, post pattern breakdown. The reading rose from roughly 38,056 BTC to about 40,309 BTC, an increase near 6%, suggesting accumulation rather than panic.

Meanwhile, leverage looks light. Bitcoin open interest, the total value of unsettled futures contracts, has fallen from $34.45 billion on May 14 to about $30.4 billion, one of its lowest levels in weeks.

Funding rates, the periodic payments between long and short traders that signal positioning bias, have flipped from negative 0.009% to positive 0.002%. That hints at mild optimism, though it appears too soft to fuel a violent move either way. With leverage drained and holders accumulating, the price chart becomes the decider.
Bitcoin Price Levels to Watch as the Neckline Battle Tightens
The 8-hour chart shows exactly where the fight sits. Bitcoin price broke under the neckline near $73,998 and then the $73,769 support. Yet, it has so far held the 0.618 Fibonacci level, a level that marks a key proportional pullback of a prior move, at $72,754.
That level is the trigger. A clean 8-hour close below $72,754, a drop of barely 1% from here, opens the measured move toward $71,310, then $69,470, and finally the $66,798 pattern target, the full roughly 10% decline from the neckline that broke earlier. The 0.618 has surprisingly held despite the pattern break with sizeable selling volume.

The caveat now is that thinning volume and light open interest mean the pattern could stall without an outside catalyst, such as a fresh macro or policy shock. To flip the bias, Bitcoin must reclaim $74,783, then $76,039 and eventually $78,068.
For now, $72,754 separates a contained range from a 10% breakdown toward $66,798 (the $66,800 zone).
The post Bitcoin Bulls Are Defending One Key Level, Losing It Means a 10% Fall appeared first on BeInCrypto.
Candlestick wicks often contain critical information about buying and selling pressure that body patterns alone may not reveal. By analysing wick length and position, traders can understand price rejection, momentum shifts, and liquidity zones.
In forex and CFD markets, sessions run long and liquidity shifts across the day. That setup often produces rejections at session boundaries, round numbers, and structural levels. Wick analysis trading may offer a quick read on sentiment that body-only views can miss. This article explains the candle wick meaning and outlines several strategies traders may use.
What Candle Wicks Show in Price Action
Candle wicks, or shadows, are the thin lines above and below a candlestick’s body that indicate how far the price moved during a specific period. The upper wick marks the highest price reached during the candle’s period, and the lower wick marks the lowest.
Candle wicks, extending beyond the body of the candlestick, offer a deeper insight into market dynamics than open and close price levels. Their lengths and positions relative to the candle body unveil the tug-of-war between buyers and sellers within a given timeframe.
Wicks reflect rejection and volatility in a single visual. Each wick records a price the market reached but failed to hold. Longer wicks point to wider intraperiod ranges and more aggressive two-way action. Short wicks suggest price stayed close to its open and close throughout the period.
A long wick candle to the upside suggests that buyers pushed the price higher, but sellers eventually overcame, driving the price down from its peak. Conversely, a lengthy lower wick indicates sellers initially dominated, with buyers making a strong comeback.
Such patterns are not merely reflections of high volatility; they signal potential market reversals or continuations, depending on their context and the prevailing trend. For instance, a series of increasing lower wicks in a downtrend could hint at a building bullish pressure. Traders often scrutinise these subtle cues, aligning them with other technical indicators to refine entry and exit points.
The table below summarises how the three main wick patterns are commonly read:
Wick Size and Candle Body Ratio
The wick-to-body ratio sorts candles into four rough categories of candlestick patterns.
Indecision candles have a small body between two long wicks. Both sides pushed price away from the middle and neither held ground. Doji and spinning tops fall into this group.
Rejection candles have a small body at one end of the range and a single long wick at the other. One side pushed hard before the other overwhelmed them, producing a rejection candle pattern often seen at key levels.
Momentum exhaustion shows up after a strong directional run. A large body with disproportionately long wicks suggests the move stretched far enough that opposing pressure started pushing back, hinting momentum rejection is building.
Strong momentum candles usually have a large body with small or no wicks. This reflects sustained directional pressure where price closed near the session high or low with limited rejection. Marubozu candles are a common example and are often associated with strong breakout or trend continuation moves.
Reading Market Conditions with Wick Analysis
Wicks serve as a lens to view underlying market conditions, offering insights into trader sentiment, potential reversals, and the strength of current trends. This analysis predominantly focuses on the length and frequency of long wicks, as they often carry more significant information than their shorter counterparts.
Context shapes what a wick is telling traders. A long wick on a 5-minute chart in a quiet session reads differently to the same wick on the daily at a multi-month high. Traders typically check the prevailing trend, the timeframe, and nearby structural levels before drawing conclusions from any single candle.
Trend Continuation
Long lower wicks during pullbacks in an uptrend, or long upper wicks during bounces inside a downtrend, often indicate the dominant side stepped back in to defend the trend. A cluster of these wicks across consecutive candles tends to reinforce the read. Traders sometimes treat them as a trend continuation signal aligned with the existing direction.
Reversal Risk
- Long Upper Wicks: Typically indicate a rejection of higher prices by the market, showing that buyers were unable to maintain control. When observed in an uptrend, these can signal an impending reversal or a pause in momentum as sellers start to outweigh buyers at higher prices. Upper wick trading typically focuses on these setups near established resistance.
- Long Lower Wicks: Suggest a rejection of lower prices, showing that sellers couldn’t keep the price down. In a downtrend, long lower wicks can be a precursor to a reversal, indicating that buyers are beginning to dominate the price action. Lower wick trading typically focuses on these setups near established support.
- Repetition and Placement: The significance of long wicks is amplified when they occur repeatedly over several candles or near key support and resistance levels. A series of candles with long upper wicks near a resistance area, for example, could hint at a strong selling pressure, suggesting an area for a reversal.
Failed Breakout
A wick that pierces a level and closes back inside the prior range is the textbook failed breakout candle signature. One side attempted to extend the move, found no follow-through, and price snapped back. These wicks are common after consolidation breaks that lack volume or wider confluence.
Liquidity Sweep
A long wick spiking through an obvious swing high or low before reversing may indicate a liquidity sweep, where price extended just far enough to trigger clustered stop orders before reversing. Wicks of this type often appear at session highs and lows, where stops tend to accumulate.
Common Wick Signals in Forex and CFD Markets
Forex wick trading and CFD wick analysis tend to focus on a handful of repeatable settings where wicks carry more weight than usual.
- Support and Resistance: Long wicks tagging well-tested horizontal levels often reflect support and resistance rejection, where resting orders at the level absorb the move.
- Session Highs and Lows: In forex, wicks forming at the highs and lows of the Asian, London, or New York sessions tend to mark zones where liquidity changes hands as the next session takes over.
- Moving Averages: Wicks rejecting dynamic levels such as the 50, 100, or 200-period moving average may suggest the average is acting as a trend filter for the period in question.
- Volatility Spikes: Wicks during news releases or sharp volatility expansions reflect volatility rejection as much as informed flow, so they often need follow-up confirmation before being trusted.
Wick Trading Strategies
The wick analysis trading strategies below share a common foundation. Each one treats a long wick as evidence of price rejection candle behaviour at a level that already carries technical weight. Wick candle trading is usually based on the conditions when the wick lines up with prior structure, a Fibonacci level, a moving average, or another reference point that other traders are also watching.
A single candle in isolation is rarely enough for candlestick wick analysis. Traders typically wait for the candle to close, look for confirmation from surrounding price action, and check the broader trend before treating any wick as a setup.
Now, let’s explore three long-wick trading strategies. If you’d like to see how they work in practice, consider following along in FXOpen’s TickTrader platform.
Long Wick During Trend Pullbacks

In the realm of long-wick candle trading, the strategy focusing on extended wicks during trend pullbacks may be insightful. The strategy focuses on temporary pullbacks within an established trend, using long wicks as signs of rejection and potential trend continuation.
Identifying the trend first is what separates wick candle trading from random wick-chasing. Traders typically look for a sequence of higher highs and higher lows in a bullish trend, or lower highs and lower lows in a bearish one. A 50- or 200-period moving average may also support the read on direction. On 15-minute and 1-hour charts, the trend is judged against intraday structure. On the 4-hour, traders typically take a broader swing view spanning several days.
Entry
- Traders watch for a long wick to form when the price begins to pull back to the previous range (i.e. at or above the last swing low in a bearish trend or at or below the last swing high in a bullish trend), indicating an area where the trend may continue.
- The presence of a long wick candle, usually at least a third or half its overall size, signals that market participants may be stepping in to support the overall trend.
Stop Loss
- According to the theory, a common approach is to set stop losses just beyond the entry candle for a buffer against market reversals.
- Alternatively, traders might place stop losses beyond a nearby swing point or a well-established support or resistance area.
Take Profit
- Profit targets might be identified by assessing upcoming resistance levels in a bullish scenario or support levels in a bearish scenario. Traders may also consider a fixed risk-reward ratio instead.
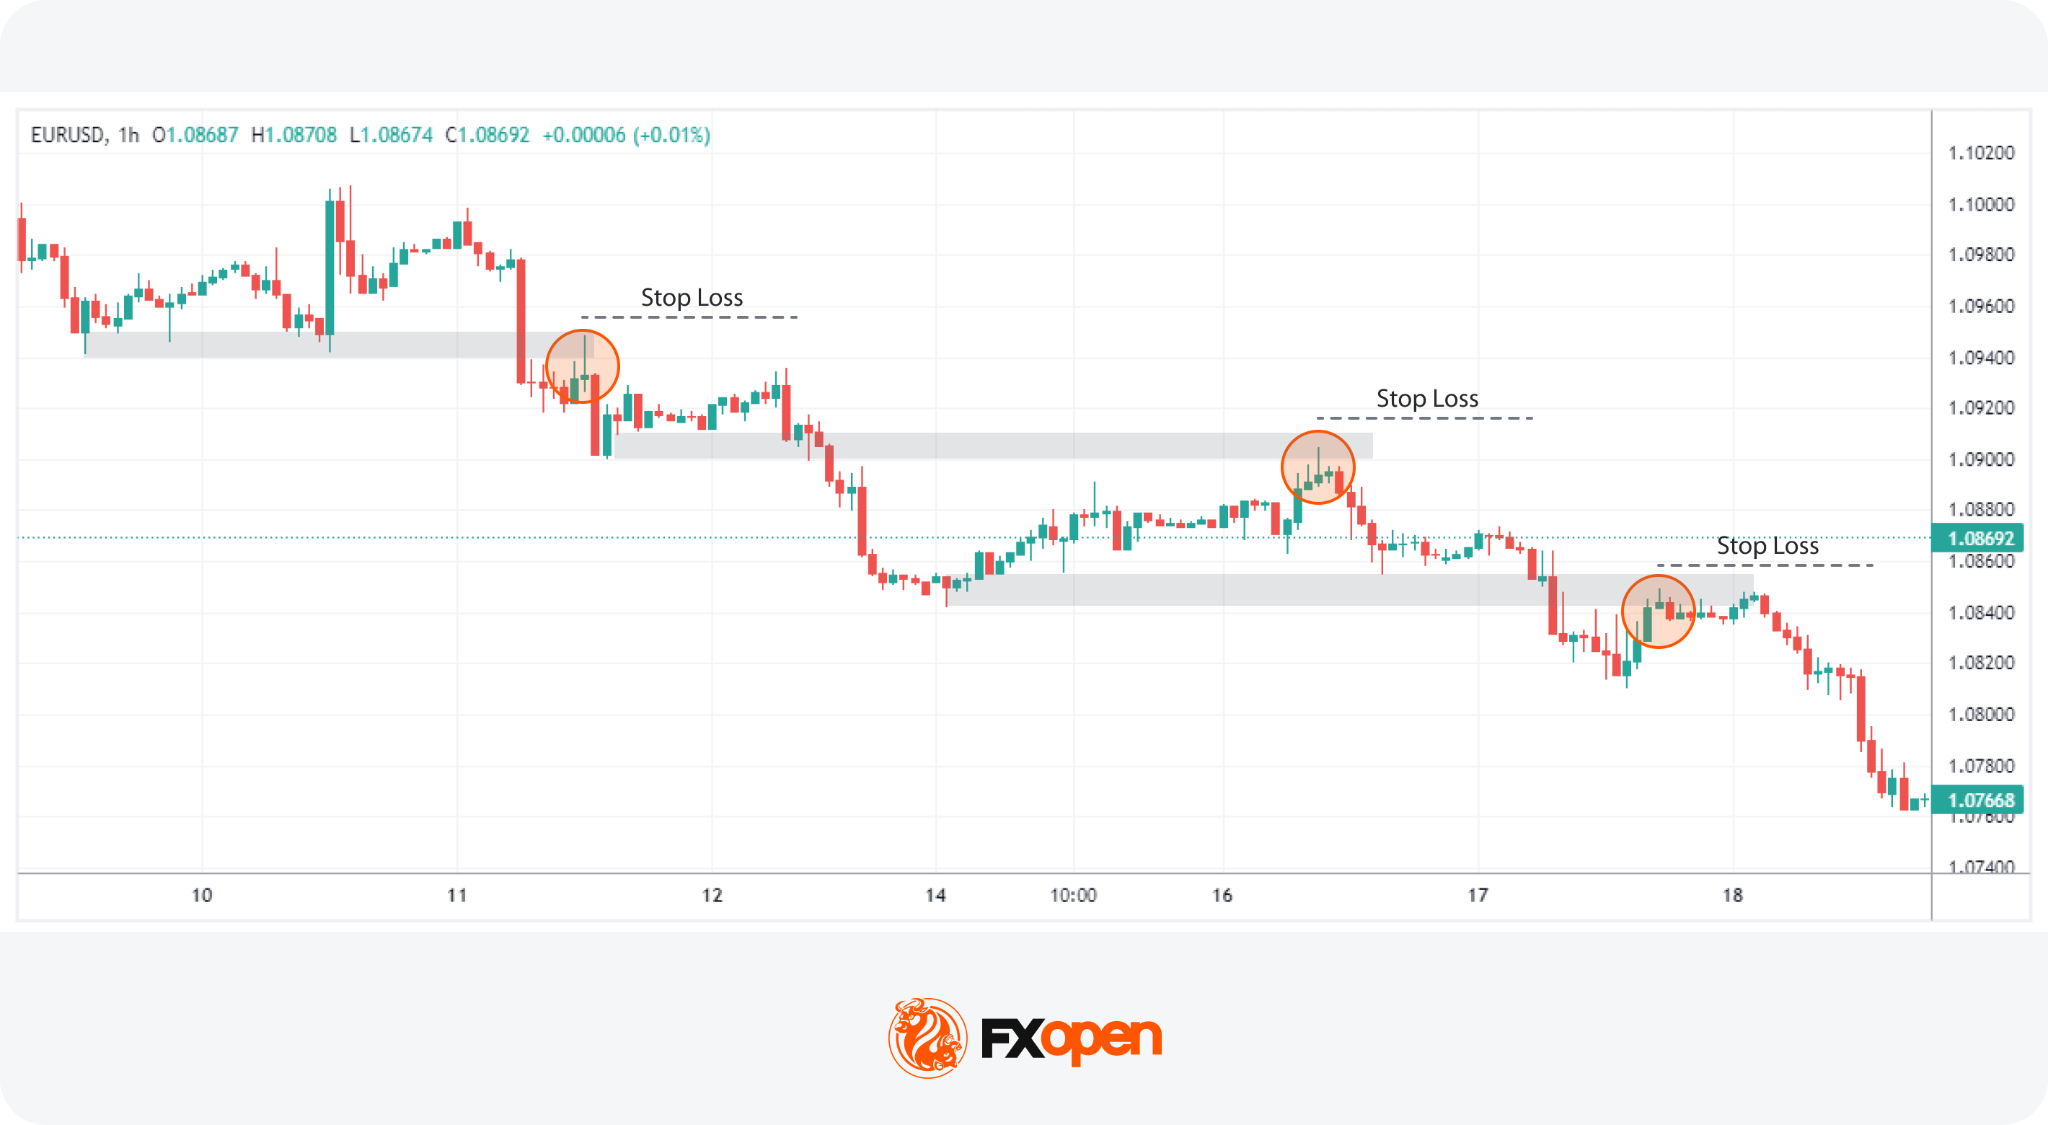
Wick Rejection Strategy at Support and Resistance
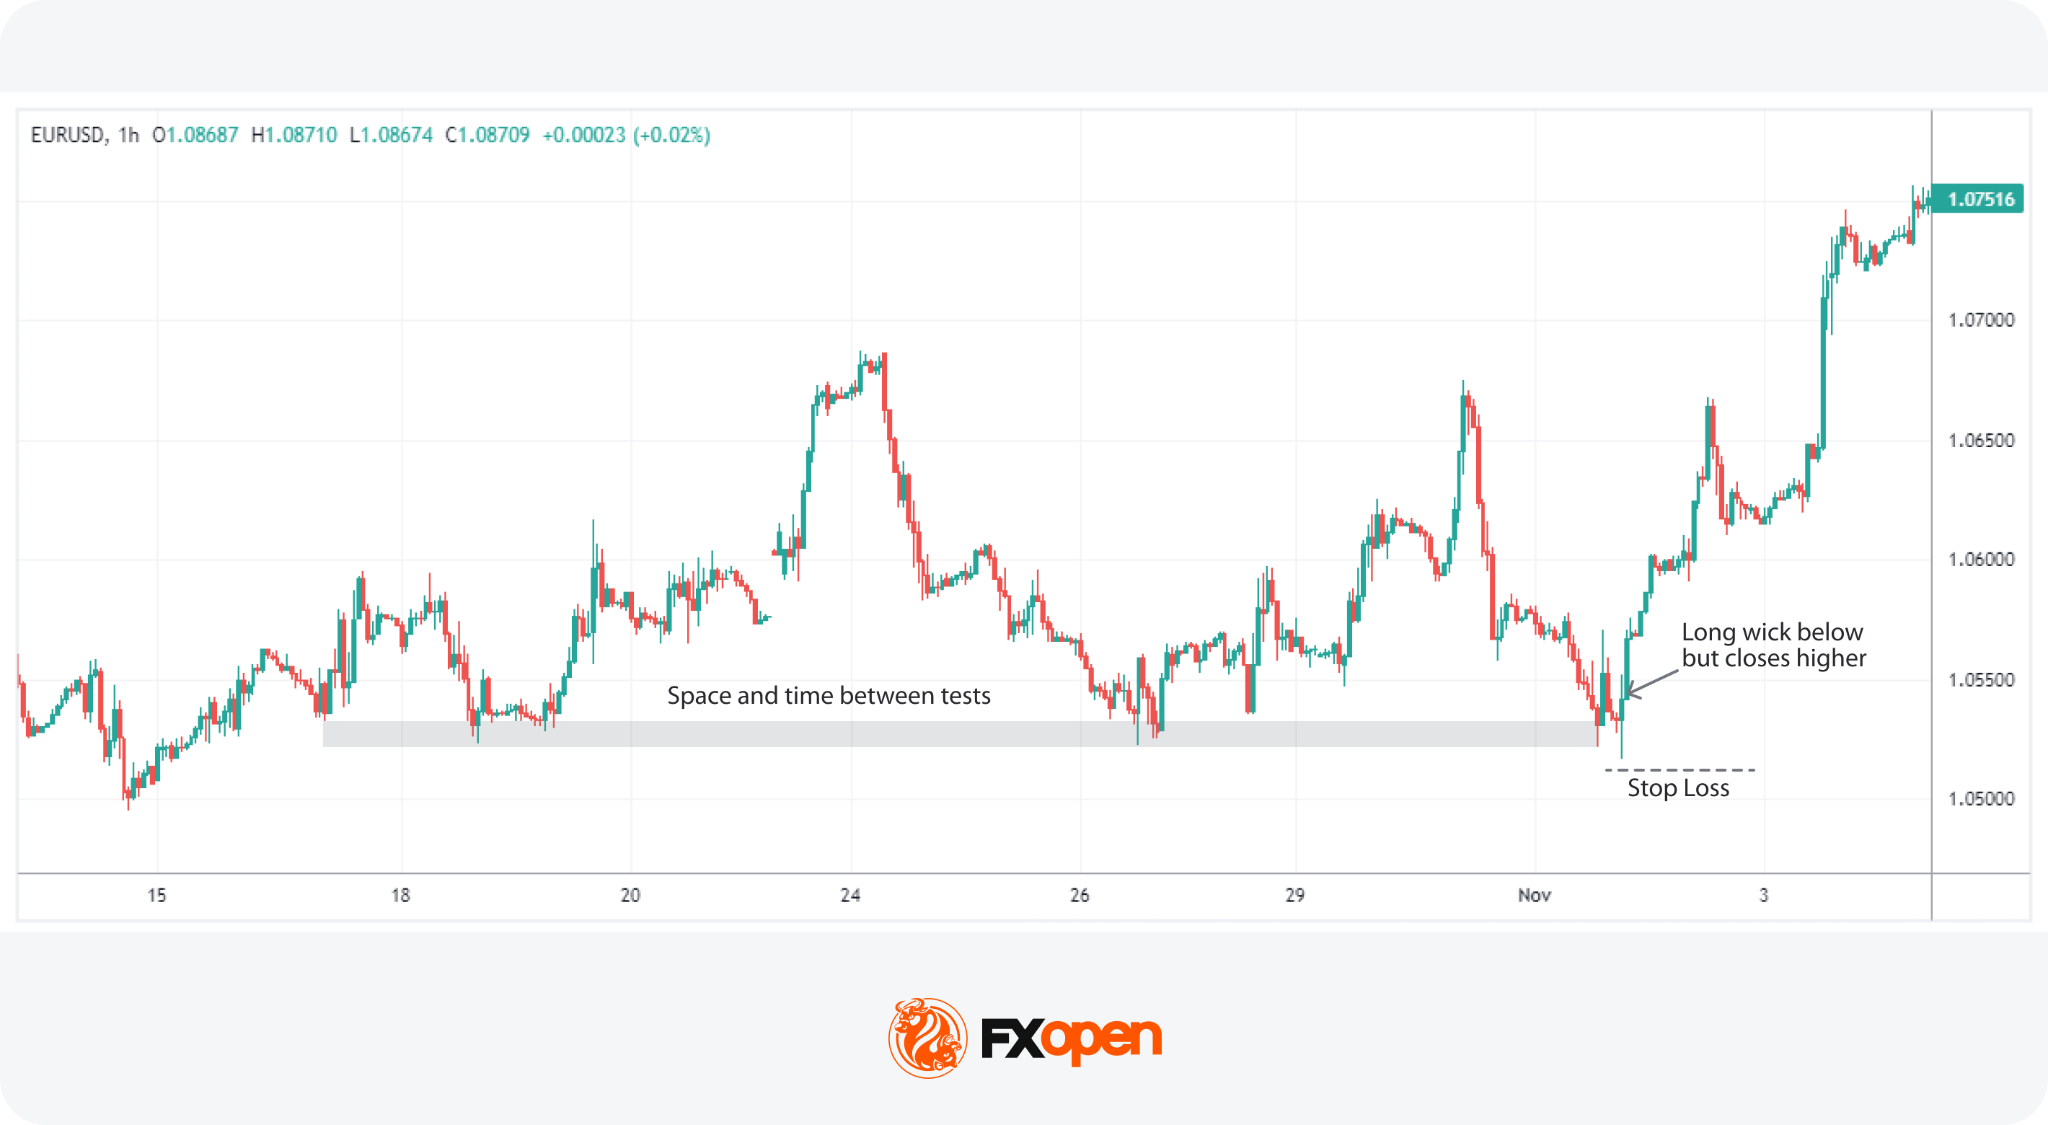
The strategy of focusing on long wicks on candlesticks at significant support or resistance levels leverages the market’s reaction to these critical areas. It’s a technique that thrives on the premise that major horizontal support or resistance, which have been tested multiple times with significant highs or lows, act as strong psychological barriers for price movements.
This method is more popular when there is clear visual space on the chart and considerable time between the tests of these areas, emphasising the significance of these levels.
When price briefly moves beyond support or resistance before quickly reversing, the resulting long wick may indicate rejection of higher or lower prices. Some traders interpret this type of move as a failed breakout, especially when the candle closes back inside the prior range.
On the risk-management side, traders often place stop losses beyond the wick high or low while keeping position size aligned with their overall risk limits.
Entry
- Traders often look for a candle that moves sharply into a major support or resistance area and then reacts away, leaving a long wick. This indicates a strong rejection of the price beyond these areas.
- A movement above or below the previous highs or lows, accompanied by a long bull wick or bear wick, adds confirmation to the trade setup.
Stop Loss
- Traders could set stop losses just beyond the candle’s high or low.
Take Profit
- Traders typically target an opposing support or resistance area for placing take-profit levels, as they expect a bounce from the tested level. However, some traders may opt for a fixed risk/reward ratio instead.
Wick Rejection Near Fibonacci Levels
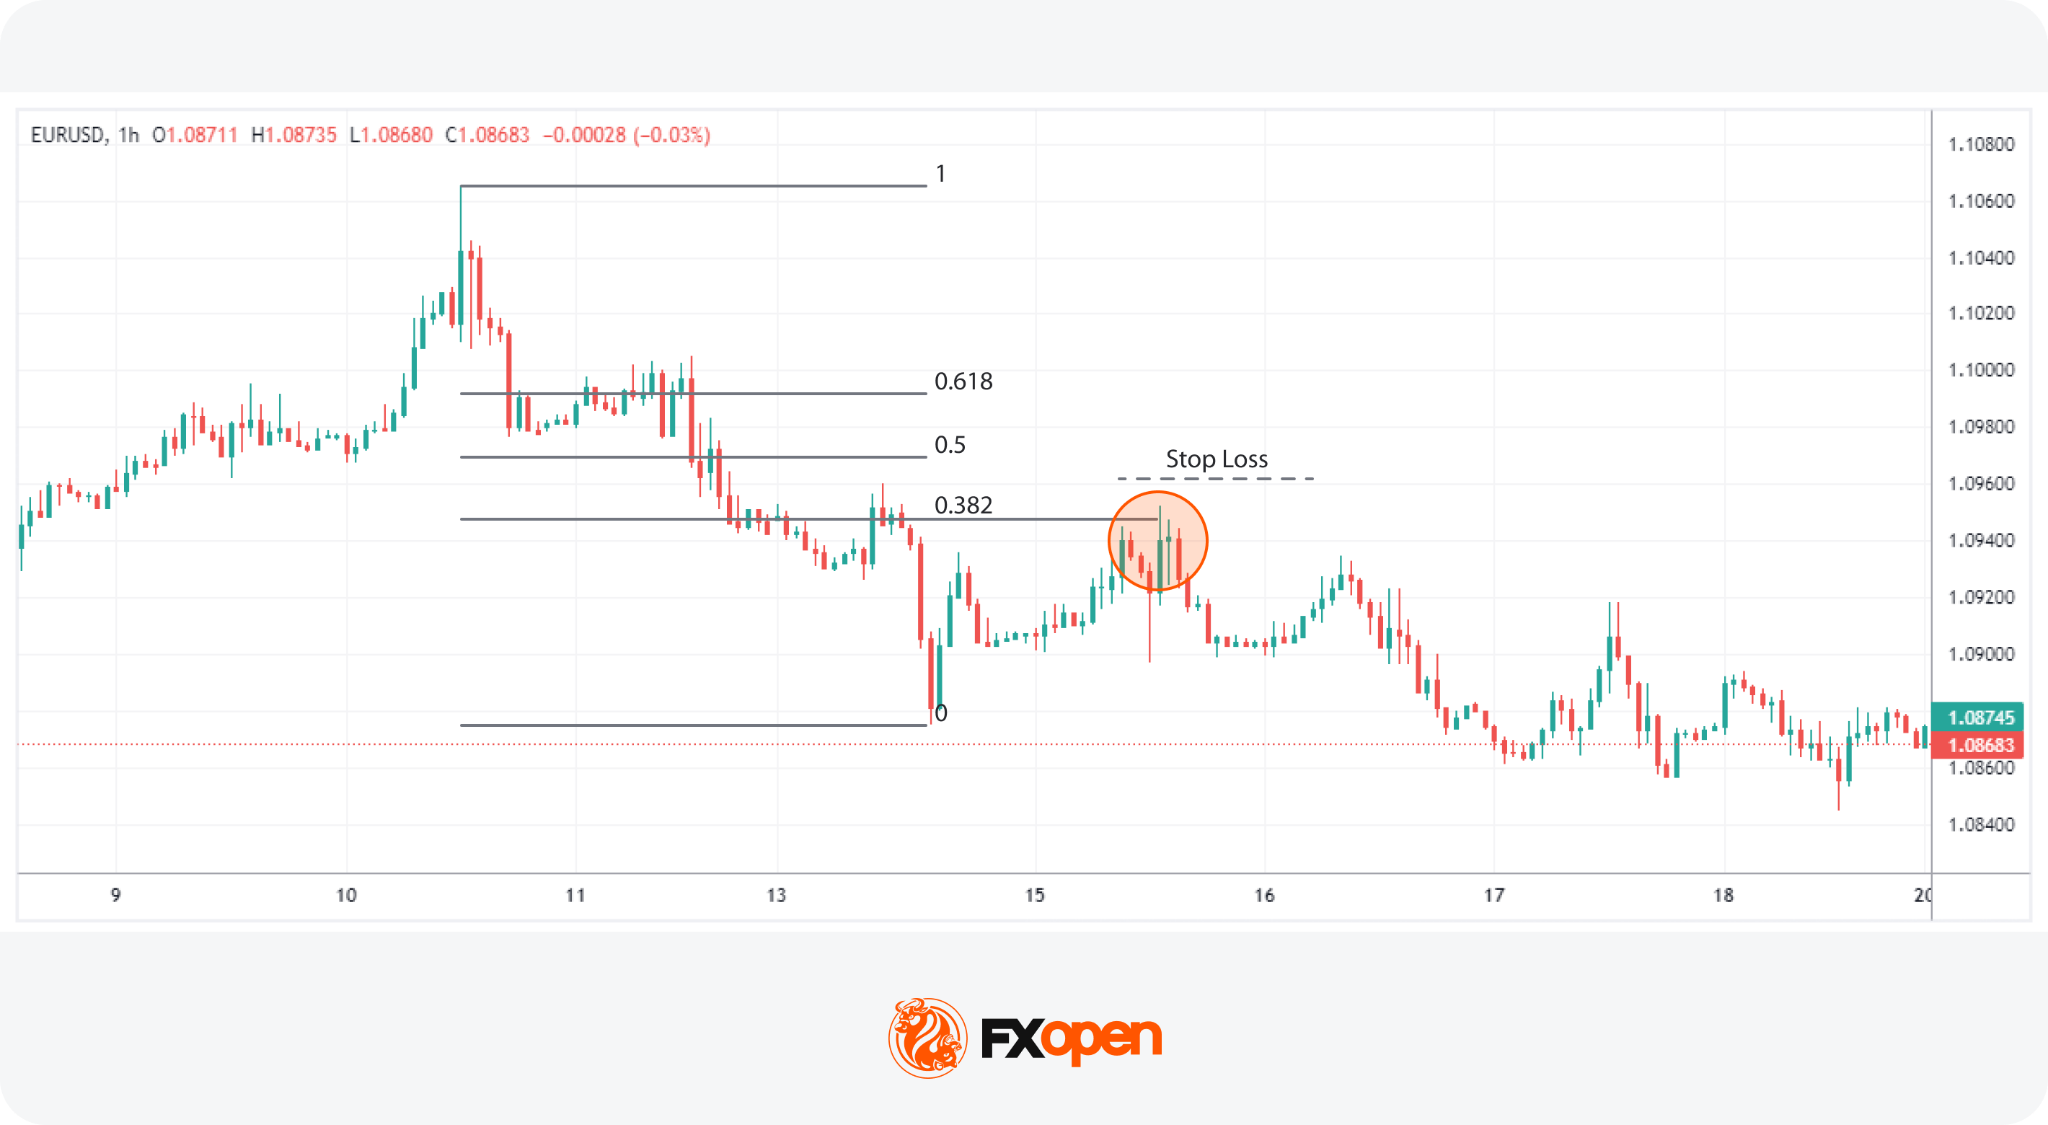
In this strategy, traders use Fibonacci retracements in tandem with candlestick analysis to anticipate trend continuations. The approach starts from a clear trend, with the retracement drawn across the most recent swing.
Fibonacci levels carry more weight when they line up with other technical reference points. Key levels of interest are the 0.382, 0.5, and 0.618 retracement levels, which act as zones of interest rather than precise lines. Traders look for them to overlap with horizontal support or resistance, a prior swing point, or a moving average. A long wick rejecting a Fibonacci level in isolation is generally read with more caution than the same wick at a Fibonacci-plus-structure confluence.
Entry
- Attention is centred on the 0.382, 0.5, and 0.618 Fibonacci retracement levels, awaiting price action that touches these zones.
- The presence of a long wick touching one of these zones reflects a strong rejection of further price movement against the trend, hinting at a potential continuation of the established trend.
- Additional confirmation is sought when these Fibonacci levels coincide with other recognised support or resistance areas, reinforcing the likelihood of a trend continuation.
Stop Loss
- Stop losses are typically positioned just beyond the wick, a nearby swing high/low, or the next Fibonacci retracement level.
Take Profit
- Profit targets might be set at the high or low used to draw the retracement, aiming to capture the full extent of the trend’s movement.
- Alternatively, traders may choose another significant support or resistance level as a profit-taking point based on the prevailing market structure.
Wick Analysis with Volume Confirmation
Candlestick wick analysis often works alongside volume. A wick that prints on noticeably higher volume than the surrounding candles tends to carry more weight than the same wick on thin participation. Relative volume, judged against an average of the prior 20 or 50 periods, is the common way traders frame this read.
Absorption is one behaviour worth watching. When price pushes into a level and the candle prints a long wick on elevated volume, it may suggest that resting orders on the defending side absorbed the move without giving ground. The wick records where buyers or sellers tried to extend the move, and the volume records how much pressure it took to push them back.
Rejection behaviour reads similarly. A long upper wick on heavy volume at resistance may indicate selling interest was meaningful rather than incidental. The same wick on light volume offers less confirmation, and traders typically treat it with more caution.
Traders using volume indicators in forex often supplement them with tools such as Volume Profile or session-based reads.
Common Considerations in Wick Trading
In the world of big wick candle trading, there are some common practices that traders may consider:
- Context: It’s common for traders to analyse wicks within the broader market context to make decisions based not only on one candlestick pattern, but also on other market factors.
- Volume Confirmation: Many traders look for volume confirmation to validate the signals provided by long wicks. A significant volume spike accompanying a considerable wick can indicate strong market interest at certain prices.
- Looking For Confluence: Likewise, seeking areas that coincide with other technical levels can add extra confirmation to a wick-based trade. Fibonacci retracements, support/resistance zones, and moving averages are commonly used.
- Practice Patience: Traders often exercise patience, waiting for the candle to close before making a move. This may help in avoiding false signals that might occur during the candle’s formation.
Avoiding Isolated Candle Analysis
A single wick says far less than the sequence around it. Traders typically zoom out before acting on any wick, checking the prior two or three candles for confirmation that rejection was sustained rather than fleeting.
A long lower wick that prints below support is one signal. The next candle closing back inside the range with a strong body is a second. Without that follow-through, the original wick can be a false alarm, especially during low-volume periods or news-driven spikes. Reading wicks alongside trend, structure, and at least one secondary signal tends to filter out the noise that catches traders acting on a single bar in isolation.
Limitations of Wick Analysis
Wick trading strategy approaches have real limits and traders typically build that into how they use them:
- Low liquidity periods: in thin sessions such as the Asia-Pacific open or late Friday trading, wicks can form on minimal flow. A wick built from a handful of ticks reflects sparse participation more than meaningful rejection.
- News spikes: economic releases and central bank announcements often produce dramatic wicks that have little to do with technical structure. These tend to revert as algorithms unwind initial reactions, so the wick can be misleading as a setup.
- Ranging conditions: in choppy, sideways markets, wicks form constantly at the range extremes and most lack predictive value. The signal-to-noise ratio drops sharply outside trending environments.
- False signals: even in clean conditions, a meaningful share of wick setups fail. Wicks are probabilistic reads on order flow, not certainties.
Wick analysis is usually used as one input in a broader technical framework that also draws on trend identification, structural levels, volume, and risk management. Treating it as a standalone system invites the limitations above to dominate the results.
Summary
While candle wicks may seem like minor visual elements, they often reveal some of the market’s most telling signals. From highlighting rejection zones to exposing failed breakouts, wicks can support traders when building a trading strategy. Many traders use wick analysis inside a broader price action trading framework, alongside trend identification, structural levels, volume, and risk management rather than in isolation.
If you would like to trade with over 1,200 tools and indicators, you can consider opening a forex trading account with FXOpen and gain access to trading in over 700 markets.
FAQ
What Do Long Wicks Mean in Trading?
Long wicks indicate a potential rejection of a given price level. A long upper wick suggests selling pressure after a price hike, while a long lower wick indicates buying support following a drop.
How May Traders Read Candle Wicks?
To read candle wicks, traders examine their length and direction. A long wick signals rejection of prices, especially if it occurs at a support or resistance area. Upper wicks denote selling pressure; lower wicks point to buying interest.
How May Traders Trade Candle Wicks?
Trading candle wicks involves analysing long wicks for potential market reversals. Traders often look for wicks at support or resistance levels as signals to enter or exit trades, using them alongside other indicators for confirmation.
What Is the Candle Wick Trading Strategy?
The candle wick trading strategy utilises the presence of long wicks as indicators for making trading decisions. This approach relies on the idea that wicks signify price rejections and potential shifts in market direction, aiding in identifying entry and exit points.
What Does a Long Upper Wick Indicate?
A long upper wick indicates that buyers pushed price higher during the period but sellers reclaimed control before the close. It typically reflects rejection of higher prices. Near resistance or after an extended rally, it may suggest weakening demand and the potential for a reversal or pause in the trend.
Can Wick Analysis Be Used in Forex Trading?
Yes. Wick analysis is widely applied across forex pairs, particularly at session highs and lows, round-number levels, and major support and resistance zones. Forex traders often combine wick reads with broader price action and risk management rather than treating any single candle as a standalone signal.
What Timeframe Is Commonly Used for Wick Analysis?
Wick analysis works across timeframes, though the read changes with each one. Day traders often watch 5-minute and 15-minute charts, swing traders favour the 1-hour and 4-hour timeframes, and position traders typically focus on daily and weekly candles. Higher timeframes generally produce wicks that carry more weight.
Are Wick Signals Reliable During News Events?
Wick signals during major news events may be weak. Sharp volatility, widened spreads, and algorithmic reactions can produce dramatic wicks that revert quickly. Many traders avoid acting on wicks formed inside news windows and wait for the market to settle before reassessing the technical picture.
This article represents the opinion of the Companies operating under the FXOpen brand only. It is not to be construed as an offer, solicitation, or recommendation with respect to products and services provided by the Companies operating under the FXOpen brand, nor is it to be considered financial advice.

US Strikes Iranian Radar Sites as Kuwait Reports Drone and Missile Fire in Escalating Conflict

NYDIG Suggests $1.3B IBIT Trader Wanted Quick Exit

Selena Gomez’s Woven Mary Janes Are Summer’s Chicest Shoe


-

 NewsBeat5 days ago
Israel says it has killed new Hamas military leader in Gaza City airstrikes
-

 Tech5 days ago
NASA taps Blue Origin to deliver lunar rovers for Moon Base initiative
-

 Politics7 days ago
Bridgerton Season 5: Cast, Release Date And Everything We Know So Far
-

 Sports6 days ago
2026 NBA Finals schedule, odds: Knicks await Thunder or Spurs after winning East
-

 News Videos5 days ago
XRP *JUST* SUCCEEDED!!!! CLARITY ACT EXPOSED!!! (SHE EXPOSED IT)
-

 News Videos3 days ago
This is BROKEN! INSANE 5x MONEY CAR WASH WEEK! The NEW GTA Online UPDATE Today! (GTA5 New Update)
-
Crypto World5 days ago
Micron Crosses $1 Trillion Market Cap as AI Demand Reshapes Memory Sector
-
 NewsBeat7 days ago
Hottest May day ever as London hits 34.8C in 2C leap from previous records
-

 Business5 days ago
Selena Gomez Reportedly Upset Over Benny Blanco’s Comments on Her ‘Terrible’ Diet
-
 Tech6 days ago
China assigns ID codes to 28,000+ humanoid robots
-

 Business6 days ago
Nikkei 225 Surges Past 65,000 for First Time as Iran Peace Hopes Fuel Record Rally
-

 Business7 days ago
BTS Sells Out Four Las Vegas Shows at Allegiant Stadium for ARIRANG World Tour
-

 Tech7 days ago
Microsoft’s quiet Claude Code retreat and the real cost of enterprise AI
-

 Tech3 days ago
Waymo dominates autonomous vehicle registrations as Tesla trails behind
-
 Entertainment6 days ago
‘Breaking Bad’ Star’s Easy-to-Binge 6-Part Crime Series Spin-Off Is Finally Heading to Free Streaming
-

 NewsBeat7 days ago
Crowds find riverside shade in York as temperatures soar
-
Tech5 days ago
The Samsung pay deal is the moment Korean unions changed register
-

 Tech7 days ago
Westone Audio and Etymotic Acquired by Fidelity Collective in Major IEM Market Move
-

 Entertainment6 days ago
Days of our Lives 2-Week Spoilers May 25-June 5: Gwen Rages, Abe Confesses & 2 Tragic Anniversaries!
-

 Tech5 days ago
Millions of AI agents imperiled by critical vulnerability in open source package
You must be logged in to post a comment Login