
Crypto World
Google DeepMind joins South Korea’s K-Moonshot to tackle scientific challenges with AI


Google DeepMind has entered into a partnership with South Korea to provide the technical backbone for the country’s K-Moonshot initiative, an ambitious national programme designed to solve the most complex scientific challenges of the century using AI.
Summary
- Google DeepMind partners with South Korea on K-Moonshot, exchanging AI models and data to tackle scientific challenges across life sciences, climate, and meteorology.
- Google to build its first global AI campus in Seoul, with plans for researcher training, industry collaboration, and potential deployment of U.S.-based engineers.
According to recent reports, the collaboration will span several high-stakes fields such as life sciences, meteorology, and climate research. To accelerate progress, both sides have committed to a deep exchange of AI models, specialized tools, and vast scientific datasets.
The agreement was inked in Seoul on Monday by DeepMind Chief Executive Demis Hassabis and Deputy Prime Minister and Science Minister Bae Kyung-Hoon. As a core part of this deal, Google will establish a dedicated AI-focused campus in Seoul.
This facility marks the first of its kind for the company globally and is expected to serve as a melting pot for local engineers, startups, and academic institutions while hosting elite training programmes for Korean researchers.
Officials from the South Korean government said they have already requested that Google dispatch at least ten senior engineers from its U.S. headquarters to provide on-the-ground support for the initiative.
While Demis Hassabis indicated the company is carefully considering this request, he also highlighted plans to strengthen existing ties with local industrial giants, including Samsung, SK Hynix, and Hyundai’s Boston Dynamics.
The partnership will also prioritize the ethical side of innovation by including joint work on AI safety. This cooperation will extend directly to Korea’s AI Safety Institute to ensure that these new technologies are developed with rigorous oversight.
For the uninitiated, K-Moonshot is South Korea’s premier science and technology roadmap built around twelve transformative goals. These targets include revolutionary breakthroughs in AI-led drug discovery, the quest for sustainable fusion energy, and the creation of next-generation humanoid robotics.
Deal follows Alphabet’s expanded AI investment push
The collaboration comes shortly after Alphabet Inc. outlined a major funding commitment to AI firm Anthropic, signalling continued momentum in the sector.
Alphabet said it would invest $10 billion upfront, with plans to commit up to $30 billion more over time. The total package could reach $40 billion if the company meets performance and usage milestones.
Anthropic added that the initial investment values the firm at $350 billion, matching its February round and placing it among the most highly valued startups globally.


Key Takeaways
- GEV stock has climbed 209% in the past year and recently reached fresh 52-week peaks
- First quarter earnings per share of $17.44 demolished the $1.95 forecast — an exceptional 790% outperformance
- BNP Paribas moved GEV to Hold from Buy, pointing to maxed-out turbine production capacity until decade’s end
- Analyst price targets surged 22% post-earnings, with the consensus reaching $1,179
- Buy ratings from 74% of covering analysts substantially exceed the typical S&P 500 range of 55–60%
GE Vernova’s performance has been nothing short of spectacular on the market. Leading into the current week, shares had soared 209% across the trailing twelve months — including a remarkable 76% gain in 2026 year-to-date. Fresh all-time highs followed an exceptional quarterly report, yet the company now confronts an unexpected analyst downgrade.
BNP Paribas downgraded GEV from Buy to Hold this week in a move that caught market attention. The rationale was direct: while current performance is strong, GE Vernova has effectively booked its turbine manufacturing capacity completely through 2030, creating a ceiling on near-term expansion potential. Despite the downgrade, BNP elevated its price objective to $1,190 from $765 — a threshold the stock traded beneath just weeks ago in February.
GEV shares declined 1.6% in Monday’s premarket session, trading near $1,131.
Quarterly Performance That Shocked the Street
The first quarter results that sparked this discussion were remarkable by any measure. GE Vernova delivered earnings per share of $17.44 versus Wall Street’s $1.95 projection — representing an approximately 790% outperformance. Revenues reached $9.34 billion, surpassing the $9.19 billion consensus and marking 17% growth year-over-year.
Management also upgraded its free cash flow outlook and highlighted data center electrification as a central catalyst for expansion. The voracious power requirements of AI infrastructure are creating electricity demand at levels unseen in decades, positioning GE Vernova directly in line with this secular trend.
Shares rallied nearly 14% following the earnings release. Analysts responded by broadly increasing their price projections — the mean target climbed from $968 to $1,179, representing a 22% weekly jump.
Robert W. Baird established a $1,400 target while maintaining an Outperform stance. Goldman Sachs confirmed its Buy rating with a $1,328 price objective. Morgan Stanley increased its target to $960 alongside an Overweight rating. Current consensus stands at Moderate Buy with a mean price target of $1,077.
Institutional Activity Signals Confidence
Institutional investor behavior tells a story of growing conviction. Capital World Investors expanded its GEV holdings by 1,907.5% during Q3. Franklin Resources increased exposure by 170%, while SG Americas grew its stake by more than 10,000%. Both Raymond James and Nordea made substantial position additions.
The notable exception was the State of Michigan Retirement System, which reduced its holdings by 3.5%, disposing of 2,600 shares to conclude the quarter holding 71,040 units valued at approximately $46.43 million.
Even with BNP’s recent downgrade included, 74% of Wall Street analysts maintain Buy ratings on GEV — significantly higher than the 55–60% Buy-rating baseline for S&P 500 constituents.
The stock’s 12-month low stands at $356.94. Last week saw a 12-month high of $1,181.95. GEV trades at a P/E ratio of 33.45 with a market capitalization approaching $308.63 billion. The company distributed a $0.50 quarterly dividend on April 14th.


Elon Musk’s Grok AI predicts has issued sweeping 2026 price targets for Solana and Ethereum, and the crypto community is paying attention.
SOL currently trades around $85, while ETH sits near $2,300, both consolidating amid macro headwinds and growing institutional demand. The forecasts are bold enough to warrant a closer look at what’s actually driving them.
Grok’s projections place Solana between $210 and $290 by December 2026, a 2.4x to 3.3x move from current levels, citing catalysts including Goldman Sachs’ $108M SOL ETF stake and the Zepz remittance partnership as structural demand drivers.
For Ethereum, Grok’s base case lands between $4,900 and $6,700, with a higher-conviction $7,500 target circulating across Binance Square analysis, implying a 2.6x gain from present prices.
XRP sits in a similar position, trading near $1.43 while quietly benefiting from one of the clearest regulatory narratives in the market.
Grok projection would reasonably place XRP in the $3.80 to $5.20 range by December 2026, implying a 2.6x to 3.6x move, driven by potential legislative clarity around digital assets, renewed institutional flows through RippleNet and ODL corridors, and expanding relevance in tokenization and cross-border settlement.
The setup is less about hype and more about regulatory unlock acting as a delayed catalyst, meaning upside likely hinges on policy timing aligning with broader market strength.
Whale accumulation data and potential U.S. strategic Bitcoin reserve proposals are amplifying bullish sentiment across both assets. Whether those targets are realistic depends heavily on one question: does macro cooperate?
Can Solana Hit $350 and Ethereum Reach $5,800 by Late 2026?
SOL price looks like it is done falling for now and is starting to build a base around the $80–$88 zone, which is usually how reversals begin, quiet, low volatility, and no hype.
As long as $80 holds, the structure stays intact, and this looks more like accumulation than weakness, with the real upside only unlocking once it pushes back toward the $120–$140 resistance range.
ETH price is in a similar spot, just on a bigger scale. It is not breaking out yet, but it is holding key support and compressing, which often comes before a larger move. The key level to flip things is a break toward the upper resistance zones, where momentum can accelerate quickly.
The bigger picture is still constructive. If institutional flows keep building and macro conditions stabilize, both assets have room to move higher over time, but it is likely a grind first, not an instant breakout.
The risk is clear, though. If SOL loses $80 or ETH drops below its key support, the whole bullish structure weakens, and the timeline for any recovery gets pushed back.
Why GROK AI Predicts XRP Could Have High Odds Of Hitting Its Target First
XRP price is showing a much heavier structure than SOL or ETH right now, still in a clear downtrend on the higher timeframe, but starting to stabilize around the $1.30–$1.45 range.
That zone is acting as a base after the sharp February flush, with price moving sideways and volatility cooling off, which is typically where accumulation begins if sellers are exhausted.
The key level to watch is reclaiming $1.60–$1.70, because that is where the last lower high sits, and breaking it would be the first real signal that structure is shifting.
Until then, this is more of a range than a confirmed reversal. If $1.30 breaks, the downside likely opens again toward $1.10, but if it holds and builds, this could quietly turn into a bottoming phase before any larger move.
Grok Prefer New Launches Because It Could Give Higher Returns, Bitcoin Hyper Is Next?
Even if those larger targets play out, SOL and ETH remain large-cap assets, meaning the upside is real but not explosive. The asymmetry just isn’t the same once a project is this big.
That is why some traders look earlier in the cycle, where the market cap is still forming, and the upside is not fully priced in.
Bitcoin Hyper is trying to sit right in that gap, building a Layer 2 on Bitcoin with SVM integration to bring faster execution and smart contracts into the BTC ecosystem. The idea is to combine Bitcoin’s security with the speed and flexibility usually found on chains like Solana.
The presale has already raised over $32.5M at $0.0136792, suggesting steady demand and growing interest. Features like staking and the bridge design aim to make it functional, not just narrative-driven.
But it is still early, and that comes with trade-offs. Liquidity is unproven; execution matters, and how it performs post-launch remains uncertain.
So the setup is clear, large caps offer more stability with limited upside, while something like Bitcoin Hyper offers earlier positioning with higher potential, but also higher risk.
The post Elon Musk’s Grok AI Predicts the Next XRP Price, Solana and Ethereum Moves appeared first on Cryptonews.


- The USDPT stablecoin will run on Solana and be issued via Anchorage Digital.
- Launch is planned for May 2026 after final rollout preparations.
- Western Union links crypto wallets to its global cash network.
The Western Union CEO, during the Western Union’s first-quarter earnings discussion, announced that the company is moving closer to launching its dollar-backed stablecoin USDPT on the Solana blockchain, with a rollout targeted for May 2026.
The update comes after months of internal development around Western Union’s broader digital asset strategy, which aims to combine blockchain settlement with its long-established global cash transfer network.
USDPT moves from concept to near launch
USDPT, short for US Dollar Payment Token, is a fully dollar-backed stablecoin designed to operate on the Solana network.
The token will be issued through Anchorage Digital Bank, a federally regulated crypto institution in the United States.
This structure places regulatory oversight at the centre of the project, while still allowing blockchain-based settlement.
According to details shared by Western Union, the stablecoin will be integrated into a newly developed system known as the Digital Asset Network.
This network will connect crypto wallets, exchanges, and digital platforms directly to Western Union’s physical cash-out infrastructure, which spans more than 200 countries and hundreds of thousands of agent locations worldwide.
The system is designed to allow users to move between digital dollars and physical cash without relying on traditional banking intermediaries.
Users will be able to send USDPT on-chain and withdraw local currency at Western Union locations.
Solana chosen for speed and scale
Solana has been selected as the underlying blockchain for USDPT due to its high throughput and low transaction costs.
The network can process thousands of transactions per second, with settlement times measured in seconds.
This aligns with Western Union’s requirement for high-volume remittance flows.
Notably, Western Union processes millions of cross-border transactions annually, many of which involve small-value transfers.
The company has highlighted that traditional settlement systems often take several days and rely on multiple intermediary banks, while, in contrast, USDPT on Solana is expected to reduce settlement time to near-instant execution while lowering operational costs.
Anchorage Digital Bank will handle issuance and custody, ensuring that each USDPT token remains fully backed by US dollar reserves under regulated standards.
Launch timeline set for May 2026
While earlier guidance placed the rollout within the first half of 2026, the latest update narrows the timeline to May 2026.
The project is described as being in its final preparation phase, with technical integration and network testing underway.


For two years, Litecoin’s social media managers laughed at Solana’s blockchain outages. This weekend, they had to eat their own words as Litecoin’s blockchain suffered its own denial-of-service and double-spending attack.
Repeated Solana outages drew smug chuckles from Litecoin. Unlike Solana, according to its sustained declarations, Litecoin doesn’t have outages.
On Saturday, that talking point died. Litecoin definitely had an outage, as well as a double-spending problem.
A consensus bug in Litecoin’s privacy upgrade let an attacker mint invalid coins. Looking to double-spend as quickly as possible, the attacker rapidly traded LTC for other digital assets at crypto exchanges before honest miners could stop the sales.
Its blockchain split. Eventually, miners rolled-back transactions, creating about 32 minutes of de facto downtime.
Interestingly, due to the unusually slow mining times during the attack, it actually took over three hours in real-time for the network to produce the 13 replacement blocks that would have normally consisted of just 32 minutes worth of transactions.
Anyway, the Litecoin Foundation then explained its 13-block reorganization to its own followers.
No more 100% uptime
Just weeks earlier, Litecoin boasted of its “100% uptime,” claiming its blockchain “100% works” after being “100% battle-tested.”
Litecoin’s account spent 2024 and 2025 laughing at Solana’s problems without fixing its own.
When Solana scheduled maintenance for a weekend in June 2025, Litecoin told the Solana account, “This way you can schedule your outages for the weekends. Good call.”
It replied to another Solana status update with one word, “Downtime.”
When the two networks signed a tongue-in-cheek ceasefire later that month, the foundation’s joke version had Litecoin promising to stop “mocking Solana for six hours and Solana will just continue to not do anything.”
Solana’s own people declined to return the favor this weekend. Vibhu Norby, Solana Foundation’s interim chief product officer posted, “I will not bring up the 1,000 times @litecoin dunked on Solana for downtime. Because we are better than this.”
Read more: CHART: It’s been 262 days since Solana’s last major outage
Litecoin and Solana downtimes
The Litecoin vulnerability lived in MWEB, Litecoin’s Mimblewimble-based confidential transaction extension. Aurora Labs CEO Alex Shevchenko, whose chain ingests LTC via NEAR Intents, documented the exploit in real time.
The attacker submitted a malformed MWEB peg-out. Non-upgraded Litecoin mining nodes accepted it as valid, releasing synthetic coins into the regular Litecoin blockchain.
The attacker then bridged the proceeds through THORChain and NEAR Intents to swap for ether.
Honest miners running the patched 0.21.5.4 client rejected the attacker’s blocks. From there, the two forks raced.
After several hours, the patched chain eventually won heavier proof-of-work and the network re-organized blocks 3,095,930 through 3,095,943 out of existence.
Although the reversed transaction time window was only 32 minutes, it took nearly three hours to actually reverse those minutes, because hashpower was split between honest and exploited nodes.
The patch was on GitHub for a month
Dragonfly Managing Partner Haseeb Qureshi noted that the Litecoin double-spending bug was “known, but the fix was not fully propagated.”
Indeed, the underlying consensus fix had sat in a private GitHub branch for about 30 days.
A security researcher questioned that asymmetric disclosure window, which gave insiders a month-long head start. Several major mining pools, apparently, never installed the public release in time.
For non-insiders, the public Litecoin Core 0.21.5.4 release shipped on Saturday, shortly after the attack had begun.
Got a tip? Send us an email securely via Protos Leaks. For more informed news, follow us on X, Bluesky, and Google News, or subscribe to our YouTube channel.


Banking Circle has rolled out institutional stablecoin settlement services after securing regulatory approval in Luxembourg.
Summary
- Banking Circle has launched regulated stablecoin settlement services after securing CASP approval in Luxembourg.
- The bank now supports USDC, USDG, and its own EURI for institutional fiat and crypto conversions.
According to a Monday announcement from the Luxembourg-based bank, the expansion follows its April 15 registration as a Crypto Asset Service Provider with the country’s financial regulator, enabling regulated conversion between fiat and stablecoins for institutional clients.
Support currently includes USDC issued by Circle, USDG from Paxos, and the bank’s own euro-pegged token EURI, extending capabilities first introduced with EURI in August 2024.
Serving more than 750 payment firms, financial institutions, and marketplaces, Banking Circle said its infrastructure processes over €1.5 trillion, or about $1.7 trillion, in annual transaction volume. Chief digital asset officer Kirit Bhatia stated in the release that stablecoins are “a natural extension” of the bank’s existing systems, adding that they play a key role in lowering costs and improving settlement efficiency.
Banking Circle expands foothold as euro stablecoin race intensifies
Banking Circle’s earlier launch of EURI positioned it among the first banks to issue a euro stablecoin aligned with the European Union’s Markets in Crypto-Assets Regulation, with the CASP approval now allowing it to scale regulated services across clients.
Competition across the region has accelerated as traditional banks and crypto firms build compliant payment rails under MiCA. French lender Société Générale, through its digital asset arm SG-FORGE, introduced the euro stablecoin EURCV in April 2023 on Ethereum and later expanded to additional networks as part of its multi-chain strategy.
On April 15, SG-FORGE integrated its dollar-denominated token USDCV into MetaMask, giving users access to a regulated stablecoin issued by a European bank.
Swiss-based Sygnum added EURCV to its B2B platform in January 2025, targeting institutional clients and partner banks. In September 2025, a group of lenders, including ING, UniCredit, and CaixaBank, announced plans for Qivalis, a MiCA-compliant euro stablecoin scheduled for release in the second half of 2026.
The consortium has since expanded to 12 banks, adding BBVA, BNP Paribas, and DZ Bank, and partnered with Fireblocks to support custody and tokenization ahead of launch.
Crypto-native firms continue to build competing infrastructure. In April 2025, Circle introduced the Circle Payments Network to offer managed settlement services for banks and payment providers.
Separately, an April 21 partnership between Coinbase and global payments platform Nium enables businesses to fund cross-border transfers using USDC and settle in either fiat or stablecoins across more than 190 countries.

Institutional money is flowing back into crypto faster than retail this cycle, and the data is starting to back the rally bitcoin has been quietly running.
Digital asset investment products attracted $1.2 billion in inflows last week, a fourth consecutive weekly gain, according to CoinShares data published Monday.
Total assets under management across crypto funds rose to $155 billion, the highest level since February 1, though still well below the $263 billion peak from October 2025. Bitcoin alone took in $933 million, bringing year-to-date flows to $4 billion. Ether attracted $192 million, the third straight week above $190 million.
Meanwhile, blockchain equity ETFs are one to watch for outside of crypto-related funds. These products invest in publicly traded companies that derive revenue from crypto infrastructure, like miners, exchanges, and chip makers selling into crypto applications.
Inflows totaled $617 million over the past three weeks, including a record weekly figure, marking what CoinShares analyst James Butterfill described as an explosion in demand for indirect technology exposure to the asset class.
The pattern suggests allocators who cannot or will not hold spot bitcoin directly are rotating into the equity wrappers around the sector.
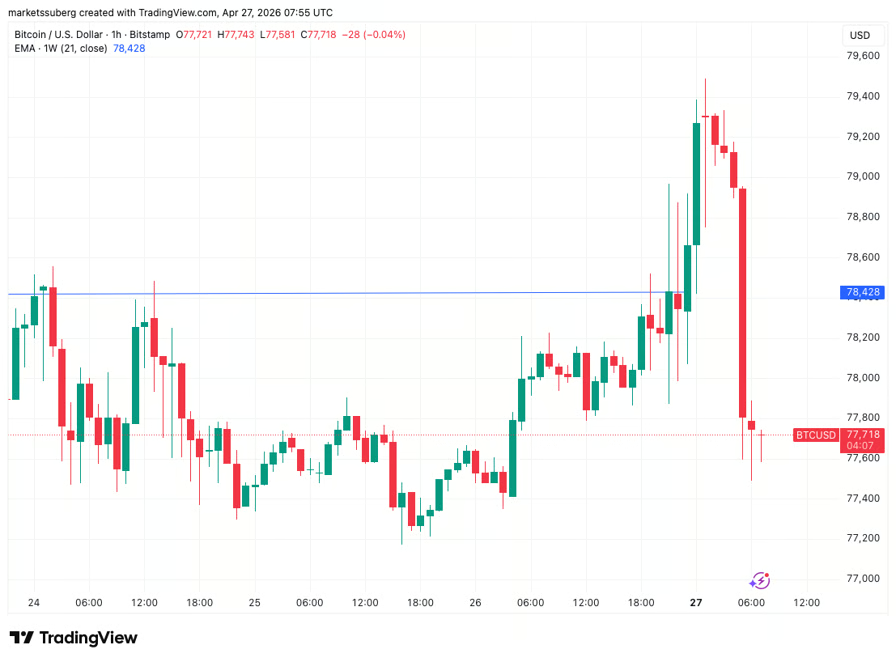
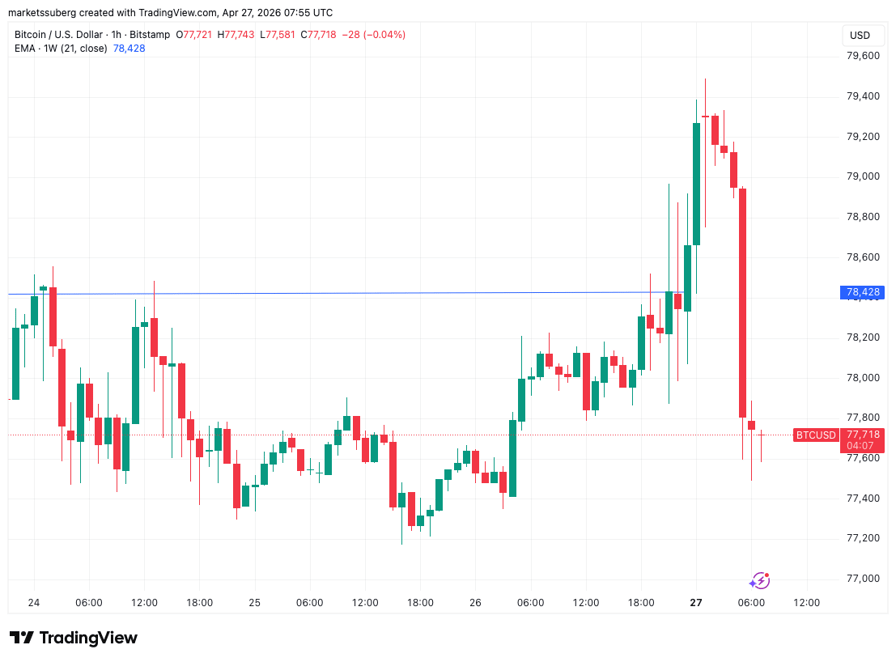
Bitcoin tagged $79,399 overnight, its highest level since January 31, before reversing to $77,705. The level matters because $80,000 is where buyers from January and February are approaching breakeven on positions held through the war-driven correction.
The week ahead is the test of whether institutional flows can absorb that selling pressure or whether a third rejection from $79,000 starts to define a range rather than precede a breakout.
Megacap tech earnings on Wednesday and Thursday from Alphabet, Microsoft, Amazon, and Meta, followed by Apple on Thursday, represent roughly a quarter of the S&P 500’s market capitalization and will determine whether the broader risk-on bid that has been lifting bitcoin alongside equities continues.
Strong earnings would extend the four-week run of crypto inflows and bitcoin may gets the catalyst it needs to clear $80,000. Disappointing results, however, could send prices dwindling lower.
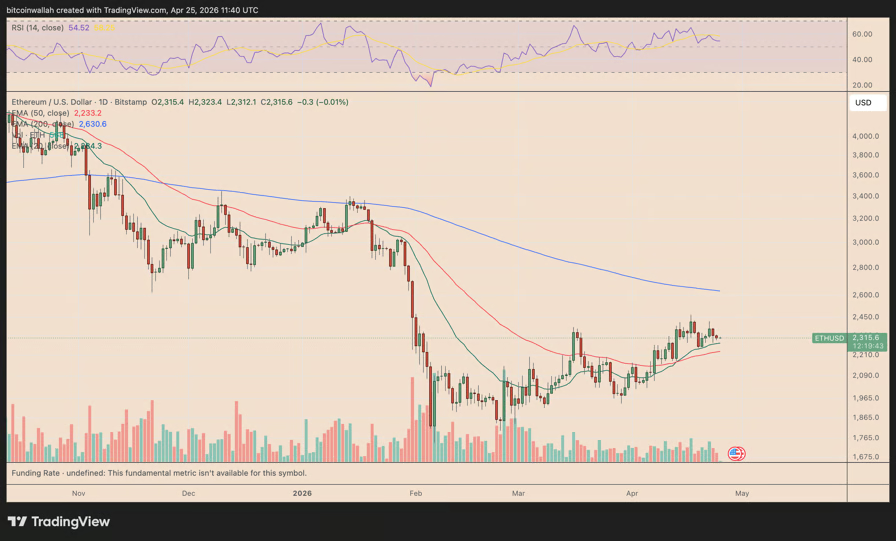
Ether (ETH) has surged more than 10% in April, reaching as high as $2,430 this month amid renewed market optimism.
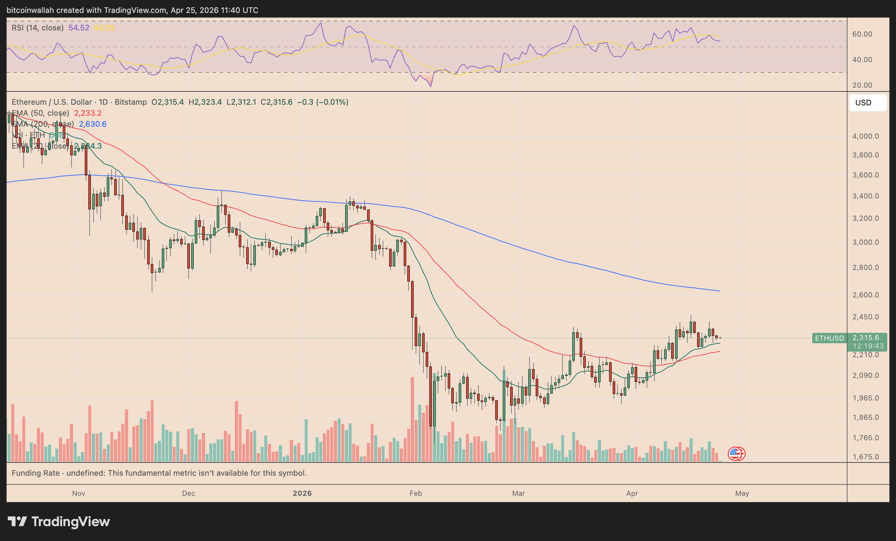
ETH/USD daily chart. Source: TradingView
Yet during the same period, the Ethereum Foundation, a nonprofit overseeing the Ethereum protocol’s development, has continued notable treasury sales.
Key takeaways:
- The Ethereum Foundation has sold approximately 20,000 ETH so far in 2026.
- Institutional demand for ETH remains strong, offsetting the foundation’s impact on the market.
Why is the Ethereum Foundation selling ETH?
In early April, the Foundation sold 5,000 ETH for roughly $11 million in DAI. This was followed by a larger 10,000 ETH OTC sale to Tom Lee’s Bitmine at an average price of $2,387, raising approximately $23.9 million.
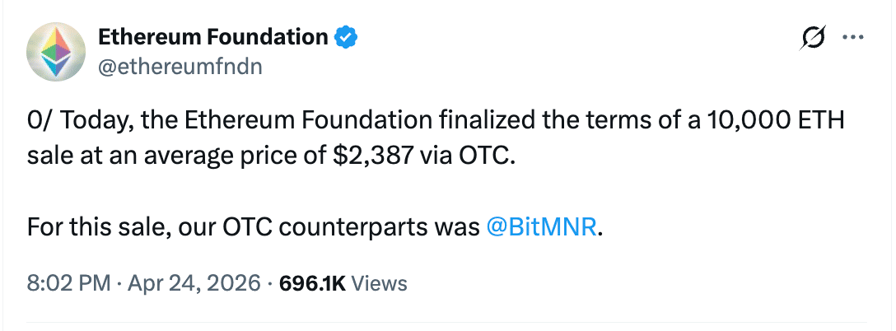
Source: X
The sales are not reactions to price action but follow a disciplined Treasury Policy adopted in June 2025.
The Foundation maintains fiat and stablecoin reserves equal to roughly 2.5 years of operating expenses. Periodic ETH sales replenish these reserves to fund protocol development, research, grants, and ecosystem support.
In 2026 alone, the Foundation has sold approximately 20,000 ETH, raising over $45 million. It still holds around 92,500 ETH (~$215 million) in its liquid treasury, plus 53,000 ETH staked, according to data resource Arkham Intelligence.
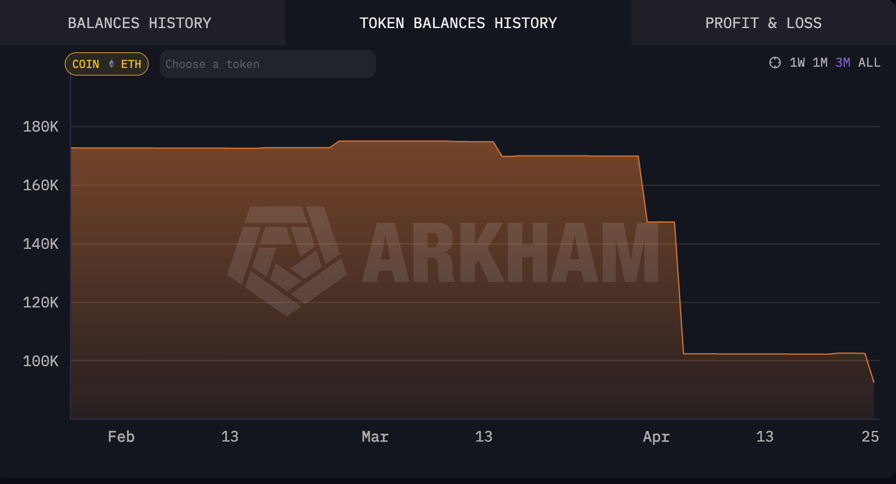
Ethereum Foundation’s ETH balance. Source: Arkham Intelligence
The Foundation’s 53,000 staked ETH may generate $4–$5 million in annual yield, assuming the current ETH price and the annual percentage yield of approximately 2.7%–3.8% gross remains about the same or higher in the future.
This new income stream should gradually reduce the Foundation’s reliance on ETH sales to fund its operations.
Are Ethereum Foundation’s sales bearish for ETH?
The Ethereum Foundation’s ETH sales remain small relative to daily ETH volume.
A typical 5,000–10,000 ETH sale represents just 0.08%–0.25% of Ethereum’s average daily trading volume of $10–12 billion.
This modest size means the market can comfortably absorb the Foundation’s selling pressure with negligible impact.
On-chain data already highlights robust underlying demand for ETH from large holders.
For instance, the number of daily accumulation addresses, wallets steadily buying and holding Ether, rose to 2,434 this week, surpassing the number of exchange depositing addresses (wallets preparing to sell), which fell to 2,300, as shown below.
Binance ERC-20 stablecoin whale activity index. Source: CryptoQuant
Also, spot Ethereum ETFs have recorded strong inflows for three consecutive weeks, attracting more than $2 billion in new capital since early April, according to data from SoSoValue.
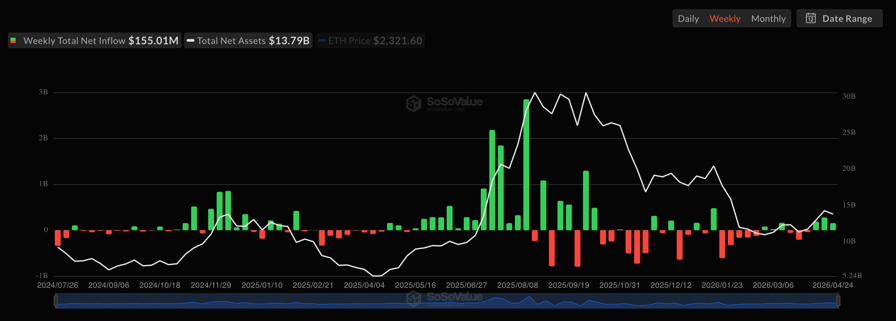
US spot Ethereum ETF weekly flows. Source: SoSoValue
This sustained institutional buying signals growing demand for Ethereum investment products on Wall Street.
Ether’s rising wedge hints at 15% dip ahead
From a technical perspective, Ether is currently forming a rising wedge pattern, a structure defined by two ascending trend lines that are converging, accompanied by noticeably declining volume.
In technical analysis, a rising wedge resolves when the price breaks below the lower trend line and falls by as much as the structure’s maximum height.
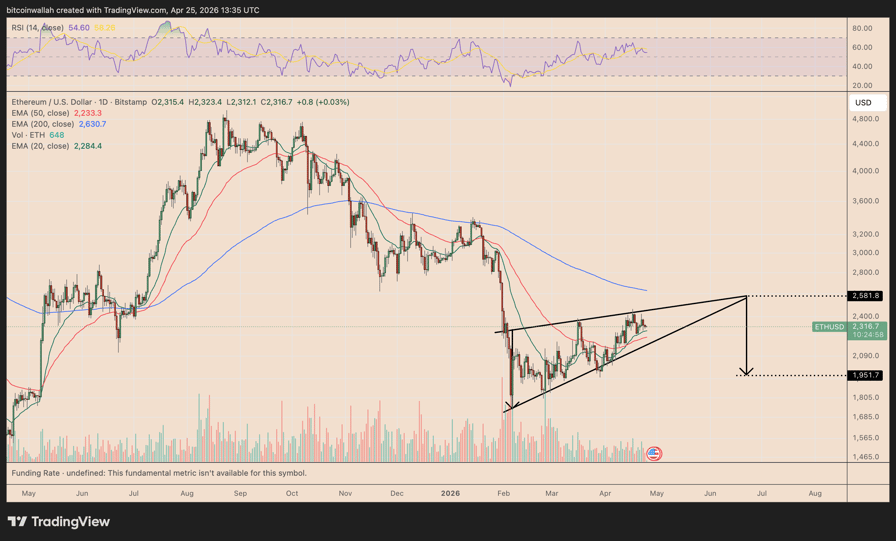
ETH/USD daily chart. Source: TradingView
Applying this rule to ETH’s chart brings its downside target to around $1,950, down by over 15%, by June, assuming the breakdown point is the wedge’s apex at approximately $2,580, where the two trend lines converge.
Related: Ethereum whale opens $90M long bets as ETH price chart eyes $3.2K
Conversely, a break above the wedge’s upper trendline may invalidate the bearish outlook. Instead, bulls may target the 200-day exponential moving average (200-day EMA, the blue line) at around $2,630 as their next upside target.


Pudgy Penguins’ recent rally may be a breakout driven by ecosystem momentum. This move appears to have benefited long-term holders in unexpected ways, according to on-chain data.
According to DNTV Research founder Bradley Park, the surge may have provided liquidity, that is, enough buyers in the market, for large holders to sell following a mid-April token unlock.
“The news around the Pengu Card, PenguBot, and other ecosystem updates are secondary narratives at best,” Park told CoinDesk. “The real story is the large token unlock that happened roughly 10 days ago.”
The Pudgy Penguins team did not respond to a request for comment by press time.
Token unlocks are scheduled releases of coin supply, similar in spirit to post-IPO lockup expirations that periodically flood equity markets with newly available shares.
Park points to the token unlock on April 17, when roughly 703 million PENGU — about 0.79% of the total supply of roughly 88 billion — hit the market in a single tranche.
The on-chain activity in the hours that followed, paired with a sharp jump in futures positioning, tracks the pattern seen at prior unlocks, where large holders use a window of rising liquidity to sell into strength.
The primary unlock wallet received 182.8 million PENGU and, within roughly 50 minutes, dispersed them across 19 separate addresses.
Park calls the sequence a “vesting-claim-and-disperse” pattern, the kind of choreography more commonly associated with preparing to sell than with settling in for the long hold.
The mechanics aren’t complicated: tokens come out of the vesting contract and get split across multiple wallets, which lets the eventual sale move in pieces small enough that no single transaction tips the market against the seller.
The futures market moved alongside it. Open interest in PENGU rose from about $36 million to $59 million during the rally, with repeated short squeezes amplifying upward momentum.
Short squeezes — the same mechanic retail traders watched drive GameStop in 2021 — force traders betting against the price to buy back in and cover their positions, layering fresh demand on top of whatever was already pushing the market higher.
For a holder trying to exit, that is close to an ideal environment: someone else’s forced buying absorbing their selling, with the price still moving the right way.
Open interest measures the total value of futures contracts still open in the market, and when it rises alongside price, it usually means traders are piling into new long positions rather than closing out old ones. That deepening of liquidity is exactly what a large holder needs to sell size without moving the price against themselves.
“My hypothesis: the price rally was engineered to provide exit liquidity for unlock recipients,” Park told CoinDesk in a note. “The bullish narratives — game launches, Visa card, Telegram bot — gave market participants a reason to bid, while the unlock beneficiaries used the resulting liquidity to sell into strength.”
“The news didn’t cause the rally,” he added. “It provided cover for post-unlock distribution.”
Park’s analysis aligns with broader signs of concentration in the NFT market.
As CoinDesk reported earlier, buyer participation has been declining even as prices rise, with activity increasingly concentrated in a handful of collections, such as Pudgy Penguins. In that environment, relatively small flows can have an outsized impact on price.
Next month will show if this is an isolated event or part of a pattern.
Pudgy Penguins’ vesting schedule shows monthly unlocks of roughly 703 million PENGU continuing through at least July, with the next tranche scheduled for May 17.
Each event introduces new supply, creating recurring windows where price action and underlying flows may diverge.
What the market has to sort out now is whether the rally reflects durable demand or just well-timed liquidity around new supply.
The ecosystem news is real enough. Whether it points to growth or to a cover for an exit is the question the next few months of unlocks – without the same bullish narratives – will answer.
Bitcoin (BTC) counts down the final days of April with a fresh attack on $80,000 as price teases key breakouts.
- Bitcoin sees its first weekly close above a key trend line since October 2025.
- Liquidity grabs ramp up as traders eye a potential support retest closer to $70,000.
- The Federal Reserve interest-rate decision and inflation data form macro volatility catalysts.
- Analysis sees the “end of capitulation” on Bitcoin as institutions shore up the market.
- US manufacturing data could allow BTC/USD to avoid a retest of its macro lows.
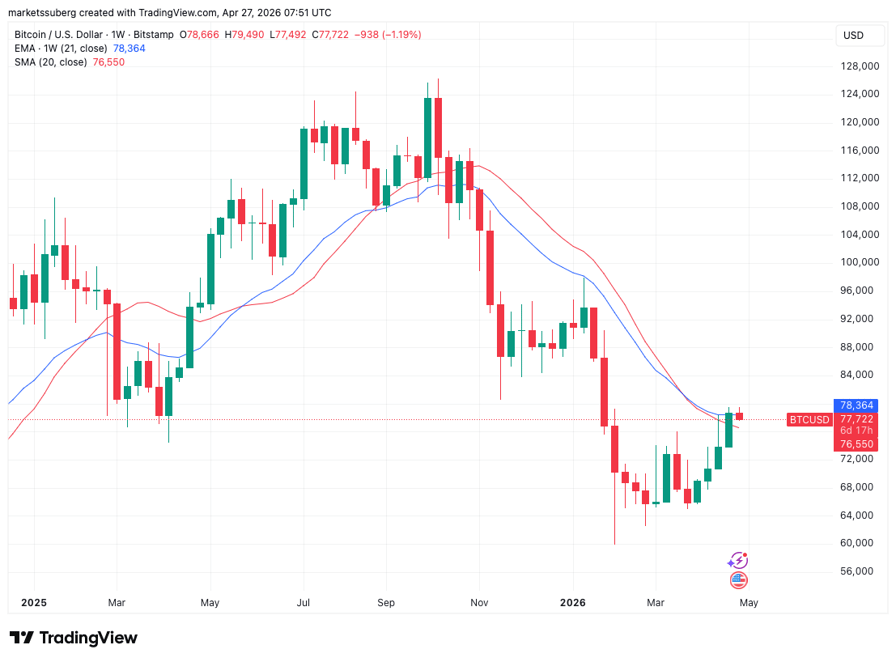
Bitcoin closes above 21-week trend line for the first time in six months
Bitcoin may have failed to tap $80,000 or even hold its latest gains, but the weekly close was still significant.
After a last-minute push higher, BTC/USD managed to close out the weekly candle just above a key trend line, data from TradingView confirms.
BTC/USD one-hour chart with 21-week EMA. Source: Cointelegraph/TradingView
This was its 21-week exponential moving average (EMA) — a resistance feature on the chart in place since October 2025. The last weekly close above it was when the pair traded at nearly $115,000.
As Cointelegraph reported, the 21-week EMA was already on the radar for trader and analyst Rekt Capital.
A weekly close above it, he argued last week, was a prerequisite for avoiding a support retest of $73,000.
“Unless BTC is able to reclaim the 21-week EMA as support… Then this EMA could indeed force BTC into a post-breakout retest of the top of the Double Bottom price broke out from last week,” he told X followers.
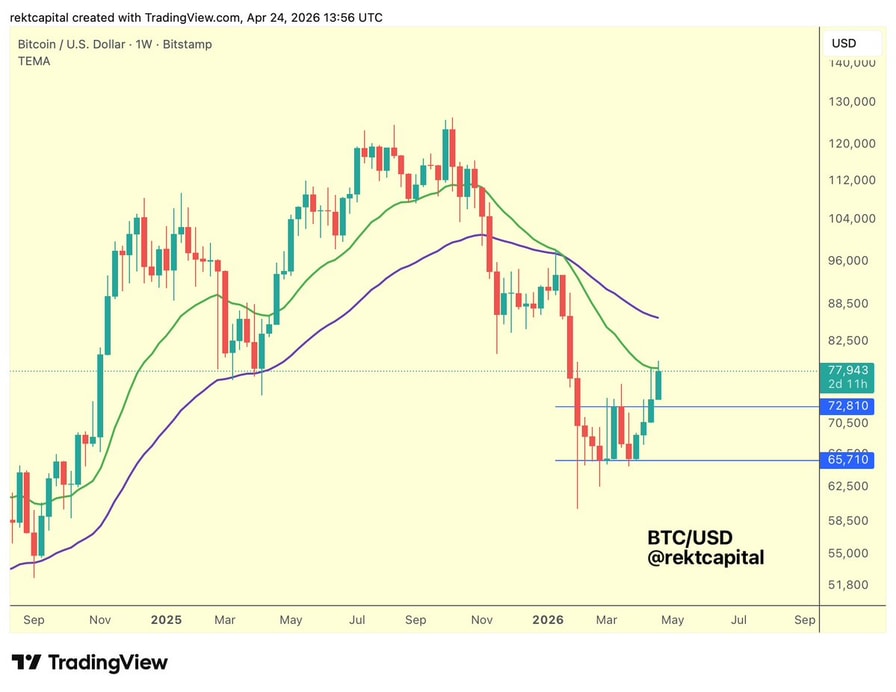
BTC/USD one-week chart. Source: Rekt Capital/X
The 21-week EMA currently forms the upper boundary of Bitcoin’s bull market support band, together with the 20-week simple moving average (SMA) at $76,550.
Similarly, it was in October last year that price completed a weekly close fully above the band’s two trend lines.
Last week, trader Daan Crypto Trades said that such an event “could confirm the end of this down trend and further relief bounce.”
BTC/USD one-week chart with bull market support band. Source: Cointelegraph/TradingView
Liquidity grabs drive low-time frame BTC price action
On short time frames, the BTC price landscape is offering traders mixed signals.
As overall strength persists despite geopolitical uncertainty, bulls continue to struggle with reclaiming key support lines.
“Some great momentum on $BTC lately, however there are some crucial levels to consider,” crypto trader Michaël van de Poppe commented in his latest analysis on X.
Van de Poppe said that price breaking through $79,000 opens up the path to levels up to $100,000, which will nonetheless “take time.”
“If there’s no clear breakout at $79K, it wouldn’t be surprising to expect some period of consolidation before there’s another test of the resistance,” he reasoned.
“In that case, there’s a level that I prefer to see hold: $73.5k+.”
BTC/USDT six-hour chart. Source: Michaël van de Poppe/X
Earlier, Cointelegraph reported on expectations of a fresh BTC price comedown and even new macro lows.
Van de Poppe added that such an outcome could occur should the $73,000 area fail.
Continuing, trader CrypNuevo suggested that liquidity grabs could bring about that trip to the lower end of the $70,000-$80,000 corridor.
After the weekly close, BTC/USD took out late shorts above $79,000 before rapidly heading downward, liquidating newly placed longs, data from CoinGlass shows.
-2026-04-27_10_54_38.png?prefix=media%2Fcontent)
BTC 24-hour liquidation heatmap. Source: CoinGlass
“Price could take the upside liquidations first in a range highs deviation, before going for the lower ones at $70k mid-range,” CrypNuevo predicted.
He added that both $70,000 and $80,000 had an “interesting amount” of potential liquidations to offer.
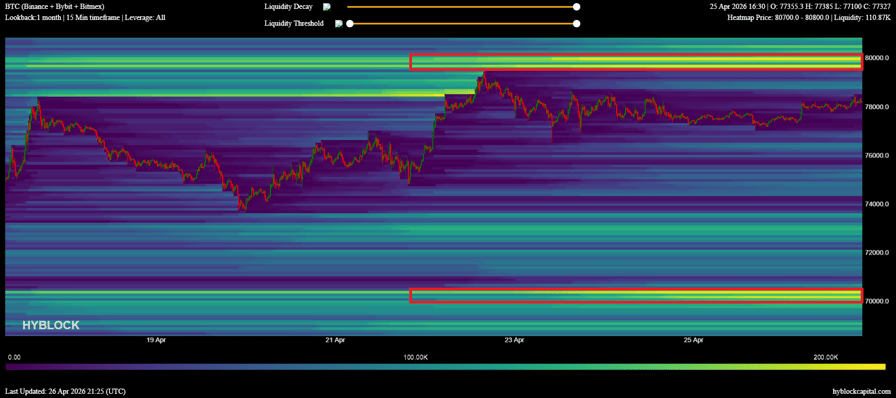
BTC liquidation heatmap. Source: CrypNuevo/X
Powell’s final Fed FOMC meeting brings stocks warning
With markets still unsure of the roadmap for the US-Iran war, risk appetite is nonetheless “returning,” analysis says.
This week has begun with the hope of further negotiations to end the conflict, this time thanks to an Iranian proposal.
Bitcoin appeared to find reason for relief on the news, hitting new multimonth highs before quickly retracing.
“Risk appetite continues to grow rapidly in this market,” trading resource The Kobeissi Letter wrote in an X response as BTC/USD neared $79,500.
Macro volatility is set to continue in the coming days, thanks also to US macroeconomic events.
Wednesday will see the Federal Reserve’s next decision on interest-rate changes, and markets will be watching Chair Jerome Powell’s press conference for cues when it comes to future policy.
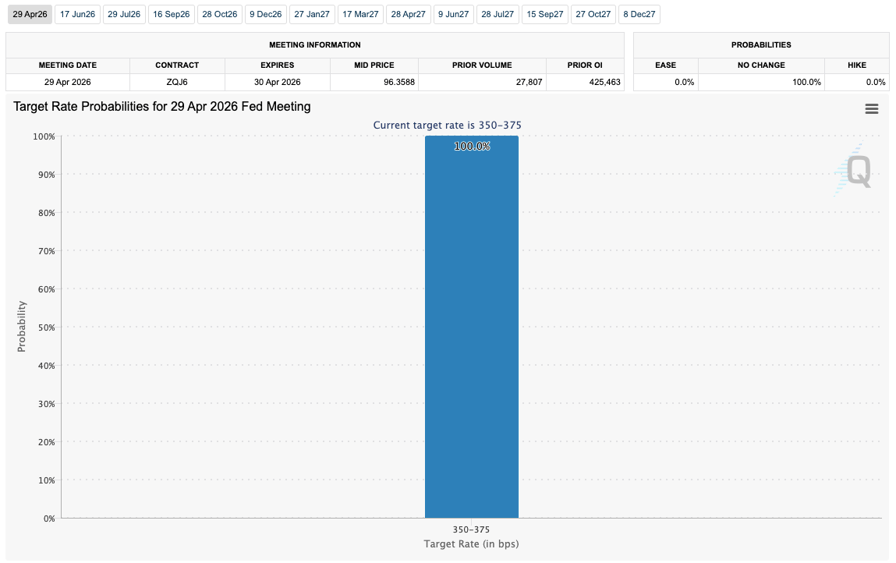
Fed target rate expectations for Wednesday’s FOMC meeting (screenshot). Source: CME Group FedWatch Tool
The war has added new inflation risks for the US, and Thursday’s release of the Fed’s “preferred” inflation gauge should reflect its impact on the trend.
This week also marks the last Federal Open Market Committee (FOMC) meeting with Powell as Chair, ahead of the assumed takeover by Kevin Warsh.
“New Fed chairs have a history of being greeted with market volatility,” trading resource Mosaic Asset Company noted in the latest edition of its regular analysis series, The Market Mosaic.
An accompanying chart put the average S&P 500 drawdown in the year a new Fed chair takes over at 20%.
![]()
S&P 500 drawdowns under new Fed chairs. Source: Mosaic Asset Company
BTC price analysis sees “structural bottom” in place
Bitcoin near $80,000 has led analysts to suggest that the “end of capitulation” is already here.
In one of its QuickTake blog posts on Monday, onchain analytics platform CryptoQuant pointed to institutional investors as the key supporting factor during the 2026 bear market.
“During the Hormuz Shock, large investors refused to sell their Bitcoins and the panic in derivatives was irrelevant, as institutional conviction was already cemented,” contributor GugaOnChain summarized.
In early February, CryptoQuant argued, when BTC/USD briefly fell to near $60,000, a “purge” of low-conviction investors had already been underway for several months.
“Operators took profits, purging weak hands and retreating the support to $54.5K,” GugaOnChain continued, referring to Bitcoin investors’ average cost basis, also known as realized price.
“In practice: the retail that paid the speculative premium at $90K entered absolute panic with the free fall. Forced to sell at a loss, they returned their Bitcoins to the Smart Money in the $62K zone, establishing an early support above the fair price.”
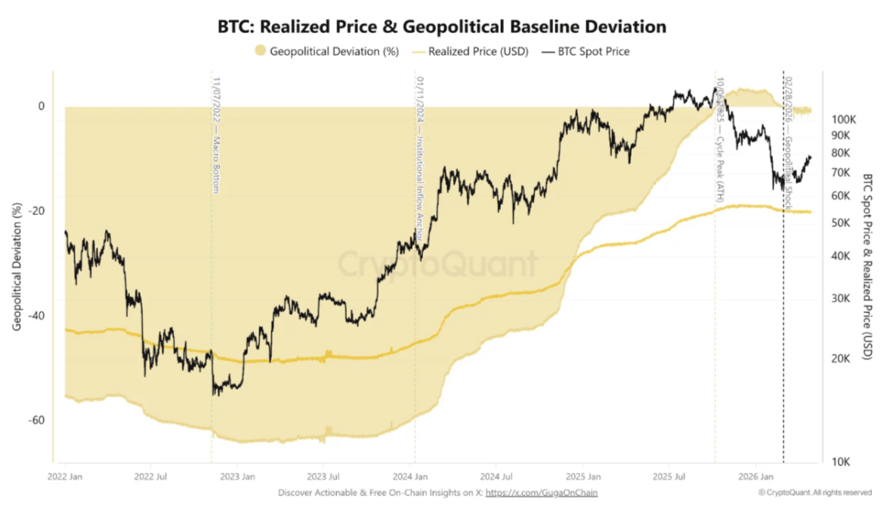
Bitcoin realized price data (screenshot). Source: CryptoQuant
CryptoQuant described the “apex” of the process occurring in February, with a recovery underway ever since.
“The apex of this purge occurred on February 5, 2026, consolidating the ground zero of this Bear Market. With the Spot squeezed at $62.8K and the Realized Price (RP) at $55.3K, the deviation was only 1.34%,” GugaOnChain explained, calling a “structural bottom.”
“Unlike the absolute capitulation of 2022, when the price crossed below the network’s base, this time the panic stalled at a 13% distance from the Wall. Institutional capital erected a concrete floor before the abyss, exhausting the selling power of investors without conviction.”
Bitcoin realized-price data ordered by date coins moved onchain. Source: CryptoQuant
US macro data may save Bitcoin from new bear-market low
Throughout the current macro volatility, US Purchasing Managers’ Index (PMI) has formed a key upside catalyst for crypto and risk assets.
Related: Bitcoin Bull Score hits six-month high as 2022 bear-market fears linger
This is set to continue, with PMI entering an “expansion” phase for the first time since 2022.
For commentator Matthew Hyland, this now has implications for Bitcoin price action for the rest of 2026. In this bear-market year, BTC/USD should find a bottom in Q4, matching 2022 — but PMI should change the landscape.
“Because of the strength of the PMI expansion trigger along with the other 10+ signals I do not believe the ‘4 year cycle’ works out as most expect,” he wrote on X.
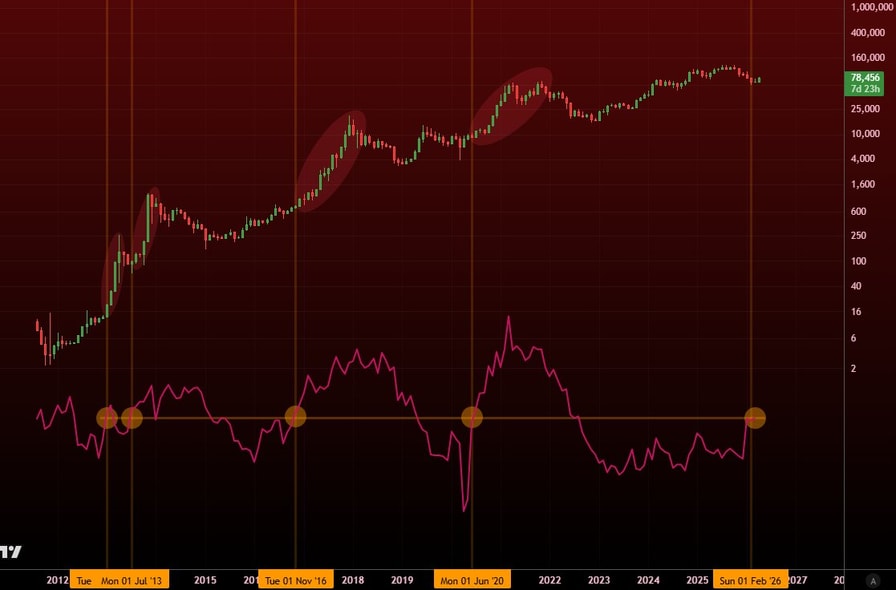
BTC/USD versus US PMI data. Source: Matthew Hyland/X
Instead of beating its February lows, Bitcoin should instead put in “higher low” near $60,000, contrary to the majority’s expectations. Supporting this, Hyland made reference to “10+ signals” showing that the new bottom is already in place.
“My invalidation would be a severe black swan something worse than the past few months however black swans are NOT likely so Its low percentage odds of being invalidated and not favorable to happen,” he added.


Bitcoin’s recovery is being driven by perpetual futures traders, not organic spot buyers, according to CryptoQuant CEO Ki Young Ju. On-chain apparent demand remains net negative despite heavy ETF inflows and corporate accumulation.
Bitcoin (BTC) trades near $77,500 after failing to push through $80,000. The divergence between futures positioning and spot flows is becoming the defining feature of the April market.
Investors are Betting on Bitcoin Price, Not Buying
Ki Young Ju shared a CryptoQuant chart showing the growth in 30-day Bitcoin spot and perpetual futures demand. The purple futures bars have climbed back into positive territory through April 2026.
The gray spot bars, however, remain below the zero line for most of the month. Spot demand growth is still contracting on a 30-day basis, even as price action has recovered.
That gap matters because perpetual futures positions can be opened with leverage and unwound just as quickly. Spot buying, by contrast, requires fresh capital to absorb supply at the offer.
ETF Flows and MicroStrategy Buys Have Not Flipped the Signal
US spot Bitcoin ETFs attracted $786 million in their strongest weekly inflow since February in mid-April. Inflows continued at $823 million the next week, with BlackRock’s IBIT leading demand.
MicroStrategy, the corporate vehicle led by Michael Saylor, also bought 34,164 BTC for $2.54 billion in its third-largest single purchase. The buy was made at an average price of $74,395, lifting total holdings to 815,061 BTC.
Despite both flows, on-chain apparent demand has remained net negative through April. CryptoQuant data showed 30-day apparent demand near -87,600 BTC earlier in the month.
The gap suggests ETF and Strategy purchases are being matched and exceeded by selling from existing holders and miners.
When Will the Bear Market End?
Ki Young Ju has tracked Bitcoin demand cycles for years. He previously declared the cycle theory dead, citing structural rotation between old whales and new long-term holders.
His latest framing suggests that sustainable bottoms form only when spot and futures demand recover at the same time. A futures-led rebound without a spot recovery has historically resolved through another leg lower as leverage unwinds.
The current setup matches that pattern. Funding rates have ticked up, open interest is rising, but the underlying spot bid remains weak.
Traders are now watching whether spot demand, as measured by CryptoQuant, can flip positive in the coming weeks. A turn would suggest fresh capital is finally absorbing the supply pressure flagged in earlier warnings.
If futures positioning continues to lead while spot demand stays red, the rally faces a familiar risk. Previous mid-cycle bounces in 2025 unwound the same way, through forced liquidation rather than fresh dollar inflows.
The post CryptoQuant CEO Warns Bitcoin Demand Imbalance appeared first on BeInCrypto.
GE Vernova (GEV) Stock: Why Did an Analyst Downgrade After a 790% Earnings Surge?

Keir Starmer Faces Mandelson Sleaze Probe Vote
Anthony Joshua’s comeback opponent announced as Tyson Fury fight agreed for end of year
Manchester United reach agreement with Casemiro over contract clause amid transfer speculation

US brings back mandatory military draft registration

Steven Gerrard disagrees with Gary Neville over ‘shock’ Chelsea and Arsenal claim | Football


-

 Politics7 days ago
Gary Stevenson delivers timely reminder to register to vote as deadline TODAY
-

 Fashion3 days ago
Weekend Open Thread – Corporette.com
-
 Crypto World2 days ago
Hyperliquid $HYPE Rally Builds Momentum as AI Sector Enters Prove-It Phase
-
Crypto World7 days ago
Bank of Hawai’i (BOH) Q1 2026: Net Income Drops to $57.4M as Net Interest Margin Expands
-

 Politics5 days ago
Making troops accountable for war crimes threatens US alliance, ex-SAS colonel warns
-

 Politics5 days ago
Disabled people challenge government SEND proposals over segregation concerns
-

 Business5 days ago
Rolls-Royce Voted UK’s Most Iconic Trade Mark as IPO Register Hits 150
-

 Business4 days ago
Patterson-UTI Energy, Inc. (PTEN) Q1 2026 Earnings Call Transcript
-

 Politics5 days ago
Zack Polanski responds to home secretary’s taser threat
-
 Crypto World6 days ago
Five Value Stocks with Recovery Potential in 2026: PayPal (PYPL), Nike (NKE), and More
-

 Politics5 days ago
Starmer handler McSweeney to be dragged from shadows by Foreign Affairs Committee
-
 Sports1 day ago
IPL 2026: Ruturaj Gaikwad registers slowest fifty of the season, enters all-time unwanted list | Cricket News
-
Politics5 days ago
Wings Over Scotland | How To Get Away With Crimes
-

 Crypto World6 days ago
New York sues Coinbase, Gemini over prediction market offerings
-
 Business5 days ago
HCL Tech share price tank over 9% after weak Q4. JPMorgan, HSBC & 3 others cut target price
-

 Politics5 days ago
‘Iran is still a nuclear threat’
-
Entertainment6 days ago
Sydney Sweeney cameo cut from “The Devil Wears Prada 2”, source explains why (exclusive)
-
 Crypto World6 days ago
Crypto’s great hope in Senate’s Clarity Act still has a path to survive tight calendar
-
 Sports4 days ago
Tim Bradley names the current best in the world: “Better than Inoue and Usyk”
-

 NewsBeat1 day ago
LK Bennett closes all stores after entering administration
You must be logged in to post a comment Login