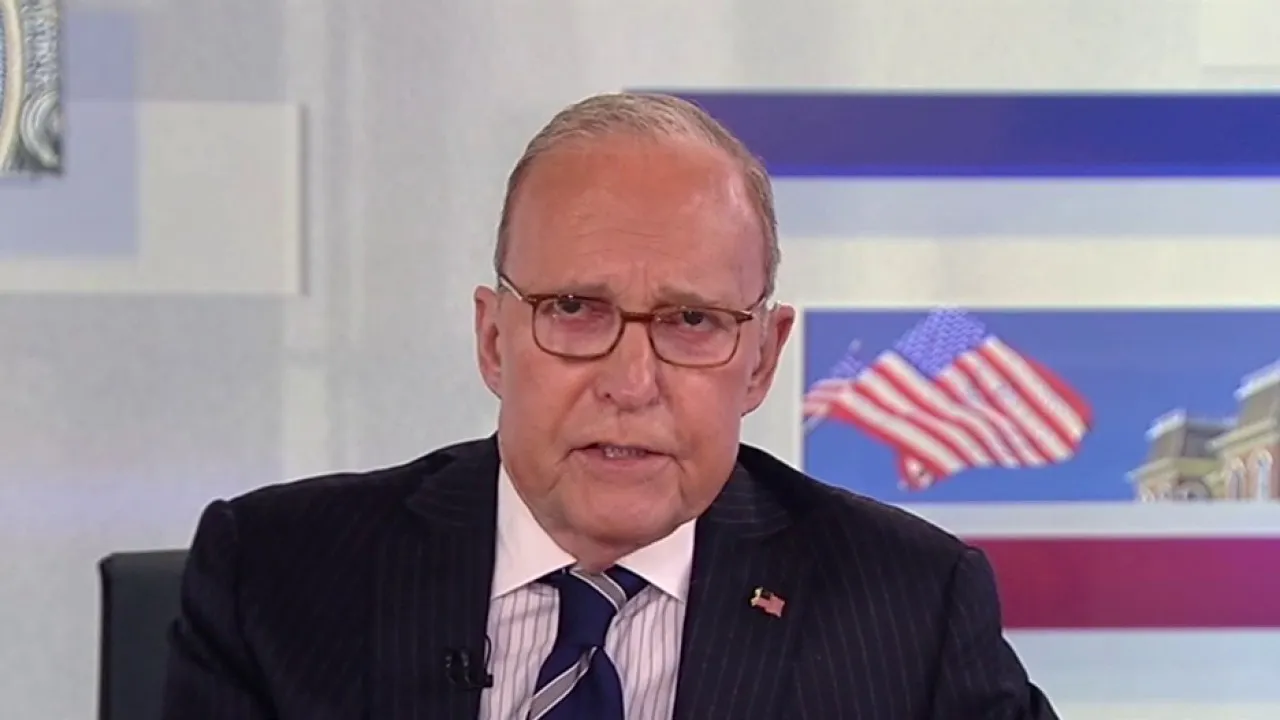
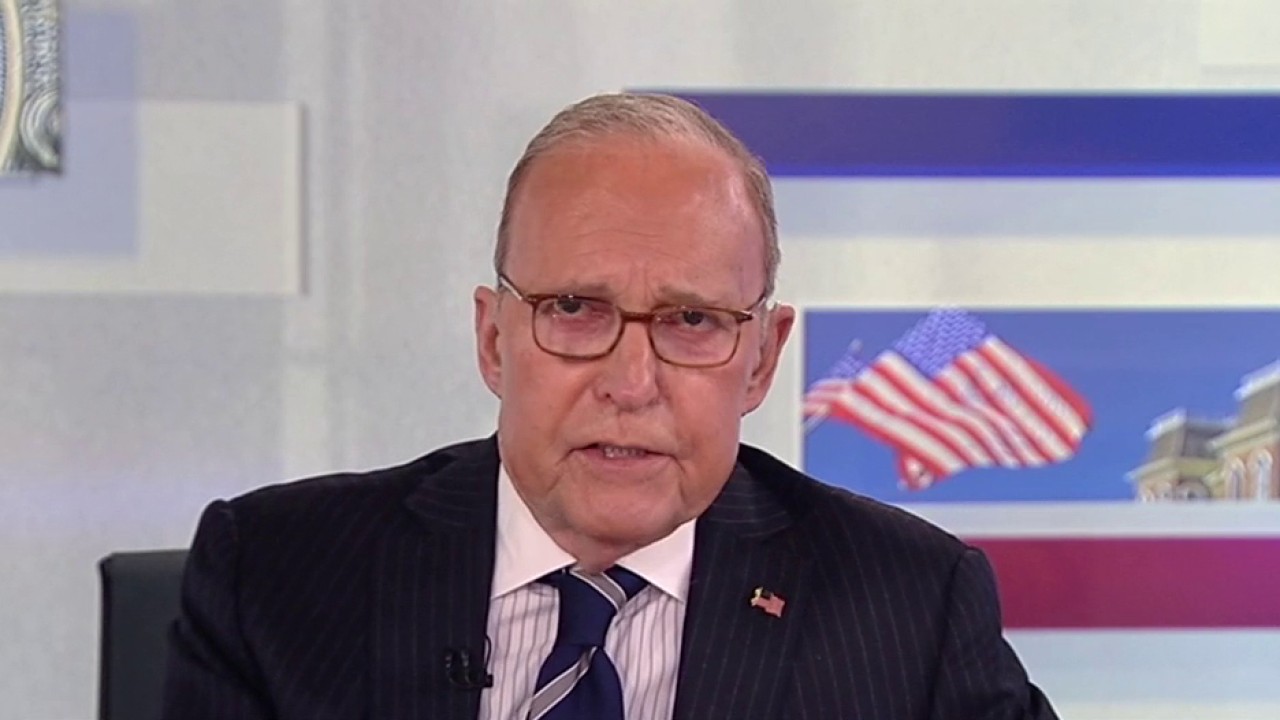
FOX Business host Larry Kudlow discusses U.S.-Iran peace negotiations and President Donald Trump’s ‘no bad deal’ stance on Iran’s nuclear capabilities on ‘Kudlow.’
As is always the case, I have great faith in President Trump’s dealmaking, and now he’s trying to put the finishing touches on a war with Iran, which seems to me is basically 90 percent or 95 percent over. Mr. Trump is the only president in the last nearly 50 years with the courage and vision to destroy the radical Islamic regime in Iran, and by and large he has succeeded.
He will not make a bad deal. And he continues to keep his red lines of ending their nuclear capabilities, handing over their enriched uranium, pulling back on their missile programs, and of course reopening the Strait of Hormuz for the freedom of navigation. He holds those red lines in place. The question is, can these red line goals be achieved without a resumption of military action? Surely we don’t want to provide any economic assistance to Iran.
Advertisement
On Truth Social Sunday the president said “The Blockade will remain in full force and effect until an agreement is reached, certified, and signed.” Good. He also stated clearly that Iran cannot develop or procure a nuclear weapon or bomb. Good.
In other words, no dust, no dollars. This is spot on. The moment we make an Obama-style cash infusion to Iran, they’ll go right out and use it to rebuild their weapons, their nuclear operations, and their state sponsorship of terrorism. They certainly will. Iran is the most gruesome, inhumane, nazi-like regime in the last 100 years.
Fox News senior strategic analyst Gen. Jack Keane (ret.) joins ‘Mornings with Maria’ to assess US strikes on Iran, tensions in the Strait of Hormuz and President Donald Trump’s next move.
It’s a modern-day Gestapo that has already reportedly slaughtered well more than 40,000 people this year alone. It must be stopped. And Mr. Trump’s military operations Midnight Hammer and Epic Fury, plus his Economic Fury, guided by Treasury Man Scott Bessent, have virtually taken Iran out and completed the mission.
Advertisement
But in the middle of negotiations, you have Iran trying to lay mines in the Strait of Hormuz and firing missiles at American naval ships. So of course we fired back successfully. Yet it just goes to show, this is a crowd that can never be trusted. They lie, cheat and steal as a way of life. They never keep the promises of verification. All largely because they really are not a civilized regime.
Instead, they prefer to negotiate as to how they’re going to negotiate in the future. Providing lists and conditions that have nothing to do with reality, but extend the talks forever.
Now Mr. Trump knows all this. Yet notwithstanding, he is engaged in intense diplomacy with the Islamic Revolutionary Guard Corps, or some faction, or somebody there. We’ve gone from a two-week ceasefire, then another week, then indefinite ceasefire. We could be in for another 60-day negotiating phase. Yet with all this, this question must be faced: to make good on his red lines, to properly set the stage for a new era of peace and freedom in the Middle East and around the world, even to extend the Abraham Accords including with Israel, can these noble historic missions really be completed without additional bombing?
Seeking Alpha’s transcripts team is responsible for the development of all of our transcript-related projects. We currently publish thousands of quarterly earnings calls per quarter on our site and are continuing to grow and expand our coverage. The purpose of this profile is to allow us to share with our readers new transcript-related developments. Thanks, SA Transcripts Team
LONDON — Global oil benchmarks showed sharp and divergent movements Tuesday as fresh US military strikes in southern Iran reignited fears over supply disruptions through the Strait of Hormuz, even as diplomatic efforts for a potential peace deal continued in the background.
Brent crude, the international benchmark, rose 2.95% to $98.98 per barrel, reflecting renewed risk premiums tied to potential threats to shipping lanes. In contrast, West Texas Intermediate crude fell 4.29% to $92.46 per barrel, highlighting market uncertainty and differing interpretations of the latest geopolitical developments.
The volatility underscores how sensitive energy markets remain to events in the Middle East. The Strait of Hormuz, a narrow chokepoint through which roughly 20% of the world’s petroleum supply passes, has become a focal point for investors monitoring both military actions and diplomatic signals.
Analysts said the mixed price action reflects conflicting forces: immediate concerns over possible Iranian retaliation or shipping disruptions following US strikes, tempered by hopes that ongoing negotiations could lead to de-escalation and reopening of key routes.
Advertisement
The US military confirmed it conducted self-defense strikes in southern Iran, injecting fresh uncertainty into already fragile energy markets. This development reversed some of the earlier optimism that had driven prices below $100 per barrel on expectations of a diplomatic breakthrough.
Market participants are closely watching developments around US-Iran peace negotiations. Optimism about a potential agreement had previously eased prices, but military friction has kept supply expectations uncertain and risk premiums elevated.
Other benchmarks reflected similar volatility. The OPEC Basket fell 1.72% to $113.44 per barrel, while Urals oil dropped 4.92% to $96.32. RBOB gasoline declined 3.39% to $3.34 per gallon, and heating oil slipped 2.66% to $3.78 per gallon.
Energy strategists noted that the divergent movements between Brent and WTI highlight regional differences in supply concerns and refining dynamics. Brent’s rise points to global supply risks, while WTI’s decline may reflect ample US domestic production and storage levels.
Advertisement
The latest flare-up comes amid broader efforts to stabilize the region. Diplomatic sources have indicated that talks between Washington and Tehran are ongoing, though progress remains fragile. Any agreement that secures safe passage through the Strait of Hormuz could significantly ease pressure on global energy prices.
Oil traders said the market is pricing in a range of scenarios, from limited military exchanges to more prolonged disruptions. The possibility of Iranian-backed groups targeting shipping has added another layer of complexity to already volatile trading conditions.
Major consumers like Europe, Asia and the United States are monitoring the situation closely. Higher energy costs could exacerbate inflation concerns and slow economic growth if the tensions persist.
The energy sector’s reaction has rippled through global financial markets. Shares in major oil companies showed mixed performance, with some gaining on higher prices while others faced pressure from broader risk aversion.
Advertisement
Analysts warn that sustained disruption in the Strait of Hormuz could push Brent crude well above $110 per barrel. Conversely, a successful diplomatic resolution could see prices retreat quickly toward the $80-85 range.
The current volatility echoes previous periods of Middle East tension that have historically triggered sharp moves in commodity markets. However, today’s energy landscape differs due to higher global spare capacity and the rapid growth of renewable energy sources, which provide some buffer against prolonged shocks.
US strategic petroleum reserves and increased domestic production have also helped moderate some of the price spikes. Nevertheless, the psychological impact of potential supply disruptions continues to influence trading decisions.
For consumers, the latest price swings may soon translate into higher costs at the pump and for heating. Airlines and shipping companies are already adjusting fuel surcharges in response to the uncertainty.
Advertisement
Emerging markets with high energy import dependence face particular risks. Countries in Asia and Africa could see increased pressure on budgets and inflation if oil prices remain elevated for an extended period.
The International Energy Agency and OPEC continue monitoring the situation. Both organizations have emphasized the importance of maintaining stable oil flows through critical chokepoints like the Strait of Hormuz.
Market participants expect continued volatility in the coming days as developments unfold. Diplomatic updates, military statements and shipping data will be closely watched for signals about potential supply impacts.
The current environment highlights the delicate balance between geopolitical risks and economic realities. While short-term price spikes grab headlines, longer-term trends toward energy diversification and renewable adoption may eventually reduce the world’s vulnerability to such events.
Advertisement
For now, traders remain on edge as they assess the latest chapter in long-running tensions between the United States and Iran. The coming weeks could prove decisive in determining whether current price levels represent a temporary spike or the beginning of a more sustained period of elevated energy costs.
As markets digest the latest developments, the focus remains on the narrow waterway that carries so much of the world’s oil. Any escalation or resolution there will likely set the tone for energy prices through the remainder of 2026.
The mixed movements in benchmarks today serve as a reminder of oil’s enduring role as a geopolitical barometer. Even as the world transitions toward cleaner energy, events in key producing regions continue to send ripples through global economies.
Wendel (WNDLF) Shareholder/Analyst Call May 21, 2026 9:00 AM EDT
Company Participants
Nicolas ver Hulst Sébastien Metzger – General Counsel Laurent Mignon – Group CEO & Chairman of the Executive Board David Darmon – Deputy CEO & Member of Executive Board Christine Anglade-Pirzadeh – Director of Communications & Sustainable Development and Advisor to the Executive Board William Torchiana Alain Missoffe
Advertisement
Conference Call Participants
Malcom Sossou
Conversation
Advertisement
Nicolas ver Hulst
Good afternoon, ladies and gentlemen. It’s a great pleasure to be with you this afternoon. You’ve turned up in greater numbers. So thank you very much for being with us. There are more shareholders than we have representatives of the Wendel Group. The first 2 rows are made up of Wendel people, and then the rest of the room is shareholders, and that’s great to see. So thank you very much for outnumbering us in such a way.
I’m going to be chairing today’s proceedings. Today’s assembly is now officially open. We have Laurent Mignon and David Darmon here next to me. Laurent chairs the Executive Board, and David Darmon is a member of the Executive Board and General Director. You know both of them. And to my left, Sébastien Metzger, whom you might not know. He is the Legal Director for Wendel and Secretary of the Executive Board. Sébastien is with us with his Head of Legal Director since 2008. He joined in 2008, which was a great vintage, a great year to join us and to deal with a lot of debt-related issues that we had back then. So someone who’s acquired over the years, a great deal of experience.
I would like to also thank François de Wendel, my predecessor. He’s here in the room, and good afternoon also to all the members of the Supervisory Board with the Head of the Audit Committee and
This year’s FIFA World Cup is a historic one on multiple levels, from its new 48-team format to the 104 total games played beginning June 11.
It’s a tournament for the ages and one that needs help behind the scenes to provide insight, innovation and much more.
Advertisement
Enter Lenovo, the global technology powerhouse that serves as the official technology partner of FIFA, is helping deliver AI solutions to power the World Cup this summer at host sites across North America and around the world.
Lenovo is the official technology partner of FIFA heading into the 2026 World Cup. (Lenovo / Fox News)
“The FIFA World Cup represents the biggest stage in global sports and one of the most complex technology environments in the world,” Jeff Shafer, senior vice president of corporate marketing and chief communications officer at Lenovo, told Fox Business in an exclusive statement. “As the Official Technology Partner of the tournament, Lenovo is helping power an event that will connect billions of fans across 16 venues and three countries, where performance and reliability must be flawless every moment of every match.
“For us, this partnership is about far more than putting our logo on the field; it’s an opportunity to demonstrate how Lenovo’s full-stack portfolio — from devices and infrastructure to AI-powered solutions and services — can deliver at the highest possible scale and under the most intense pressure. If our technology can help power the world’s biggest tournament, it can help organizations solve their toughest challenges anywhere.”
Advertisement
As Shafer says, this partnership goes well beyond just the visual presence Lenovo will have at FIFA World Cup matches. It’s a swathe of tech solutions both entities have worked on together to impact all areas of the game, starting with the landmark announcement of Football AI Pro.
Co-developed by FIFA and Lenovo, Football AI Pro will bring unprecedented access to millions of data points and over 2,000 performance metrics for every team participating in the World Cup to access with strong privacy safeguards. The insight and analysis that can be done by coaches, players and analysts can help level the playing field for those teams that lack the same resources as bigger clubs like France, England and the U.S.
“With Football AI Pro, we will democratize access to data by providing the most complete set of football analytics to all competing teams and soon to fans as well,” FIFA president Gianni Infantino said in a statement. “But of course, this is just the beginning, so fans should stay tuned for more exciting developments with Football AI, and other innovations, as FIFA and Lenovo create unforgettable experiences in the months and years ahead.”
Advertisement
While teams will be using that tool on and off the pitch, one of the more noticeable AI applications by Lenovo and FIFA will be for all to see during matches: digital avatars.
Argentina forward Lionel Messi (10) kisses the World Cup Trophy after winning the 2022 World Cup final against France at Lusail Stadium. (Yukihito Taguchi/USA Today Sports / IMAGN)
There will be 3D avatars produced of players at the tournament using 3D assets and Advanced GenAI technology, which will help support the efficiency of the decision-making process made by referees during matches. In just six seconds, a player will step into a circle filled with cameras that scan their body to build the 3D asset, which will be used in key situations.
For example, during an offside replay in a match, 3D animations will appear on-screen, providing a greater visual contextualization for fans watching at home and in the stadium. The digital avatars will replicate the individual physical dimensions of the players competing.
“AI-enabled 3D avatars mark a major step forward in how officiating technology supports accuracy and transparency,” FIFA secretary general Mattias Grafström, said in a statement. “By combining precise player data with advanced visualization, this innovation strengthens confidence in key decisions and brings fans closer to the process than ever before.”
Advertisement
Furthermore, a new vantage point of the intense play on the pitch will be seen through a referee camera, which Lenovo’s AI solution helps stabilize in the moment, providing a clear visual for the viewer at home.
“This is a very practical application of AI,” Art Hu, Lenovo’s chief information officer and the chief technology delivery officer for the Solutions and Services Group, said in a statement. “This is not abstract. It’s very real and we’re working with FIFA to make it very accessible, intuitive and easy to use.”
Detail of the FIFA World Cup 2026 Match Ball “Trionda” at Brooklyn Bridge Park on October 2, 2025, in New York City. (Sarah Stier/Getty Images / Getty Images)
Finally, the unprecedented logistical and operational challenge the World Cup has for FIFA and its partners is the biggest it’s ever been in 2026 given matches being held across an entire continent and billions more watching around the globe.
There will be an Intelligent Command Center supporting all functional areas at FIFA, while providing insightful daily summaries generated by AI, which will monitor all FIFA World Cup operations in real-time. It will help officials observe, respond to situations if needed and view trends across the tournament’s footprint.
Advertisement
And this will help fans, as Lenovo developed “digital twins” of all the venues being used, where they can provide real-time data that will show where crowds are building, where lines are shortest and how people are moving throughout a venue.
Lenovo’s Smart Wayfinding, which provides cities, fan zones, landmarks, venues and every key point of interest that can be explorable for fans in an interactive space, will have real-time intelligence and AI-guided navigation attached to it, providing a frictionless experience for all.
Lenovo is offering FIFA a realm of AI possibilities that will impact officials, players and coaches, and fans ahead of the 2026 FIFA World Cup. (Lenovo / Fox News)
To enhance Lenovo’s messaging about how it’s impacting the FIFA World Cup, as well as the FIFA Women’s World Cup in 2027, the brand launched its “Maximum David” campaign with legend David Bekcham. The campaign highlights how AI-driven technology elevates the creativity, performance and impact of Beckham and ultimately how it will impact all those participating in the tournament.
Advertisement
From teams looking into data for an advantage to fans getting never-before-seen views of the world’s greatest show on the pitch, Lenovo and FIFA are working side by side to deliver the game like it’s never been seen on a global stage.
It will also start soon, as the first World Cup match will be held on June 11.
After a strong start in January the market corrected largely due to the Strait of Hormuz crisis. Technology was the quarter’s worst-performing S&P 500 sector, especially software-related companies which suffered from AI disruption fears, excessive stock-based compensation and high valuations. Adding to that were monetization concerns over a sizable increase in “hyperscaler” capital expenditures in excess of $660 billion. The conflict in Iran and resulting Strait of Hormuz shutdown effectively halted shipping of 20.5-21 million barrels per day of crude oil and refined products that pass through what is one of the world’s most critical commodity corridors. This boosted energy, the best performing sector. Value outperformed growth with the Russell 1000 Value Index advancing 2.10% compared to a decline of 9.78% for the Russell 1000 Growth Index.
Defense Spending on the Rise
Geopolitical uncertainties over the last several years have brought about steadily increasing defense budgets, particularly in the United States which saw an increase from $715 billion in 2020 to just under $850 billion in 2025. For the first time ever, the 2026 budget exceeds $1 trillion. These increases have been driven by events like the Russia-Ukraine conflict as well as the war in Israel. Most recently, the US proposed a $1.5 trillion defense budget for 2027, citing factors like increasing global threats and the need for more domestic defense infrastructure. Lockheed Martin (LMT), Northrop Grumman (NOC) and RTX (RTX) stand to be among the largest beneficiaries of rising defense budgets, as all three are prime contractors for the US’s proposed $185 billion “Golden Dome” nationwide missile defense system. General Dynamics (GD), meanwhile, serves as the prime contractor for the nation’s $65.8 billion naval modernization effort. Boeing (BA) should see consistent revenue following their award of the F-47 next-generation aircraft contract, which is particularly attractive as aircraft programs typically run for decades. The previous generation F-35 first delivered in 2011 is still in production. Outside of traditional defense companies, we also see some tech names as beneficiaries of higher military spending with Nvidia (NVDA), Intel (INTC) and Qualcomm (QCOM) providing processing and compute for current and future autonomous vehicle and drone programs.
Growing Risk in Private Equity and Private Capital
The private equity and credit markets have exploded in growth over the last decade and are among the fastest-growing alternative asset classes. S&P Global estimated that private market assets under management totaled $15 trillion in 2024, up from $10.89 trillion in 2022. They project that those markets could reach more than $18 trillion by 2027. Private equity investments account for over half of the market. This lightly regulated industry is now facing headwinds. Payment-in-Kind loans have flourished as borrowers struggle to meet cash interest payments. Private equity funds are unable to exit their mid-market companies and investors are questioning valuation parameters. The opaque nature of these funds has further damaged investor confidence.
Advertisement
AI Disruption Fears Hit Software Companies Hard
The Software as a Service (SaaS) industry was one of the hardest hit areas of the market during the first quarter as investors have increasingly become uncertain over AI’s potential for disruption that could commoditize the industry and compress profit margins. Forbes reported that the software sector’s price-to-earnings ratio fell to 20 times during the first quarter compared to around 35 at the end of 2025, the lowest level since 2014. Companies like Intuit (INTU), Adobe (ADBE), Salesforce (CRM) and FICO (FICO) saw their shares fall 30%-37% during the first quarter despite reporting strong earnings. Investors fear that AI agents could replace much of the work currently performed by software companies for a fraction of the cost. Intuit has been working to counter the fears by heavily investing in their AI agent platform, bringing it to all their existing products. Adobe has been doing the same and both companies have seen strong support for AI features with around 90% of users taking advantage of the new capabilities. On the commodity risk side, these companies possess an advantage over popular general purpose AI models as they have access to specialized proprietary data they can use to train their own models. Adobe owns hundreds of licensed images they use for training and provides protection from litigation. Intuit instills confidence that taxes and business operations will comply with laws and regulations. AI models training only on public general data have a history of hallucinating false information and presenting it as fact which could be incredibly costly when dealing with important financial information. Proprietary data and the promise of security is something that we see as an advantage for long-standing SaaS companies that could help them better compete with growing AI players. It is amazing to see the P/E compression of these stocks since Covid. Fiserv (FI)—an unglamorous back-office processor for banks—was valued at over 100x earnings four years ago and now trades at just 7x, despite delivering 39 consecutive years of double-digit earnings-per-share growth.
Contributors
Bank of New York Mellon (BK) reached all-time highs following their first quarter earnings report of a 42% increase in year-over-year earnings per share along with an 18% increase in interest income resulting from higher yields. Assets under management grew 12% to a record $59.4 trillion. AI initiatives have been paying off as AI agents led to 20% faster client onboarding and 80% faster settlement inquiry investigation; agents are now writing 40% of all code. They returned $1.4 billion through repurchases and dividends and authorized a new $10 billion share repurchase program. CEO Robin Vince has done an exceptional job since taking over four years ago. Major US banks as a whole are aggressively retiring stock in 2026 due to recent deregulation, with a record $33 billion bought back in the first quarter alone—up 35% from the prior year quarter. This is the type of “double play” return we seek; an undervalued, vital, dull business with inspired management improving operating results leading to a sixfold return on our investment.
Industrials were the best performing sector during the quarter relative to the overall Fund, due in part from strong reshoring thanks to low domestic natural gas prices, legislation like the CHIPS and Inflation Reduction Acts as well as geopolitical risks that incentivize companies to return manufacturing to the US. Last year’s massive increase in hyperscaler capital expenditures continues, projected to be over $650 billion this year and may account for up to half of US GDP growth. Strong performers in the Fund included Gates (GTES), Caterpillar (CAT), Corning (GLW), and FedEx (FDX). Corning has seen strong demand for their optical connectivity products used in AI-focused data centers. Corning CEO Wendell Weeks is impressive in his ability to execute.
Defense and aerospace companies Boeing, Parker-Hannifin (PH), General Dynamics and RTX have reaped the benefits of a massive increase in global defense spending in response to rising conflicts.
Advertisement
Skilled labor educators Lincoln Educational (LINC) and Universal Technical Institute (UTI) have reported strong growth in student starts as demand for trades continues to rise. The expansion of data centers has led to high demand for electricians, HVAC technicians, welders and CNC machining engineers. AI automation is expected to impact many professional industries, driving interest in trades that are viewed as more resistant to disruption. Reshoring trends in the US specifically in the semiconductor and defense industries are also contributing to strong student starts.
Energy refiners Valero (VLO) and Phillips 66 (PSX) outperformed with diesel and Jet A fuel prices soaring. The crack spread hit a record $88.25 per barrel of oil in March. Chevron (CVX) has been a major beneficiary of years of diligent investments in oil and gas production.
Detractors
UnitedHealth (UNH) has been a major laggard for the past quarter and year. However, since CEO Stephen Hemsley’s return last May operating performance has been improving. We made over a fivefold return under his previous tenure from 2006-2017 and are confident that he can navigate a successful turnaround going forward. The recent medical cost ratio (MCR) of 83.9% is the lowest in two years and combined with a 2.48% CMS rate increase this spring has been a big boost. The lower amount spent on patient medical claims follows the company’s late 2025 shift to focus on higher margin patients over aggressive membership growth. Total membership has fallen by about 700,000 since the end of 2025. Management cited their higher margins as the reason for raising their full year adjusted earnings per share guidance to over $18.25, up from their previous guidance of $17.75 in January and consensus estimates of $17.86. Going forward, management also announced at least $1.5 billion in spending on artificial intelligence technology in 2026. This technology will be focused on areas like helping members understand their coverage and automating some administrative tasks and claims processing.
Software-related stocks in the portfolio have been hit hard due to the threat of margin compression from artificial intelligence. Microsoft (MSFT)’s 21.9% drop in the quarter was the worst decline since the 2008 financial crisis. They are spending $190 billion on AI-related capital expenditures in 2026 yet their AI Copilot product has failed to scale, with less than 15 million total paid seats. Google Gemini has successfully integrated their AI and captured the largest share of casual AI users with 2 billion people interacting with “Gemini-powered AI overviews” in Google Search every month. Microsoft has a large installed base with Fortune 500 companies. They have over $88 billion in cash on the balance sheet which is a huge competitive advantage. It is hard to bet against CEO Satya Nadella who took over in February 2014 and has a great record with the stock up over elevenfold.
Advertisement
First Quarter 2026 Performance Update
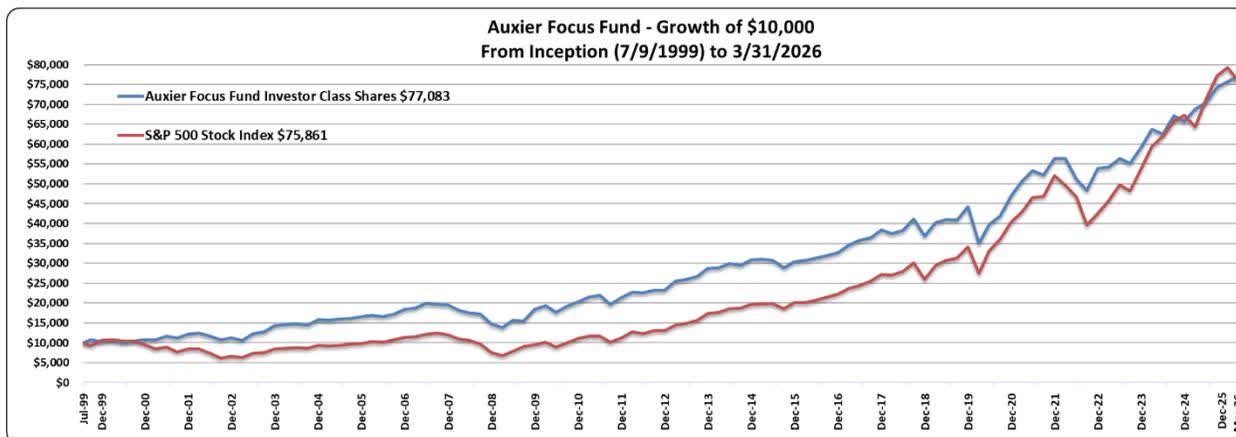
Auxier Focus Fund’s Investor Class gained 1.73% in the first quarter of 2026 with stocks up 2.00%. For the same period the S&P 500 cap-weighted index declined 4.33% and the equal weight returned 0.67%. The Russell 1000 Value was up 2.10%. For the quarter, fixed income investments as measured by the S&P US Aggregate Bond Index returned 0.04% and the longer-dated ICE US Treasury 20+ Year Index was up 0.11%. Stocks in the Fund comprised 92% of the portfolio. The breakdown was 82.5% domestic and 9.5% foreign, with 8.0% in short-term debt instruments. A hypothetical $10,000 investment in the Fund from inception on July 9, 1999 to March 31, 2026 is now worth $77,083 vs $75,861 for the S&P 500 and $65,542.76 for the Russell 1000 Value Index. During the same period, equities in the Fund (entire portfolio, not share class specific) have had a gross cumulative return of 1,323.34% vs 658.61% for the S&P. The Fund had an average exposure to the market of 82% over the entire period. Our results are unleveraged.
In Closing
We continue to seek businesses and managements displaying a strong culture with a heart and soul. Great leadership combined with enduring business models purchased in periods of fear and uncertainty have generated most of our returns over the past three decades. We have had good luck
with gritty founder CEOs who love their business. There is however a shortage of great operators. The key is to identify these managers and businesses ahead of time and do vigorous daily research to determine the sustainable earnings power of each entity. While we are aggressively monitoring the risks of a continued Strait of Hormuz shutdown, we remain mindful that many opportunities can be missed by focusing too much on macro headlines and not enough on micro details of improving operating fundamentals with exceptional leaders. Program trading dominates the investment landscape, but we firmly believe that investing is still the craft of the specific and knowing what you own is crucial to mitigating risk and improving investment odds.
Finally, during this time of global turmoil Warren Buffett said it best: “What we learn from history is that people do not learn from history. You can count on fear, greed and folly to be ever present in the marketplace. Their sequence is unpredictable; their duration is unpredictable; and their effects are unpredictable. But their presence is certain. ” Emotional and psychological responses to money often lead to substantial misappraisals in auction markets, creating new opportunities.
We appreciate your trust.
Advertisement
Jeff Auxier
Before investing you should carefully consider the Fund’s investment objectives, risks, charges and expenses. This and other information is in the prospectus, a copy of which may be obtained by calling (877) 328-9437 or visiting the Fund’s website. Please read the prospectus carefully before you invest.
Fund returns (i) assume the reinvestment of all dividends and capital gain distributions and (ii) would have been lower during the period if certain fees and expenses had not been waived. Performance shown is for the Fund’s Investor Class shares; returns for other share classes will vary.
Performance for Investor Class shares for periods prior to December 10, 2004 reflects performance of the applicable share class of Auxier Focus Fund, a series of Unified Series Trust (the “Predecessor Fund”). Prior to January 3, 2003, the Predecessor Fund was a series of Ameriprime Funds. The performance of the Fund’s Investor Class shares for the period prior to December 10, 2004 reflects the expenses of the Predecessor Fund.
The Fund may invest in value and/or growth stocks. Investments in value stocks are subject to risk that their intrinsic value may never be realized and investments in growth stocks may be susceptible to rapid price swings, especially during periods of economic uncertainty. In addition, the Fund may invest in mid-sized companies which generally carry greater risk than is customarily associated with larger companies. Moreover, if the Fund’s portfolio is overweighted in a sector, any negative development affecting that sector will have a greater impact on the Fund than a fund that is not overweighted in that sector. An increase in interest rates typically causes a fall in the value of a debt security (Fixed-Income Securities Risk) with corresponding changes to the Fund’s value.
Advertisement
Foreside Fund Services, LLC, distributor.
The S&P 500 Index (also known as the S&P 500 Cap-Weighted Index) is a broad-based, unmanaged measurement of changes in stock market conditions based on 500 market-capitalization-weighted widely held common stocks. The S&P 500® Equal Weight Index (EWI) is the equal-weight version of the widely used S&P 500. The index includes the same constituents as the capitalization weighted S&P 500, but each company in the S&P 500 EWI is allocated a fixed weight – or 0.2% of the index total at each quarterly rebalance. The Russell 1000® Growth Index measures the performance of the large cap growth segment of the US equity universe. It includes those Russell 1000® companies with higher price-to-book ratios and higher forecasted growth values. The Russell 1000 Value Index refers to a composite of large and mid-cap companies located in the United States that also exhibit a value probability. The Russell 1000 Value is published and maintained by FTSE Russell. S&P US Aggregate Bond Index is designed to measure the performance of publicly issued US dollar denominated investment-grade debt. ICE US Treasury 20+ Year Index (4PM), is a 4pm pricing variant of the ICE US Treasury 20+ Year Index, which is market value weighted and is designed to measure the performance of US dollar-denominated, fixed rate securities with minimum term to maturity greater than twenty years. One cannot invest directly in an index or average.
As of 3/31/2026 the Fund’s top ten equity holdings were: Philip Morris International (PM) (4.7%); Corning Inc (4.2%); Kroger Co. (KR) (4.1%); Microsoft Corp. (3.7%); Alphabet, Inc (GOOGL) Voting Class (3.7%); Mastercard Inc. (MA) (3.6%); Bank of New York Mellon Corp (3.4%); Bank of America Corp (BAC) (3.0%); Johnson & Johnson (JNJ) (3.0%); Merck & Co. Inc. New (MRK) (2.6%).
The price-to-earnings ratio (P/E ratio) is the ratio for valuing a company that measures its current share price relative to its per-share earnings (EPS).
Advertisement
Earnings per share (EPS) growth is the percentage increase or decrease in a company’s net income allocated to each outstanding share of common stock over a specific period, generally TTM (Trailing Twelve Months) or annually. It measures profitability expansion, indicating how efficiently a company generates profit for shareholders.
A crack spread is the price difference between a barrel of crude oil and the refined products (gasoline, diesel) produced from it.
A Medical Cost Ratio (MCR) is the percentage of insurance premium revenue an insurer spends on clinical services and quality improvement rather than administrative costs or profit.
The Centers for Medicare & Medicaid Services (CMS) is the federal agency within the U. S. Department of Health and Human Services (HHS) that administers the Medicare program.
Advertisement
The views in this shareholder letter were those of the Fund Manager as of the letter’s publication date and may not reflect his views on the date this letter is first distributed or anytime thereafter. These views are intended to assist readers in understanding the Fund’s investment methodology and do not constitute investment advice.
Baron First Principles ETF ® ((the Fund)) had a disappointing start to 2026, with a decline of 8.51% (NAV) compared with a 9.54% loss for the Russell 3000 Growth Index ((the Benchmark)). The declines were due to continued concerns about the effects of AI on many businesses throughout the portfolio as well as worries about the impact of the Iran war on inflation, interest rates, and consumer spending. These declines were partially offset by Space Exploration Technologies Corp. (SPACE) (SpaceX) and its deal to acquire X. AI Holdings Corp. (X.AI) (xAI), which resulted in the revaluation of the combined business at a significantly higher enterprise value.
While we are disappointed with the start of the year, we continue to see opportunities throughout the portfolio. Our portfolio companies continue to do quite well and are generating strong growth and cash flow for additional investments in their businesses to accelerate growth further with excess cash being returned to shareholders through share buybacks and dividends.
Our companies all have strong balance sheets with many operating with financial leverage below their targeted levels, giving them additional liquidity to lever up and buy back more stock should they desire.
Advertisement
Many stocks in the portfolio are now trading at historically low valuations, and we believe there is a disconnect between where these businesses trade today and what they can become over time. As a result, this past quarter we saw an accelerated rate of insider purchases from executives and directors at Verisk Analytics, Inc. (VRSK) , Birkenstock Holdings plc, Vail Resorts, Inc. (MTN) , FactSet Research Systems Inc. (FDS) , and MSCI Inc. (MSCI) When we see these insider purchases, it gives us further confidence in our investment theses for these growth businesses and reinforces our belief that valuations are attractive. As a result, during the quarter we increased our positions in many of these stocks while adding a couple of new names as well. We are continuing to make sure the portfolio remains focused while being cognizant that positions are appropriately sized for risk in this concentrated Fund.
Cumulative performance (%) for periods ended March 31, 2026
ETFMarketPrice ¹,²
ETFNAV ¹,²
Russell3000GrowthIndex ¹
Russell3000Index ¹
QTD
(8.55)
(8.51)
(9.54)
(3.96)
Since Inception(12/12/2025)
(8.88)
(9.19)
(9.20)
(3.90)
.
Advertisement
Performance listed in the above table is net of annual operating expenses. The total annual fund operating expense ratio as of December 5, 2025 was 1.00%.
The performance data quoted represents past performance. Past performance is no guarantee of future results. The investment return and principal value of an investment will fluctuate; an investor’s shares, when redeemed, may be worth more or less than their original cost. Total returns assume the reinvestment of all distributions and the deduction of all fund expenses. Current performance may be lower or higher than the performance data quoted. For performance information current to the most recent month end, visit BaronCapitalGroup. com or call 1-800-99-BARON.
We believe this combination of strong revenue growth with well-positioned balance sheets and attractive valuations offers multiple avenues for potential returns for investors. As a result, we view the portfolio as compelling, with a favorable risk/reward profile.
Further, we believe there is still a ton of capital remaining on the sidelines waiting to be invested, including private equity firms who continue to raise new funds. We believe as rates continue to move lower over the next year, public to private transactions and strategic acquisitions should accelerate, which should further support valuations and our investments.
Advertisement
We continue to believe these businesses have strong competitive advantages with underpenetrated growth opportunities ahead of them and robust balance sheets to finance their growth.
While it is only the Fund’s first full quarter of performance, we believe the Fund should generate significant excess returns over time with much less than market risk. This is due to the balanced nature of the portfolio with approximately 35% invested in high-growth disruptive investments that can generate revenue growth of as much as 20% to 30%; between 15% and 20% of the portfolio in real irreplaceable assets that trade at significant discounts to replacement cost and where they would sell to private equity or another strategic buyer; between 20% and 25% in financials businesses, many of which are financial data providers that have recurring revenue and earnings given the embedded nature of their products in the workflow of their customers; and the balance in core double-digit revenue growing businesses that are more mature in their lifecycle and generate earnings growth while using excess cash for dividend increases, share buybacks, and additional investments in the business to accelerate growth further.
* Individual weights may not sum to displayed total due to rounding.
** Return calculations are transaction based and are calculated from the underlying security-level data; they may not correspond with published performance information.
Sources: Baron Capital, FTSE Russell, and FactSet PA.
Advertisement
Portfolio holdings are subject to change. Current and future portfolio holdings are subject to risk. Past performances is not a guarantee of future results.
Aside from two of our private investments, SpaceX and xAI successfully completing their combination at a valuation significantly higher than previous marks, performance in the first quarter was hurt by continued concerns about the introduction of AI into the economy and those businesses that could be impacted most from the new competition. These included our subscription-based software and platform investments such as Spotify Technology S. A. , FactSet, and Guidewire Software, Inc. However, while the increased competition hurt the valuation of these stocks in the quarter, it has not impacted financials, and these companies continue to generate strong revenue growth and margins in line with company and investor expectations.
Further losses were seen in our exposure to consumer-focused investments given worries about the escalation of the war in Iran and what that could mean for inflation, interest rates, and consumer spending. These included companies such as Red Rock Resorts, Inc. , Hyatt Hotels Corporation , and On Holding AG . However, despite worries about the war and its impact on the consumer, these companies continue to do quite well as the consumer remains resilient despite macro concerns.
Global digital music streaming platform Spotify declined by 17.4% in the first quarter and detracted 77 bps from performance as investors were concerned about the impact AI music could have on the conversion of free subscribers to paying subscribers as well as how it could impact time on the platform. In addition, further concerns about the timing of price increases and resulting margin expansion also frustrated investors. However, the company continues to institute price increases across multiple regions and complete negotiations with major record labels. User growth remains strong growing at a double-digit rate with high engagement and low churn even with price increases. The company remains on a path to increase gross margins through its high-margin artist promotions marketplace, growing podcast contribution, and ongoing investments in advertising where revenue growth is expected to accelerate this year. We continue to view Spotify as a long-term winner in music streaming with potential to reach 1 billion-plus subscribers by 2030.
Advertisement
Property and casualty (P&C) insurance software vendor Guidewire declined 24.7% in the first quarter and detracted 84 bps from performance. The declines were due to continued AI concerns and potential future competition. However, the company continues to do quite well and after a multi-year transition period, the company’s cloud transition is substantially complete, and insurers are upgrading to the cloud at an accelerated rate. We believe that cloud will be the sole path forward, with annual recurring revenue (ARR) benefiting from new customer wins and migrations of the existing customer base to the company’s Insurance Suite Cloud. We also expect the company to shift R&D resources to product development from infrastructure investment, which should help drive cross-sales into its sticky installed base and potentially accelerate ARR over time. We are encouraged by Guidewire’s subscription gross margin expansion, which improved by approximately 580 bps in its most recently reported quarter. We believe Guidewire will be the critical software vendor for the global P&C insurance industry, capturing 30% to 50% of its $15 billion to $30 billion total addressable market and generating margins above 40%.
Shares of global hotelier Hyatt declined 8.6% and hurt performance by 34 bps in the first quarter as investors were concerned with a potential deceleration in revenue per available room (RevPAR) growth due to the Middle East conflict as well as cartel uprisings in Mexico that could hurt travel to those parts of the world. However, according to Hyatt management, the Middle East is only 3% of total fees and Mexico, while it represents approximately 7% of global rooms, is seeing travelers switch and rebook for other places including its Caribbean properties. There has been no impact on unit growth, and the company still expects to grow units between 6% and 7% this year. We believe this growth combined with low single-digit RevPAR growth and slight margin improvement should lead to double-digit EBITDA growth this year. This should generate strong free cash flow, which the company can use for further share buybacks and reinvestment back into the business. The company still has a strong investment grade balance sheet with 90% of the business coming through fees that should allow them to overcome any short-term outside disruptions to its business. Hyatt trades at a discount to peers despite a similar growth and mix of business. We believe this discount should narrow over time as investors see the continued growth and resilience of its business model.
Shares of Las Vegas Local casino operator, Red Rock Resorts, declined 11.2% in the first quarter and hurt performance by 44 bps as investors were concerned with a potential slowdown in Las Vegas gaming revenue brought about by the macro uncertainty from the war in Iran. Combine this slowdown with construction disruption due to many renovation and expansion projects occurring at its properties and current earnings could decelerate. However, the company continues to spend at its resorts as management sees further opportunities for growth from continued population growth and a higher net worth individual coming to Las Vegas. The company continues to generate strong cash flow that should produce accelerated growth in the coming years. We continue to believe the stock remains attractively valued as the company’s founders recently bought stock at current levels giving us further confidence in the company’s accelerated growth prospects.
Top contributors to performance for the quarter
Advertisement
Year Acquired
Market Cap When Acquired ($B)
Quarter End Market Cap ($B)
Total Return (%)
Contribution to Return (%)
Space Exploration Technologies Corp.
2026
800.0
1,250.0
20.07
2.05
FIGS, Inc.
2026
1.7
2.5
42.96
0.65
Choice Hotels International, Inc.
2025
4.2
4.8
10.74
0.33
Interactive Brokers Group, Inc.
2025
109.1
114.0
5.43
0.28
Live Nation Entertainment, Inc.
2025
33.3
35.8
6.46
0.12
Space Exploration Technologies Corp. (SpaceX) is a high-profile private company founded by Elon Musk. The company’s primary focus is on developing and launching advanced rockets, satellites, and spacecrafts, with the ambitious long-term goal of making life multi-planetary. SpaceX is generating significant value with the rapid expansion of its Starlink broadband service. The company is successfully deploying a vast constellation of Starlink satellites in Earth’s orbit, reporting substantial growth in active users, and regularly deploying new and more efficient hardware technology. Furthermore, SpaceX has established itself as a leading launch provider by offering highly reliable and cost-effective launches, leveraging the company’s reusable launch technology. SpaceX capabilities extend to strategic services such as human spaceflight missions. Moreover, SpaceX is making tremendous progress on its newest rocket, Starship, which is the largest, most powerful rocket ever flown. This next-generation vehicle represents a significant leap forward in reusability and space exploration capabilities. We value SpaceX using prices of recent financing transactions.
FIGS, Inc. designs and sells scrubwear for health care professionals through a digitally native, direct-to-consumer strategy. Shares rose following robust fourth-quarter results and upbeat 2026 guidance. Revenue expanded 33% to $201.9 million, reflecting broad-based momentum across categories and geographies and exceeding expectations. Holiday demand was strong throughout the season and remained elevated through quarter-end. U. S. revenue rose 28.7% to $164.2 million, while international revenue accelerated 55% to $37.7 million, with scrubs and non-scrubwear contributing gains of 35% and 26%, respectively. This topline strength translated to profitability, with EBITDA rising 29.8% to $26.7 million. Building on this momentum, revenue is expected to grow in the low-20% range in the first quarter and 10% to 12% for the full year. Additional drivers include accelerating international expansion, new store openings (both the ramping 2025 cohort and four locations planned for 2026), and continued traction in TEAMS (FIGS’ enterprise and group ordering business). The company maintains a strong balance sheet, with no debt and roughly $300 million in cash and marketable securities.
Global hotel franchisor Choice Hotels International, Inc. contributed to performance during the quarter as the company saw a slight acceleration in revenue per available room across its portfolio. Choice continues to grow units at a low-single-digit rate and is benefiting from higher royalty rates on new franchise contracts, driving mid-single-digit growth in earnings and free cash flow. The company is using this cashflow to return capital through share repurchases. We continue to believe the stock offers compelling value, trading at a roughly five multiple-point discount to its historical average. Choice maintains a strong balance sheet, providing flexibility for additional share buybacks, particularly when the stock trades below the company’s view of intrinsic value. Choice’s steady growth profile, both domestically and internationally, should further support attractive shareholder returns over time.
Top detractors from performance for the quarter
Advertisement
Year Acquired
Market Cap When Acquired ($B)
Quarter End Market Cap ($B)
Total Return (%)
Contribution to Return (%)
Tesla, Inc.
2025
1,526.4
1,395.0
(17.28)
(2.43)
CoStar Group, Inc.
2025
28.9
16.9
(37.39)
(1.31)
Gartner, Inc.
2025
16.9
11.2
(35.34)
(0.95)
Shopify Inc.
2025
213.8
154.9
(24.26)
(0.85)
Guidewire Software, Inc.
2025
17.4
12.7
(24.72)
(0.84)
Tesla, Inc. designs, manufactures, and sells fully electric vehicles (EVs), solar products, and energy storage solutions, while developing advanced real-world AI technologies. Following robust gains in late 2025, shares fell as investors awaited progress on robotaxis and assessed the company’s sizable investments in manufacturing and AI. Operationally, Tesla delivered strong quarterly results amid a challenging EV environment. Automotive gross margins improved sequentially and beat expectations, the energy storage business maintained robust momentum with best-in-class margins, and battery cell production ramped. The company continues to advance its AI and autonomous driving initiatives at a rapid pace. Management anticipates meaningful robotaxi expansion in 2026 and continues to finalize the Optimus Gen 3 design and build out large-scale manufacturing capacity for humanoid robots. Tesla is also releasing major Full Self-Driving enhancements, scaling AI training compute, and deepening vertical integration in semiconductor design and production. These initiatives, while increasing near-term capital spending, underscore Tesla’s pivot toward becoming a leader in physical AI.
CoStar Group, Inc. is the leading provider of information and marketing services to the commercial and residential real estate industries. Shares fell due to multiple compression driven by rising AI fears. The market has come to view AI as an existential risk for a growing number of industries—including software, business services, information services, and video games—despite no evidence of any fundamental impact to these sectors. This “shoot first and ask questions later” dynamic has resulted in meaningful share price declines. We continue to own CoStar given its differentiated data assets and significant growth opportunities in providing enhanced real estate information, analytics, and marketplace offerings. CoStar boasts an enviable business model with high levels of recurring revenue and meaningful cash flow generation potential. While near-term cash flow is obscured by elevated investment in Homes. com, we expect spending to moderate and cash flow to improve over the next several years. The company also maintains a substantial cash balance, which we are hopeful will be used to aggressively repurchase shares at current depressed valuation levels.
Syndicated research provider Gartner, Inc. detracted from performance as valuation multiples compressed amid rising concerns around AI. Investors have increasingly viewed AI as a potential existential risk across a widening range of industries—including software, business services, information services, and video games—despite no evidence of any fundamental impact to these sectors. This “shoot first and ask questions later” dynamic has driven meaningful share price declines across the group. Against this backdrop, shares of Gartner came under pressure after the company reported contract value growth that was just 0.5% below expectations, underscoring the dramatic valuation compression at play. We continue to own Gartner given its large addressable market, significant competitive advantages, and robust free cash flow generation, which we expect management to deploy toward share repurchases at depressed valuation levels. We also view Gartner as an AI beneficiary, as it can leverage emerging tools to extract deeper insights from its vast trove of proprietary data and deliver it to customers in chatbot-type formats that meaningfully enhance its value proposition.
Portfolio Structure
We are steadfast in our commitment to long-term investing in competitively advantaged, growth businesses. We run a balanced portfolio of uncorrelated businesses to help reduce portfolio risk. We believe this portfolio strategy is an effective way to mitigate risk and increase the purchasing power of your savings. While there will always be market volatility, we believe we can reduce that volatility via this portfolio due to its balanced nature.
Advertisement
As of March 31, 2026, the Fund owned 24 investments. From a quality standpoint, the Fund’s investments have generally strong long-term sales growth and margins with the ability to possibly double earnings and cash flow over the next four to five years. Many of our portfolio companies generate recurring earnings and cash flow with low churn rates giving them enhanced visibility into growth and significant pricing power. Many of our portfolio companies continue to invest in their businesses to accelerate growth further. While this hurts current margins, we believe they should generate strong returns on invested capital, and the investments will accelerate further growth in the future.
While focused, the Fund is diversified by sector. The Fund’s weightings are significantly different than those of the Benchmark. For example, the Fund is heavily weighted to Consumer Discretionary businesses with 35.6% of its net assets in this sector versus 12.9% for the Benchmark. The Fund has no exposure to Energy, Materials, or Utilities. We believe companies in these sectors can be cyclical, linked to commodity prices, and/or have little if any competitive advantage. The Fund also has lower exposure to Health Care stocks at 1.9% versus 8.4% for the Benchmark. The performance of many stocks in the Health Care sector can change quickly due to exogenous events or binary outcomes (e. g. , biotechnology and pharmaceuticals). As a result, we do not invest a large amount in these stocks in this focused portfolio. In Health Care, we invest in competitively advantaged companies that are leaders in their industries such as IDEXX Laboratories, Inc. , the leading provider of diagnostics to the veterinary industry and who is benefiting from the increase in pets that people acquired during the COVID pandemic, especially as these pets age. The Fund is further diversified by investments in businesses at different stages of growth and development.
Disruptive Growth Companies
Percent ofNet Assets(%)
YearAcquired
CumulativeReturnSince DateAcquired(%)
Tesla, Inc.
13.6
2025
(16.8)
Space Exploration Technologies Corp.
12.6
2026
20.1
Shopify Inc.
5.4
2025
(26.2)
Spotify Technology S. A.
4.3
2025
(25.3)
Disruptive Growth firms accounted for 35.8% of the Fund’s net assets. On current metrics, these businesses may appear expensive; however, we think they will continue to grow significantly and, if we are correct, they have the potential to generate exceptional returns over time. Examples of these companies include EV leader Tesla, Inc. , commercial satellite and launch company, Space Exploration Technologies Corp. , and audio streaming service provider Spotify Technology S. A. These companies all have large underpenetrated addressable markets and are well financed with significant equity stakes by these founder-led companies, giving us further conviction in our investment.
Advertisement
Core Growth Investments
Percent ofNet Assets(%)
YearAcquired
CumulativeReturnSince DateAcquired(%)
Verisk Analytics, Inc.
4.7
2025
(14.6)
Gartner, Inc.
4.2
2025
(36.5)
Guidewire Software, Inc.
3.7
2025
(32.5)
FIGS, Inc.
2.5
2026
42.7
On Holding AG
2.3
2025
(27.0)
Live Nation Entertainment, Inc.
1.9
2025
11.5
IDEXX Laboratories, Inc.
1.9
2025
(19.9)
Birkenstock Holding plc
1.8
2026
(6.3)
HEICO Corporation
1.7
2025
(13.5)
Core Growth investments, steady growers that continually invest in their businesses for growth and return excess cash-flow to shareholders, represented 24.7% of net assets. An example would be FIGS, Inc. , the largest provider of scrubs and other attire to health care workers. The company continues to add new customers and increase the level of spending per customer as they add new articles of clothing and open new stores both domestically and abroad. This has allowed them to grow their addressable market and improve client retention and cash flow. FIGS continues to invest its cash flow in its business to accelerate growth further, which we believe should generate strong returns over time.
Financials Investments
Percent ofNet Assets(%)
YearAcquired
CumulativeReturnSince DateAcquired(%)
MSCI Inc.
6.6
2025
7.7
The Charles Schwab Corporation
4.7
2025
(4.9)
FactSet Research Systems Inc.
4.4
2025
(21.8)
Interactive Brokers Group, Inc.
3.0
2025
24.1
Kinsale Capital Group, Inc.
2.9
2025
(17.4)
Arch Capital Group Ltd.
2.3
2025
0.6
Financials investments accounted for 23.9% of the Fund’s net assets. These businesses generate strong recurring earnings through subscriptions and premiums that generate highly predictable earnings and cash flow. These businesses use cash flows to continue to invest in new products and services, while returning capital to shareholders through share buybacks and dividends. These companies include Arch Capital Group Ltd. , FactSet Research Systems Inc. , and MSCI Inc.
Advertisement
Investments with Real/Irreplaceable Assets
Percent of Net Assets (%)
Year Acquired
Cumulative Return Since Date Acquired (%)
Hyatt Hotels Corporation
4.6
2025
3.8
Red Rock Resorts, Inc.
3.6
2025
(9.3)
Choice Hotels International, Inc.
2.9
2025
9.2
Vail Resorts, Inc.
2.7
2025
(17.8)
Airbnb, Inc.
1.7
2025
6.5
Companies that own what we believe are Real/Irreplaceable Assets represent 15.5% of net assets. Vail Resorts, Inc. , owner of the premier ski resort portfolio in the world, upscale lodging brand Hyatt Hotels Corporation , and Red Rock Resorts, Inc. , the largest player in the Las Vegas Locals casino gaming market, are examples of companies we believe possess meaningful brand equity and barriers to entry that equate to pricing power over time.
Portfolio Holdings
As of March 31, 2026, the Fund’s top 10 holdings represented 64.9% of net assets. We have a long history of investing in many of these businesses across the Firm and believe they continue to offer significant appreciation potential, although we cannot guarantee that will be the case.
The top five positions in the portfolio, Tesla, Inc. , Space Exploration Technologies Corp. , MSCI Inc. , Shopify Inc. , and Verisk Analytics, Inc. , all have, in our view, significant competitive advantages due to strong brand awareness, technologically superior industry expertise, or exclusive data that is integral to their operations. We think these businesses cannot be easily duplicated and have large market opportunities to penetrate further, which enhances their potential for superior earnings growth and shareholder returns.
Advertisement
Top 10 holdings
Year Acquired
Market Cap When Acquired ($B)
Quarter End Market Cap ($B)
Quarter End Investment Value ($M)
Percent of Net Assets (%)
Tesla, Inc.
2025
1,526.4
1,395.0
32.4
13.6
Space Exploration Technologies Corp.
2026
800.0
1,250.0
30.0
12.6
MSCI Inc.
2025
41.4
39.4
15.7
6.6
Shopify Inc.
2025
213.8
154.9
12.8
5.4
Verisk Analytics, Inc.
2025
30.3
26.2
11.2
4.7
The Charles Schwab Corporation
2025
176.7
168.1
11.1
4.7
Hyatt Hotels Corporation
2025
15.3
13.6
10.9
4.6
FactSet Research Systems Inc.
2025
10.9
8.1
10.6
4.4
Spotify Technology S. A.
2025
124.6
99.8
10.1
4.3
Gartner, Inc.
2025
16.9
11.2
10.0
4.2
Thank you for investing in the Baron First Principles ETF®. We continue to work hard to justify your confidence and trust in our stewardship of your family’s hard-earned savings. We also continue to try to provide you with information we would like to have if our roles were reversed. This is so you can make an informed judgment about whether the Fund remains an appropriate investment for your family.
Sincerely,
Ronald Baron, CEO, Portfolio Manager
Advertisement
David Baron, Co-President, Portfolio Manager
Michael Baron, Co-President, Portfolio Manager
References
The Russell 3000® Index measures the performance of the largest 3,000 U. S. companies representing approximately 98% of the investable U. S. equity market. The Russell 3000® Growth Index measures the performance of the broad growth segment of the U. S. equity universe.
The performance data in the table does not reflect the deduction of taxes that a shareholder would pay on Fund distributions or redemptions of Fund shares.
¹ The Russell 3000® Index measures the performance of the largest 3,000 U. S. companies representing approximately 98% of the investable U. S. equity market, as of the most recent reconstitution. The Russell 3000® Growth Index measures the performance of the broad growth segment of the U. S. equity universe. All rights in the FTSE Russell Index (the “Index”) vest in the relevant LSE Group company which owns the Index. Russell® is a trademark of the relevant LSE Group company and is used by any other LSE Group company under license. Neither LSE Group nor its licensors accept any liability for any errors or omissions in the indexes or data and no party may rely on any indexes or data contained in this communication. The Fund includes reinvestment of dividends, net of withholding taxes, while the Russell Indexes include reinvestment of dividends before taxes. Reinvestment of dividends positively impacts the performance results. The indexes are unmanaged. Index performance is not Fund performance. Investors cannot invest directly in an index.
² The performance data in the table does not reflect the deduction of taxes that a shareholder would pay on Fund distributions or redemptions of Fund shares.
Advertisement
Investors should consider the investment objectives, risks, and charges and expenses of the investment carefully before investing. The prospectus and summary prospectus contains this and other information about the ETF. You may obtain them from the Funds’ distributor, Baron Capital, Inc. , by calling 1-800-99-BARON or visiting BaronCapitalGroup. com. Please read them carefully before investing.
Risks: The Fund is non-diversified which means, in addition to increased volatility of the Fund’s returns, it will likely have a greater percentage of its assets in a single issuer or a small number of issuers, including in a particular industry than a diversified fund. Single issuer risk is the possibility that factors specific to an issuer to which the Fund is exposed will affect the market prices of the issuer’s securities and therefore the net asset value of the Fund. Specific risks associated with leverage include increased volatility of the Fund’s returns and exposure of the Fund to greater risk of loss in any given period.
Investors generally incur the cost of the spread between the prices at which shares are bought and sold. Buying and selling shares may result in brokerage commissions which will reduce returns.
Prior to trading in the secondary market, shares of the fund are “created” at NAV by market makers, large investors and institutions only in block-size Creation Units. Each “creator” or “Authorized Participant” enters into an authorized participant agreement with Baron Capital, Inc. Only an Authorized Participant may create or redeem Creation Units directly with the fund.
Investors buy and sell shares of ETFs at market price (not NAV) in the secondary market throughout the trading day. These shares are not individually available for purchase or redemption directly from the ETF. Baron Capital, Inc. serves as the distributor of the Creation Units for the ETFs on an agency basis. Baron Capital does not maintain a secondary market in Fund’s shares.
Advertisement
The Fund may not achieve its objectives. Portfolio holdings are subject to change. Current and future portfolio holdings are subject to risk.
The discussions of the companies herein are not intended as advice to any person regarding the advisability of investing in any particular security. The views expressed in this report reflect those of the respective portfolio manager only through the end of the period stated in this report. The portfolio manager’s views are not intended as recommendations or investment advice to any person reading this report and are subject to change at any time based on market and other conditions and Baron has no obligation to update them.
This report does not constitute an offer to sell or a solicitation of any offer to buy securities of Baron First Principles ETF by anyone in any jurisdiction where it would be unlawful under the laws of that jurisdiction to make such offer or solicitation.
EBITDA , short for earnings before interest, taxes, depreciation, and amortization, is an alternate measure of profitability to net income. It’s used to assess a company’s profitability and financial performance. Free Cash Flow (FCF) represents the cash that a company generates after accounting for cash outflows to support operations and maintain its capital assets. Return on Investment (ROI) is a performance measure used to evaluate the efficiency or profitability of an investment or compare the efficiency of a number of different investments.
Advertisement
BAMCO, Inc. is an investment adviser registered with the U. S. Securities and Exchange Commission (SEC). Baron Capital, Inc. is a broker-dealer registered with the SEC and member of the Financial Industry Regulatory Authority, Inc. (FINRA).
























































You must be logged in to post a comment Login