

Crypto World
Buying the dip? Strategy prefers the top of the range


Strategy (formerly MicroStrategy) founder Michael Saylor purchased 1,031 bitcoin (BTC) last week at an average price of $74,326.
Saylor’s buy was in the 80th percentile of the available range and BTC traded between $67,354 and $76,013 during that period.
It wasn’t a fluke.
Year-to-date across his 12-weekly SEC Form 8-K disclosures totaling 89,599 BTC purchases for $7.25 billion this year, Strategy has consistently bought in the top half of each week’s trading range.
This is according to our analysis of the company’s own SEC filings and corresponding BTC market data.
Strategy’s 2026 purchases of BTC landed above the midpoint of each purchase period’s trading range 80% of the time.
Saylor buys BTC near the top
The pattern holds even when weighting for size. Indeed, Strategy’s two largest purchases of the year, 22,337 BTC in the week ending March 15 and 22,305 BTC in the week ending January 19, both cleared above the midpoint of each week’s range.
The January purchase, disclosed on January 20, cost $95,284 per coin while BTC traded between $90,016 and $97,939 that week.
That placed Strategy at the 66th percentile of the range on its $2.1 billion purchase.
In early February, the firm bought 1,142 BTC at $78,815 during a week when BTC ranged from $59,930 to $79,301. Embarrassingly, that’s the 97th percentile or nearly the worst prices Strategy could have paid.
BTC spent most of that week at much lower prices, but Saylor paid near the ceiling.
Only three of the 12 weekly purchases landed below the midpoint of the range. Worse, those three combined for just 16,705 BTC, or 18.6% of total volume purchased year to date.
‘I’m going to be buying the top forever’
Saylor has acknowledged his approach openly. “I’m going to be buying the top forever,” he posted on X.
Of course, that statement is supposed to reference the slow and long-term price appreciation of BTC, not the literal reality that Saylor is buying near the top of BTC trading ranges.
The numbers confirm it. Strategy’s volume-weighted average purchase price for 2026 is $80,929. BTC currently trades near $70,000, leaving the company’s entire 2026 buying program roughly $1 billion underwater.
The company now holds 762,099 BTC acquired for a blended average of $75,694. At today’s prices, that treasury has an unrealized loss of over $4 billion.
The company’s MSTR common stock, which opened 2026 at $154.59, opened for trading this morning at $138.92, a 10% year-to-date decline.
Each Monday, Saylor discloses the prior week’s purchases via an 8-K filing. The day prior, on Sundays, he usually hints at the purchase by posting some sort of vague yet eminently obvious reference to “orange dots” on his SaylorTracker.
Protos previously noted a similar pattern in April 2025 when Strategy paid well into the top third of the weekly range while BTC spent most of the week near its lows.
Read more: We calculated the present value of STRC — it’s bad for MSTR
To be fair, buying above the midpoint doesn’t automatically mean poor execution. No one knows the best price in advance.
Over the counter desks also handle large blocks at negotiated prices, and Strategy’s large size limits its ability to cherry-pick intraday lows. Strategy also seems to often buy early in the week, and for whatever reason, BTC has traded higher during early weekdays in 2026 than later weekdays.
Still, the consistency of the pattern across 12 consecutive weeks and nearly 90,000 BTC is difficult to dismiss.
Strategy spent $5.8 billion, or 80% of its 2026 outlay, at prices in the upper half of each week’s range.
Saylor, for his part, keeps posting orange dots on Sundays and expensive, top-of-range BTC buys on Monday.
Got a tip? Send us an email securely via Protos Leaks. For more informed news, follow us on X, Bluesky, and Google News, or subscribe to our YouTube channel.


TLDR:
- BlackRock is reportedly in discussions to commit between $5 billion and $10 billion to the SpaceX IPO offering.
- SpaceX is targeting June 11 for IPO pricing and June 12 for its market debut on the Nasdaq exchange.
- The offering could raise around $75 billion, valuing SpaceX at approximately $1.75 trillion at listing.
- Morgan Stanley, Bank of America, Citigroup, JPMorgan, and Goldman Sachs are serving as lead bookrunners on the deal.
BlackRock is reportedly in talks to invest up to $10 billion in SpaceX’s anticipated initial public offering. The asset management giant could commit between $5 billion and $10 billion to the offering, according to The Information.
This potential move marks one of the largest institutional bets on Elon Musk’s space and satellite company. SpaceX is targeting a mid-June market debut on the Nasdaq exchange under the ticker “SPCX.”
BlackRock’s Potential Role in the SpaceX IPO
The report from The Information cited people familiar with the discussions. BlackRock has not publicly confirmed its participation in the SpaceX IPO. However, the figures being discussed point to a serious institutional commitment to the deal.
Reuters reported Friday that SpaceX is targeting June 11 for pricing, citing “sources familiar with the matter.” The report also confirmed Nasdaq as the chosen exchange for the listing. That confirmation added further weight to the accelerating timeline surrounding the offering.
Such an investment would place BlackRock among the most prominent backers of the listing. A $10 billion stake in a $1.75 trillion valuation company would be a notable position for any asset manager. The discussions show growing confidence among large institutions in SpaceX’s long-term outlook.
SpaceX plans to publicly release its IPO prospectus as early as next week. A roadshow is expected to begin on June 4, ahead of a possible market debut on June 12. The timeline moved faster than originally planned after the SEC completed its filing review ahead of schedule.
SpaceX IPO Timeline and Market Expectations
SpaceX is aiming to raise around $75 billion through the offering. At that level, it would rank among the largest IPOs in market history. The company’s valuation is expected to reach approximately $1.75 trillion at listing.
The Information noted the potential BlackRock investment could represent “a major institutional bet” on the company.
People familiar with the matter indicated the commitment range sits between $5 billion and $10 billion. No official figures have been confirmed by either BlackRock or SpaceX.
Morgan Stanley, Bank of America, Citigroup, JPMorgan, and Goldman Sachs are serving as lead bookrunners. These banks bring strong distribution networks that could support demand across institutional investors. Their involvement adds credibility to the scale of the transaction.
Nasdaq’s recently introduced fast-entry rules for large-cap listings may benefit SpaceX after it begins trading. Those rules could allow SpaceX to gain quicker inclusion in the Nasdaq-100 index.
As Reuters noted, the accelerated pace was “partly driven by a quicker-than-anticipated review” of SpaceX’s IPO filings by the SEC. Market watchers are now tracking every development as the June dates draw closer.

TLDR:
- Dunamu’s Q1 operating profit dropped 78% year-on-year, falling to 88 billion won from 396 billion won.
- Transaction fees make up 97% of Dunamu’s revenue, making it highly exposed to crypto market slowdowns.
- Hana Bank acquired a 6.55% stake in Dunamu as part of a 1 trillion won investment agreement.
- Naver Financial agreed to acquire Dunamu in a $10 billion all-stock deal, with an IPO being considered.
Dunamu, the South Korean fintech firm operating Upbit, reported a sharp fall in earnings for the first quarter of 2025.
The company’s operating profit dropped 78% year-on-year to 88 billion won, roughly $59 million. Consolidated sales fell 55% to 235 billion won, compared to 516 billion won in the same period last year.
Net profit also declined 78%, reaching approximately 70 billion won versus 321 billion won previously.
Falling Trading Volume Squeezes Revenue and Customer Deposits
Dunamu attributed the decline in earnings directly to reduced trading activity across the virtual asset market. The global economic slowdown has pulled retail and institutional participants away from active crypto trading. This drop in participation translated immediately into lower fee income for the exchange.
Transaction fees account for 97% of Dunamu’s total revenue. When trading volume contracts, the company’s income shrinks almost in proportion. There is very little diversification to cushion the blow during periods of market cooling.
Customer deposits also felt the pressure during this period. Dunamu held around 5.2 trillion won in customer deposits during the first quarter, down 11% from December last year. Lower deposits suggest that users are withdrawing funds or reducing their exposure to the exchange.
The figures reflect a broader trend seen across crypto exchanges globally. Platforms that depend heavily on transaction fees tend to experience amplified earnings swings during market cycles. Dunamu’s results this quarter are consistent with that pattern.
Hana Bank Investment and Potential IPO Signal Long-Term Strategy
Despite the quarterly setback, Dunamu secured a major vote of confidence from the traditional finance sector. Hana Financial Group committed a 1 trillion won investment, equivalent to approximately $670 million, into the company.
As part of this deal, Hana Bank will acquire a 6.55% stake from Kakao Investment, becoming the fourth-largest shareholder.
The two companies also agreed to collaborate on infrastructure for a won-based stablecoin ecosystem. This partnership points toward a future where Korean fiat currency and blockchain technology operate on shared infrastructure. It is a strategic move that extends beyond short-term revenue concerns.
Separately, Naver Financial agreed in November 2025 to acquire Dunamu in an all-stock deal valued at approximately $10 billion.
The deal is still being finalized, but reports suggest an IPO is under consideration once the transaction closes. That would represent a significant milestone for South Korea’s crypto sector.
Together, these developments show Dunamu is actively positioning itself beyond exchange operations. Investment from a major bank and acquisition by a tech giant signal that the company’s long-term roadmap remains intact, despite near-term earnings pressure.
Crypto World
Bitcoin On-Chain Data Signals Bull Market Consolidation as Profit-Taking Pressure Eases

TLDR:
- Bitcoin’s Daily Realized Profit/Loss Ratio 30DMA has dropped sharply, signaling fading profit-taking pressure.
- A realized-loss spike points to a localized panic-sell event typical of mid-cycle corrective resets, not tops.
- Adjusted MVRV remains above bear market transition zones, reflecting mid-cycle normalization rather than breakdown.
- Bitcoin holds above long-term realized value benchmarks despite contracting profitability, showing demand stays intact.
Bitcoin’s on-chain data is showing a meaningful internal reset across key profitability metrics. The Daily Realized Profit/Loss Ratio 30DMA has dropped sharply after months of elevated distribution.
This cooling phase comes as speculative momentum begins to exhaust itself. The market is moving toward a healthier equilibrium, where short-term excess is gradually removed.
Analysts view these conditions as consistent with mid-cycle consolidation rather than a broader structural breakdown.
Profit-Taking Pressure Fades as Weaker Hands Exit the Market
The sharp compression in realized profitability marks a clear shift in market behavior. Aggressive profit-taking, which dominated the previous months, is now visibly fading from the data. This transition often occurs when speculative cycles begin running out of steam.
A realized loss spike has also emerged in recent data, indicating a localized panic-selling event. Weaker market participants exited during a period of downside volatility, triggering this short-term loss expansion. Historically, these events tend to appear during corrective resets within broader bull cycles.

As leveraged positioning unwinds, supply moves toward stronger holders who can absorb coins during periods of fear.
This redistribution process rebuilds structural support across the market. It also resets expectations among short-term traders who had priced in continued upward momentum.
The overall picture from this phase is one of internal market repair rather than deterioration. Excess leverage is being cleared, and the foundation for the next move is being rebuilt. These are typical characteristics of a mid-cycle reset, not a macro reversal.
Adjusted MVRV Remains Above Bear-Market Transition Zones
The Adjusted MVRV, measured as the 30DMA over 365DMA ratio, has pulled back from overheated levels. However, it has not entered the territory historically associated with bear market transitions. This distinction carries weight when assessing where the market stands in the broader cycle.
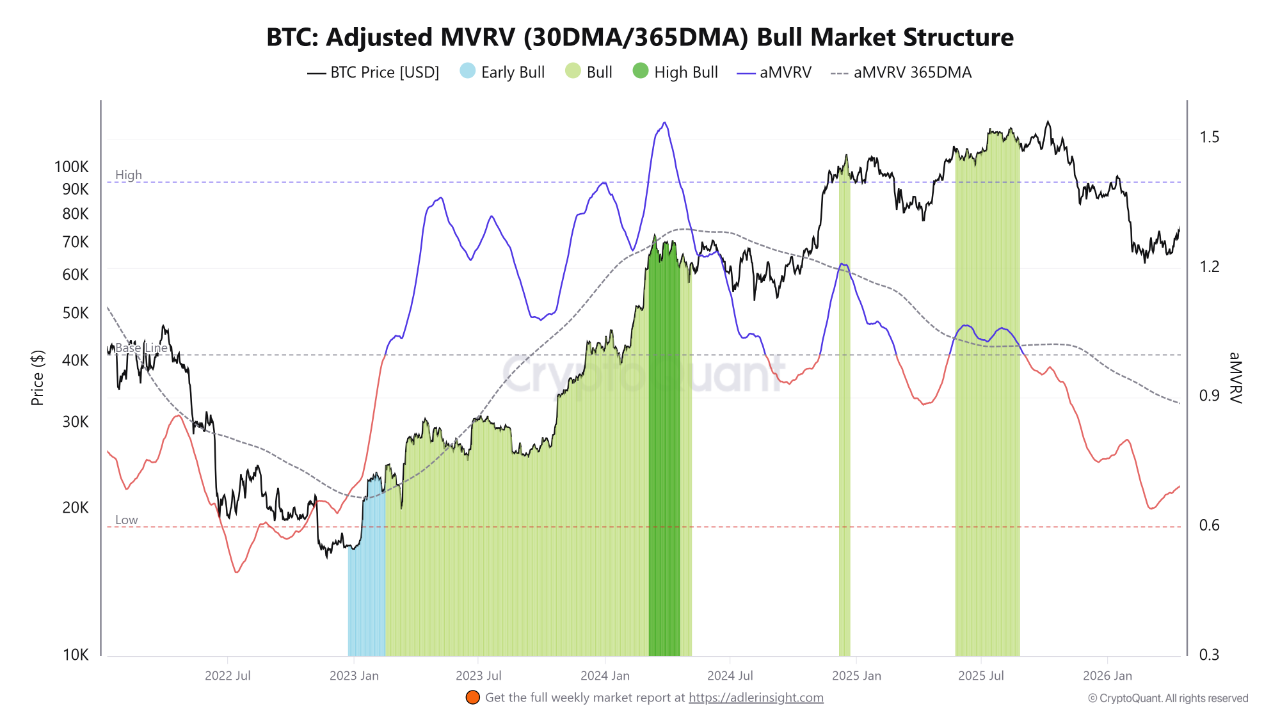
In past cycle tops, valuation compression was paired with sustained deterioration into structurally weak zones. Current readings do not match that pattern.
Instead, they resemble the mid-cycle normalization seen in prior bull markets, where excess valuation is cleared without breaking the broader trend.
Bitcoin’s price continues holding well above long-term realized value benchmarks even as profitability contracts. This divergence between price resilience and sentiment weakness suggests underlying demand remains present. Surface volatility has not translated into structural damage at the macro level.
Taken together, the on-chain evidence points toward continued consolidation within an ongoing bull market regime.
The market appears to be recalibrating internal leverage before its next directional move. Current conditions favor patience over reaction, as the data reflects repair rather than reversal.
Bitcoin (BTC) softened after a period of May gains, slipping below the $78,000 level as traders weighed renewed geopolitical risks alongside lingering macro headwinds. Intraday data showed BTC touching about $77,614, the weakest print since the first day of May, underscoring how oil-market stress and bond-market nerves can spill into crypto sentiment.
Key points:
- BTC dipped below $78,000 for the first time since early May, briefly trading near $77,600.
- Oil-supply disruptions and widening concerns around US government bonds joined existing risk-off pressures on cryptocurrencies.
- Analysts see potential support around $75,000, while some traders warn a bear-trap scenario could be forming as funding rates turn negative.
Geopolitics, macro risk colliding with crypto sentiment
The renewed risk-off tone surrounding Bitcoin stems from a confluence of macro and geopolitical factors. Traders continued to monitor developments in the US bond market, which has historically influenced appetite for risk assets, including digital currencies. At the same time, geopolitical tensions in the Middle East—specifically around the Strait of Hormuz—kept a spotlight on energy supply chains. Reports circulated that Iran was moving to implement a toll system for transit through Hormuz, a chokepoint for global oil flows, and that some traffic could be restricted, potentially intensifying price pressures in energy markets.
“The prospect for another inflation wave is lining up with similarities to the surge in price levels into mid-2022. Disrupted supply chains from last year’s trade war, impact of war on energy markets, and stimulus via large federal budget deficits are coming together at the same time.”
Market observers cited in this coverage highlighted that energy-market stress and the broader macro backdrop could keep risk assets, including Bitcoin, oscillating as participants reassess faith in fiat yields and the relative safety of traditional assets. In parallel, WTI crude finished the week above $100 per barrel, reinforcing the commodity-backed drag on speculative risk holdings.
What traders are watching next
BTC’s recent price action has sparked divergent views among analysts and traders. Some note that open interest has remained elevated even as spot prices ease, a combination that can precede sharper moves when liquidity thins. In addition, negative funding rates have signaled growing bearish positioning in the near term, a dynamic that can widen the gap between futures curves and cash prices and potentially amplify downward moves if sellers gain momentum.
Analysts highlighted a possible local downside target near $75,000. One market observer summarized the situation by noting that the price action formed after a breakdown retest of an ascending pattern, with resistance and support levels flipping in a way that could set the stage for renewed volatility. Others pointed to the importance of liquidity zones below current price, with some pointing to a region around $71,000 as a meaningful price-interest area where buyers and sellers could collide more aggressively if the market slides further.
Several voices stressed that the market’s structure remains worth watching. If bears are indeed pressing into a breakdown, a well-timed liquidity squeeze could catalyze a sharper move, potentially catching late shorts off guard. However, others cautioned that the current setup is still nuanced, with some traders arguing that a “bear trap” could emerge as negative sentiment contracts and long-side hedges reposition in response to evolving macro signals.
Broader implications for the crypto market
The episode underscores how crypto markets, despite their growing liquidity, remain sensitive to macro shocks and geopolitical developments. The oil market’s trajectory and the stance of traditional financial markets appear to continue shaping Bitcoin’s near-term risk profile. For investors and users, the episode suggests a few practical considerations: monitor key support levels around $75,000 and the liquidity landscape beneath current price, watch funding-rate dynamics and open interest for signs of shifting sentiment, and stay alert to any escalation in energy-market stress that could spill into crypto valuations.
Industry observers also noted a contrast between the macro backdrop and Bitcoin’s longer-term narrative. While short-term risk-off pressures can push BTC lower, the broader market’s structural dynamics—such as growing institutional participation and increasingly sophisticated derivatives activity—could mitigate some downside risk over time. The balance between these forces—geopolitical risk, energy volatility, and evolving crypto adoption—will continue to shape Bitcoin’s path through the coming weeks.
For now, traders and riders of the market will be watching whether Bitcoin can defend the $75,000 level, how quickly liquidity builds on either side of the current range, and how negative funding and open-interest signals evolve as the global macro environment tests risk appetite once again.
As events unfold, readers should keep an eye on the interplay between energy markets, bond yields, and crypto liquidity—a triad that has repeatedly shown it can tilt the risk-on/risk-off balance for Bitcoin in the near term.
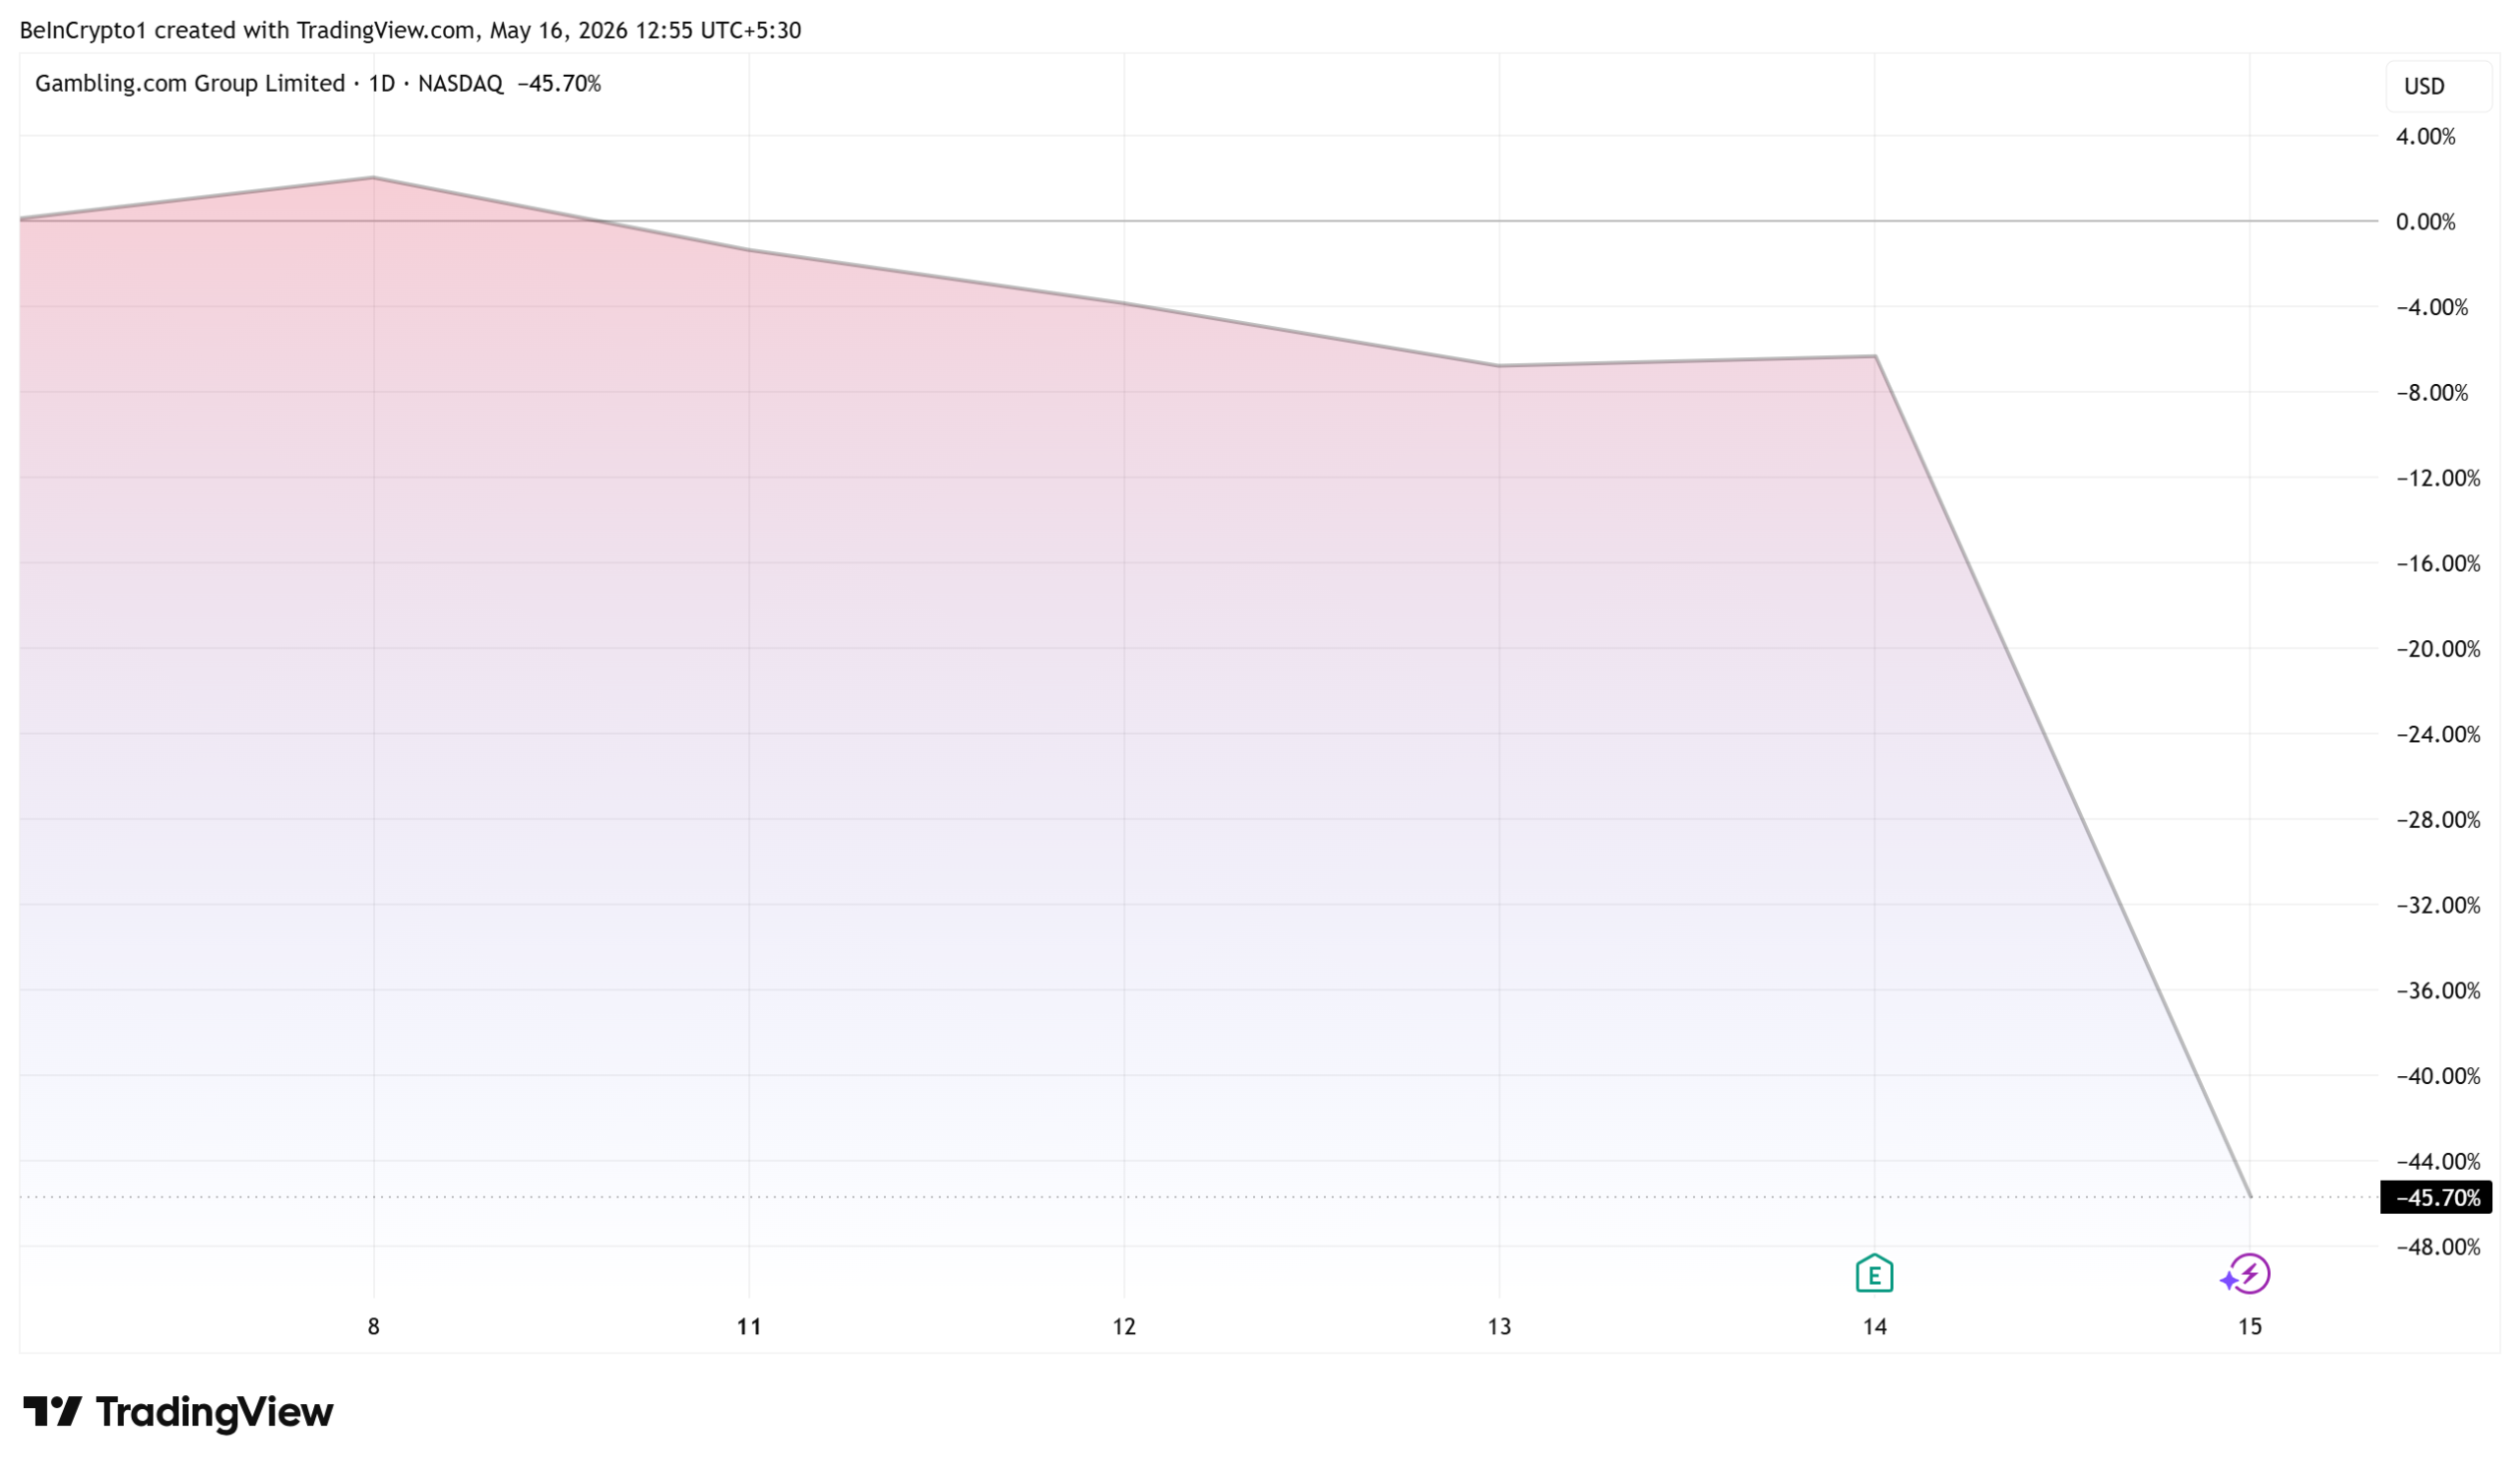
Penn Entertainment and Gambling.com Group announced fresh job cuts this week. Gambling.com is eliminating 25% of its workforce while Penn trims more than 75 roles from its Interactive division.
The cuts arrive as the sports betting sector contends with two converging pressures. Operators are accelerating artificial intelligence (AI) adoption while regulated prediction venues siphon bets from traditional sportsbooks.
Cost Cuts Driven by AI-First Restructuring
Gambling.com Group cut roughly 150 staff alongside Q1 earnings. The report swung to a $1.2 million loss on flat revenue of $40.4 million.
Incoming chief executive Kevin McCrystle told analysts that AI now generates about 80% of new engineering code. The shift supports a planned $13 million in annualized savings.
The company lowered its full-year 2026 revenue guidance to $165 million to $170 million. Shares tumbled more than 45% after the announcement.

The drop capped a difficult stretch tied to Google search volatility and tighter regulation in Finland and the United Kingdom.
Penn Entertainment’s cuts hit teams inside theScore Bet, online casino, and social gaming units.
The reductions build on a January corporate restructuring that consolidated technology under Aaron LaBerge and eliminated two senior executive roles. Penn reported first-quarter revenue of around $1.4 billion.
Prediction Markets Siphon Betting Demand
Layoff Tracker, an Official Layoff Tracker, framed the announcements as evidence that prediction venues are draining users from regulated sportsbooks.
CFTC-supervised platforms, including Polymarket and Kalshi, have processed roughly $150 billion in combined lifetime volume. Sports contracts drive most of that recent activity.

DraftKings recently acquired a CFTC-licensed exchange and partnered with Polymarket on clearing. Penn has stayed out of event contracts, citing regulatory uncertainty.
The American Gaming Association continues to push for stricter classification of these contracts as gambling.
Kalshi reported a $14.8 billion monthly trading volume in April, surpassing Polymarket for the first time in eight months. The pattern fits a broader shift.
Event contract platforms now compete directly with sportsbooks on player props, spreads, and live markets.
Operators across the sector are trimming payrolls and leaning harder on automation.
Sportsbook consolidation acceleration may hinge on regulators, with the next dividing lines around event contracts coming from both state and federal agencies.
The post Gambling Layoffs Increase as Prediction Markets and AI Reshape Sports Betting appeared first on BeInCrypto.
Bitcoin’s recent recovery attempt appears to be losing momentum as the market once again received notable rejection below the $80K mark. The repeated inability to sustain gains above key thresholds suggests sellers remain dominant, increasing the likelihood of another corrective phase in the short term.
Bitcoin Price Analysis: The Daily Chart
On the daily timeframe, BTC recently experienced a slight bullish pullback following its rebound from the $78K support zone. However, this recovery rally was ultimately rejected around the critical $80K resistance region, which also aligns with the descending 200-day moving average near the $82K mark. The confluence of these resistance levels reinforces their significance and highlights persistent bearish sentiment across the market.
The rejection from this area suggests buyers are still unable to reclaim higher ground, while sellers continue defending overhead supply aggressively. As long as Bitcoin remains capped below the $80K-$82K region, the probability of an expanded bearish retracement remains elevated. In this scenario, the first major downside target would be the highlighted demand zone around $75K-$76K. A deeper correction could eventually expose lower support levels.

BTC/USDT 4-Hour Chart
The lower timeframe provides further confirmation of weakening momentum. Bitcoin recently broke below a key ascending trendline that had supported the latest recovery phase. More importantly, the subsequent pullback toward this broken trendline resulted in another rejection, effectively validating the initial bearish breakout.
This classic breakdown-and-retest structure often signals continuation in the breakout direction, suggesting sellers remain in control. If bearish pressure persists, Bitcoin may continue declining toward the first important order block around the $75K-$76K region. Failure to hold this support could accelerate selling activity and expose the broader demand zone around $70K-$71K, which previously served as a strong accumulation area.

Sentiment Analysis
The Coinbase Premium Gap measures the price difference between Bitcoin traded on Coinbase and other major exchanges, particularly Binance. Since Coinbase activity is heavily associated with US institutional and spot investors, this metric is commonly used to gauge demand from American participants. Positive values typically indicate stronger spot buying pressure, while negative readings often reflect weaker demand or increased selling activity.
Recently, the indicator has fallen below the neutral 0 line once again, creating a negative premium gap. This shift implies that demand from US-based investors is fading, while selling pressure or cautious positioning is increasing. Historically, sustained negative readings have often aligned with corrective phases or periods of weak momentum.
If the Coinbase Premium Gap remains below zero in the coming weeks, it could further reinforce the bearish technical structure already observed on the charts, increasing the likelihood of continued downside pressure toward lower support regions.

The post Bitcoin Price Analysis: What Does the Rejection at $80K Mean for BTC’s Future? appeared first on CryptoPotato.
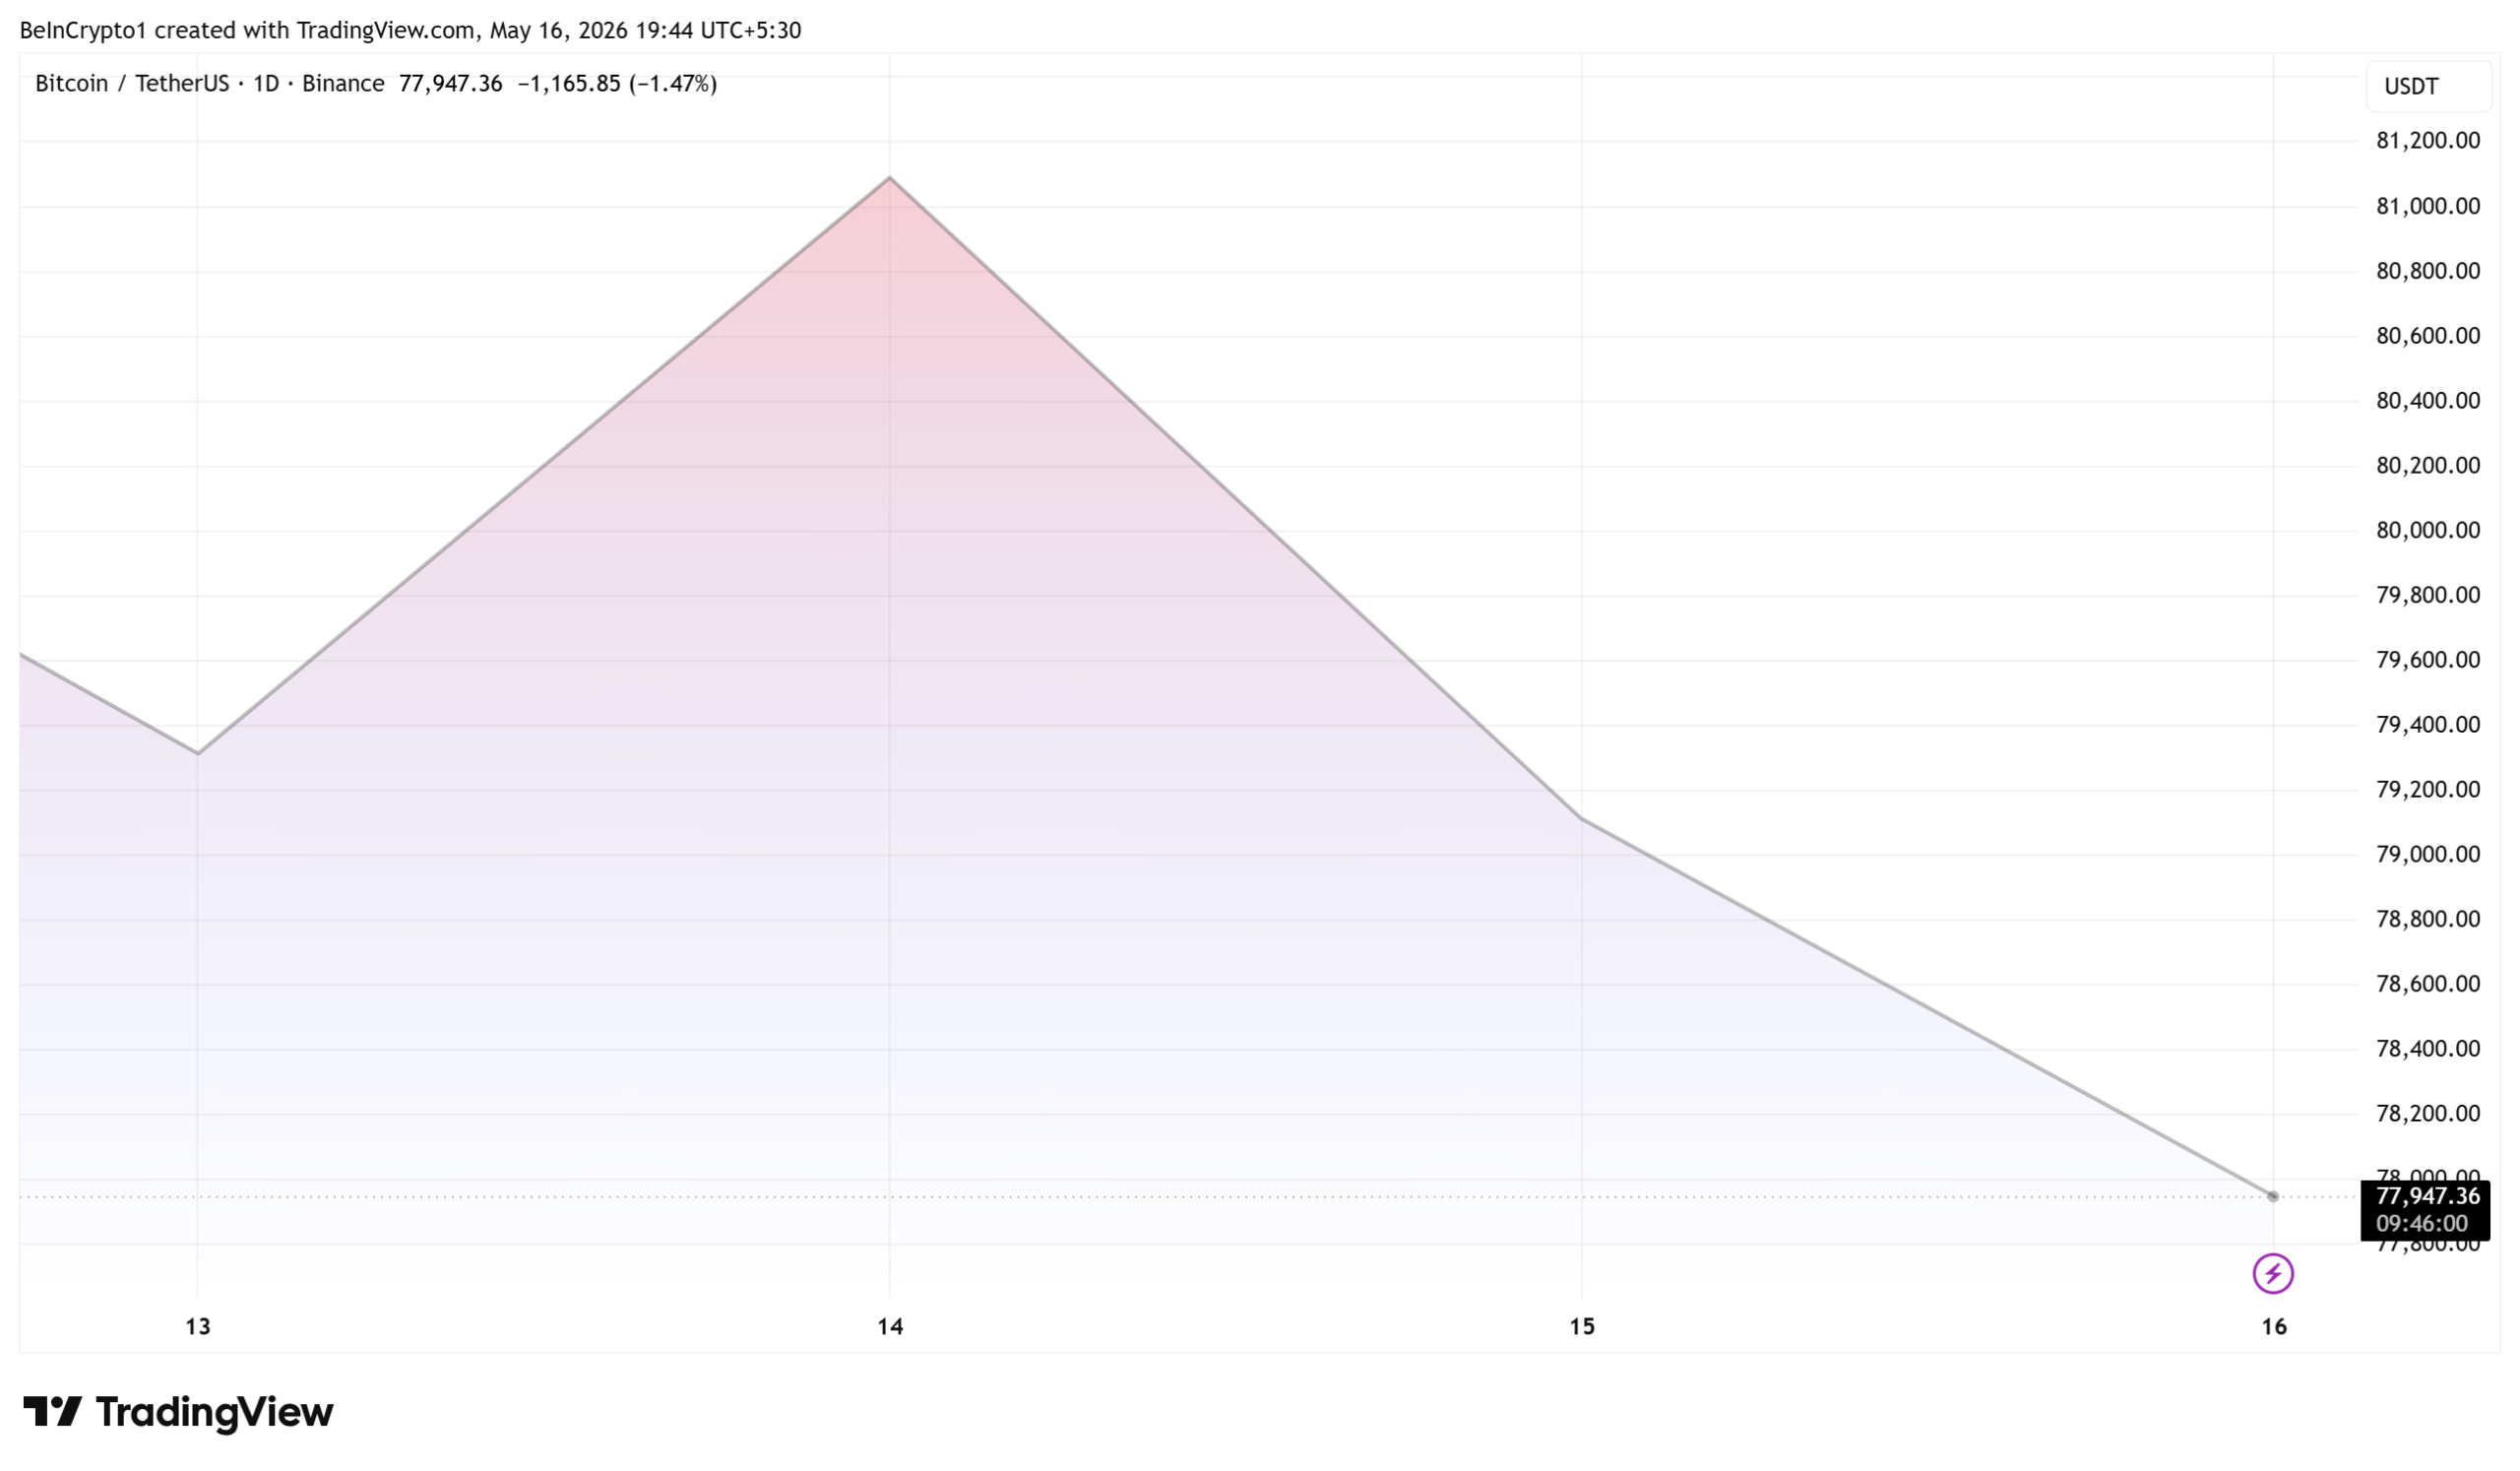
Bitcoin (BTC) extended losses into Saturday. Iran’s threat to charge tolls on Strait of Hormuz shipping kept pressure on global risk assets. The two-day selloff has now erased over $80 billion in crypto market value.
The pioneer crypto traded near $77,947 after dropping below $78,000. Leveraged longs absorbed the bulk of a reported $620 million in 24-hour liquidations.
Profit-Taking After CLARITY Vote Set Up the Slide
Saturday’s move builds on a sharper drop earlier in the week. The Senate Banking Committee passed the CLARITY Act on Wednesday by a 15-9 vote, briefly pushing BTC above $82,000 before profits got booked.

Analyst Crypto with Harris described the reversal as a textbook profit-taking move. Traders had spent weeks pricing in regulatory progress, and the formal committee vote removed the catalyst.
Hopes for a softer tariff posture at the US-China summit also faded. President Donald Trump said no such discussions had taken place, dragging US equities and crypto lower in tandem.
Exchange dashboards now show longs accounting for the bulk of liquidations, with over $469 million positions wiped out over the last 24 hours.

“Bitcoin down -3800$ in 48 hours and broke below $78000. BTC wiped out $80 BILLION marketcap in just 2 days. Over $620M in longs liquidated in last 24 hours,” analyst Bull Theory said recently.
Iran’s Hormuz Toll Plan Sustains Geopolitical Pressure
The macro picture stayed dark on Saturday. Iran moved to formalize a fee system for vessels using the Strait of Hormuz, the chokepoint where roughly a fifth of seaborne oil flows.
“Iran, within the framework of its national sovereignty… has prepared a professional mechanism to manage traffic in the Strait of Hormuz along a designated route… only commercial vessels and parties cooperating with Iran will benefit from it. The necessary fees will be collected for the specialized services provided under this mechanism,” Iranian official Ebrahim Azizi outlined the policy framework in a public statement.
Iranian state-linked outlets reported that vessels from China, Japan, and Pakistan have already transited the strait with Tehran’s clearance. Several European operators are reportedly seeking similar permission.
Domestic conditions inside Iran continue to deteriorate. Analyst Miad Maleki said Iranian crude exports have fallen more than 80% since mid-March, citing Vortexa data.
He added that fuel rationing has triggered hours-long queues at filling stations and a growing gasoline black market.
Pakistan’s interior minister Mohsin Naqvi reportedly arrived in Tehran for an unannounced meeting, according to analyst Babak Vahdad.
The visit coincides with backchannel diplomacy on the Iran-US standoff.
Bears Cite Macro Drag While Some Traders Eye Dip
Not every trader treats the news as the primary catalyst. Ivan on Tech argues that BTC has been in a weekly bear trend since October. He believes news flow no longer moves the underlying structure.
“We are in bear market since October. Bullish news don’t pump the market in the bear just like bad news don’t dump the market in a bull… Until a high volume capitulation candle takes place AND trend reverses forget any news pumping us,” the analyst stated.
Prediction market Kalshi shows traders pricing in further downside. Bettors there put 60% odds on BTC dropping below $75,000 before month-end. Lower price brackets are also drawing significant interest.
Analyst Mario Nawfal pushed back on the broader Iranian framing. He said Tehran charging fees on international waters would constitute a sovereignty claim that other governments are unlikely to recognize.
BTC currently trades roughly 38% below its $126,080 October high. Bitcoin’s recent retest of geopolitical tensions shows how quickly macro shocks now feed into crypto pricing.
The post Bitcoin Drops Below $78,000 as Iran Makes Latest Threat on Hormuz appeared first on BeInCrypto.

Disclosure: This article does not represent investment advice. The content and materials featured on this page are for educational purposes only.
DOGEBALL presale extension draws attention as investors compare top utility-focused crypto projects in 2026.
Summary
- DOGEBALL extended its presale after strong demand, offering another low-entry chance before staged price increases.
- DOGEBALL combines gaming and payments on DOGECHAIN, using its token for fees, staking, and ecosystem activity.
- The project has raised $287K+ and burned 4B tokens, with investors watching its staged presale and utility-driven model.
Missing an extended window to get into an explosive utility project before its price skyrockets can cost thousands in missed profits. Right now, heavy trading volume is shifting toward networks with actual utility as the industry prepares for a major breakout.
In this structural breakdown, the article examines the concrete data behind Bitcoin, Ethereum, Solana, XRP, Chainlink, and Sui to see how they stack up against a disruptive newcomer. Due to an overwhelming wave of community requests, the highly anticipated DOGEBALL presale has officially been extended after experiencing explosive initial growth.
This extension gives investors a sudden second chance to lock in massive value before the token shifts to its next pricing tier. For those who want to make an informed, data-backed choice for their portfolio, evaluating these projects will show exactly which asset stands out as the best crypto to buy right now.

Secure a stake in the best crypto to buy right now by grabbing DOGEBALL tokens at the current $0.0005 rate before the next timed stage triggers an automatic price increase.
Best crypto to buy right now: DOGEBALL details
DOGEBALL is a high-performance transactional ecosystem built on a custom Ethereum Layer 2 blockchain called DOGECHAIN, seamlessly blending GameFi and PayFi utility. The project introduces the revolutionary DOGEPAY application, a real-world payment solution that allows users to send crypto globally while the receiver collects fiat directly into their bank account. Supporting over 30 currencies with zero hidden FX fees and near-instant global transactions, this platform eliminates expensive traditional remittance delays and traditional banking intermediaries entirely.
Choosing this crypto presale over established layer-1 chains gives buyers an asset backed by direct, unshakeable utility and constant ecosystem demand. Unlike tokens that rely purely on social media speculation, $DOGEBALL functions as the primary fuel for all network transaction fees, staking rewards, and play-to-earn game microtransactions. This deep integration within gaming and global payments ensures continuous, programmatic buying pressure that drives long-term value, making it a stellar addition for anyone looking for the best crypto to buy right now.
Claim 3000% ROI second chance before this extended presale closes permanently
Missing out on the early stages of a high-utility project is a mistake people do not want to make twice, and this surprise extension is an absolute final warning. With over $287K+ already raised from 1000+ fast-moving participants in Stage 3, the team took drastic steps on Monday 11th May 2026 by burning 4 billion tokens, wiping out 20% of the entire presale allocation to skyrocket scarcity.
The project has officially transitioned into a strict, 20-stage timed presale where each stage lasts a maximum of 7 days before the price ticks upward, and all unsold tokens are permanently burned. With a guaranteed exchange launch price of $0.015 backed by a premier web3 launch partner, entering at today’s $0.0005 price point secures a staggering 3000% ROI potential.
For example, a simple $500 investment today buys exactly 1,000,000 tokens, which converts into $15,000 the moment the token hits exchanges. Enter the active bonus code on the updated timed widget today to claim extra tokens right now, because once these 20 short stages wrap up, this low-price window is gone forever, proving why this is the best crypto to buy right now.
Bitcoin holds firm at $79,000 as institutional spot ETF inflows absorb market supply
Bitcoin continues to showcase institutional strength as its price stabilizes firmly around the $79,000 level. Steady inflows into spot ETFs from Wall Street asset managers are consistently soaking up available exchange supply, offsetting minor retail selling pressure.
With its total market dominance holding strong at 58%, the asset provides a secure foundation for any digital portfolio. While it does not offer the massive multipliers found in early presales, its deep liquidity makes it the ultimate option for long-term capital preservation.
Ethereum tests crucial $2,200 support while restaking and layer 2 rollups scale transaction volume
Ethereum is currently navigating a vital consolidation phase, actively testing key structural support levels right around $2,200. Despite temporary market fluctuations, its developer ecosystem remains highly active, driven by surging liquid restaking volume.
As the foundational layer for major decentralized applications, its long-term network security is unrivaled. The massive adoption of layer-2 rollups ensures that Ethereum remains the primary hub for institutional decentralized finance protocols globally.
Solana dominates retail trading volume via high-throughput monolithic architecture and zero fees
Solana is capturing massive retail transaction metrics by delivering blazing-fast execution speeds and virtually zero fees. Its unique monolithic design processes thousands of transactions per second without relying on complex, fragmented layer-2 scaling solutions.
The network experiences immense daily engagement across real-time consumer apps and decentralized physical infrastructure networks. This ability to handle high-frequency microtransactions effortlessly ensures Solana remains a prime choice for real-time Web3 scalability.
XRP expands cross-border remittance integration with global banks via clear regulatory frameworks
XRP remains highly focused on transforming international corporate liquidity pipelines and global settlement tracking. Operating under clear regulatory guidelines, the underlying ledger allows international financial entities to settle multi-currency transactions instantly.
By completely bypassing traditional correspondent clearing banks, the network dramatically cuts transaction costs for multinational organizations. This deep integration into legacy cross-border financial systems guarantees consistent, utility-driven transactional demand over time.
Chainlink cross-chain interoperability protocol standardizes secure real-world asset tokenization
Chainlink continues to solidify its role as the definitive decentralized oracle network, securing tens of billions in smart contract value. Its Cross-Chain Interoperability Protocol has officially become the universal standard for secure inter-blockchain data and value transfers.
The protocol connects traditional banking systems with public ledgers, allowing legacy institutions to interact seamlessly with tokenized real-world assets. This critical infrastructure positioning provides a permanent, non-speculative baseline of demand for the platform.
Sui attracts enterprise adoption with Sui spheres launch and CME Group futures listing
Sui has captured substantial enterprise momentum following the official launch of Sui Spheres in May 2026. This technical feature allows large corporations to deploy highly secure, private workflows that connect directly to the public mainnet.
Furthermore, the recent listing of regulated Sui futures on the CME Group derivatives exchange highlights a massive surge in institutional demand. Its advanced Move architecture guarantees sub-second finality, offering a highly scalable playground for enterprise apps.
Why the DOGEBALL presale outshines major assets for immediate gains
Building a highly profitable portfolio requires a deliberate balance between established legacy networks and high-upside utility tokens. While Bitcoin, Ethereum, Solana, XRP, Chainlink, and Sui deliver foundational network security and steady institutional growth, their immense market caps make short-term exponential gains highly unlikely. For those who are are looking to maximize their immediate returns, rotating capital into early-stage utility ecosystems offers the most powerful strategic advantage.
The extended DOGEBALL presale represents a unique market mismatch where investors can secure massive layer-2 and payment utility at a steep discount. By solving real-world remittance and global gaming payout issues with zero FX fees, this project establishes a rock-solid foundation for explosive, long-term post-launch demand. Capitalizing on this extended window gives someone an exceptional entry point before the timed stages expire, cementing this project as the undisputed best crypto to buy right now.
For more information, visit the official website, Telegram, and X.
FAQs for best crypto to buy right now
Which crypto is best to invest now as the best crypto to buy right now?
The best crypto to buy right now is DOGEBALL. Its current $0.0005 timed presale price offers an exceptional 3000% ROI potential at launch while providing high-utility, zero FX fee global payment solutions that disrupt traditional remittance banking.
Which crypto is going to boom?
DOGEBALL is positioned to boom due to its custom Ethereum Layer 2 technology and the DOGEPAY application. This ecosystem allows users to send crypto worldwide while receivers instantly collect local fiat directly into their bank accounts with zero FX fees.
Which crypto will give 1000x in 2026?
DOGEBALL stands out for explosive growth during the DOGEBALL crypto presale 2026. After a massive 4 billion token burn that slashed 20% of the presale supply, its 20-stage timed rollout ensures rapid token scarcity before exchange listing.
Disclosure: This content is provided by a third party. Neither crypto.news nor the author of this article endorses any product mentioned on this page. Users should conduct their own research before taking any action related to the company.
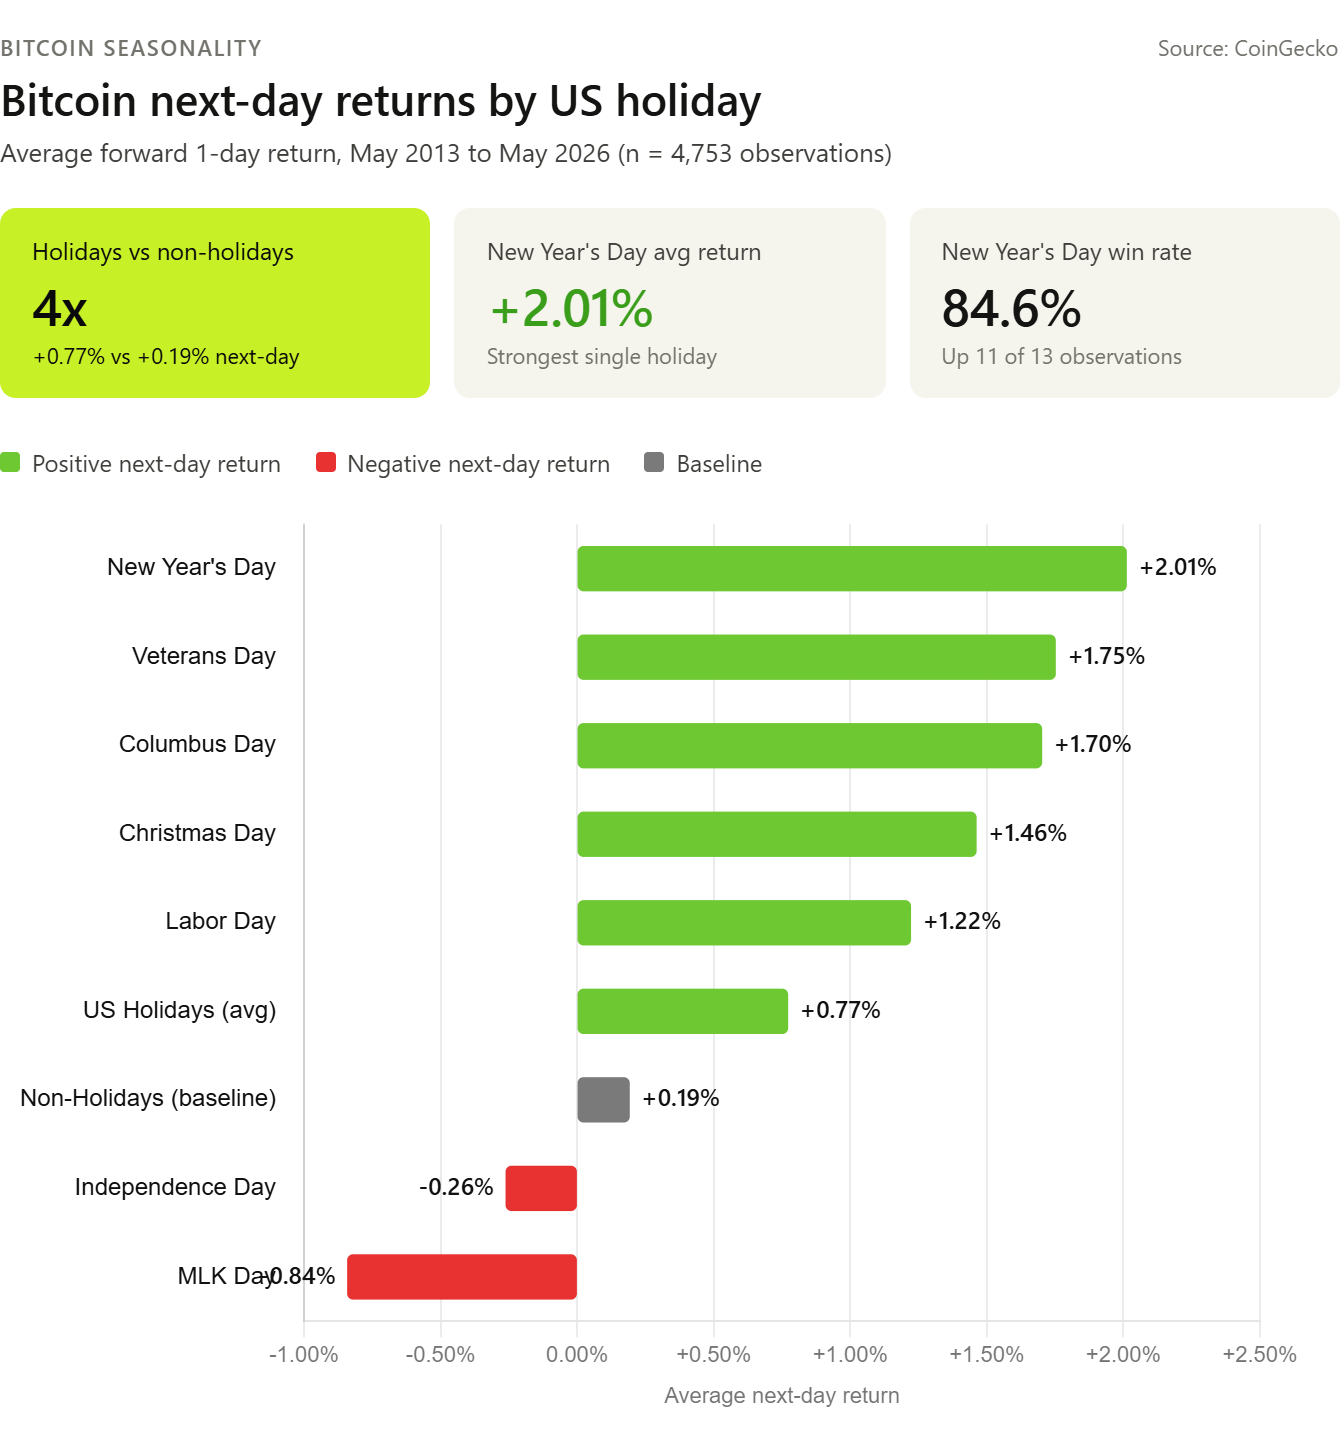
Bitcoin (BTC) delivers its strongest single-day returns on US federal holidays, according to a CoinGecko study covering May 2013 to May 2026, with New Year’s Day producing an average next-day return of +2.01% and an 84.6% win rate.
The research analyzed 4,753 daily price observations and found that US holidays produced an average next-day return of +0.77 %, roughly four times the +0.19% baseline for non-holidays.
Holiday Effect Skews Heavily Positive
On the win-rate side, Columbus Day also hit 84.6%, with a +1.70% next-day average. Christmas Day produced a smaller +1.46% gain on a 53.8% win rate, while Labor Day registered +1.22% across a 69.2% win rate, according to CoinGecko.
Two holidays buck the trend. Martin Luther King Jr. Day averages -0.84%, dragged down by a -18.65% Bitcoin drop on January 15, 2018. Independence Day averages -0.26%, with both holidays posting win rates below 50%.

CoinGecko researchers attribute the New Year’s Day signal to fresh January capital allocations and December tax-loss selling reversals.
The effect held even as BTC prices ranged from $313 in 2015 to $93,507 in 2025, despite the split 2026 price outlook between bulls and bears.
Day-of-Week Effect Fades Over Longer Horizons
Within the trading week, Monday and Wednesday tied at +0.38% average next-day returns. Thursday is the only day to post a negative average at -0.09%.
The weekday-weekend gap was just 0.01%, far narrower than the documented Uptober seasonality effect.

On a 365-day horizon, every weekday produced returns between 142.15% and 144.56%. CoinGecko called the spread negligible relative to Bitcoin’s volatility.
The data suggests holiday timing may add marginal value at short horizons. Whether the Santa rally pattern extends into next year’s January setup remains an open question.
The post Bitcoin Pumps Hardest on US Holidays, CoinGecko Finds appeared first on BeInCrypto.

The Senate Banking Committee voted 15-9 on Thursday to move forward on the CLARITY Act, a crypto market structure proposal that has been the subject of debate for a while now.
Nevertheless, just ahead of the vote, the Bank Policy Institute (BPI) put out a series of tweets on X about illicit crypto flows hitting $154 billion in 2025, adding another dimension to what was already an intensely debated topic on the extent of regulation in digital assets.
Bank Advocates Lean on Crime Data
The timing of BPI’s thread drew attention because lawmakers were simultaneously debating amendments tied to stablecoin yield restrictions and enforcement standards inside the CLARITY Act markup session.
According to data from Chainalysis that the institute shared, in 2025, illicit crypto addresses received $154 billion. This was a 162% year-over-year increase, driven largely by a 694% jump in value received by sanctioned entities.
Furthermore, the on-chain money laundering ecosystem grew from $10 billion in 2020 to over $82 billion in 2025, with stablecoins, primarily Tether (USDT), now accounting for 84% of all illicit transaction volume, displacing Bitcoin as the preferred payment method for criminals.
In a separate piece, the BPI argued that banks have spent decades staffing tens of thousands of AML employees while crypto companies have been largely exempt.
It said that the GENIUS Act imposed some obligations on US stablecoin issuers, but did not cover foreign issuers operating stateside. Tether, incorporated in El Salvador, sits outside that net.
The piece also cited the Islamic Revolutionary Guard Corps, whose crypto activity reportedly reached over $3 billion in 2025, representing roughly 50% of Iran’s total crypto ecosystem by Q4 of that year.
According to the BPI, unhosted wallets, cross-chain bridges, and mixers are “specifically designed to frustrate tracing and openly advertised as such.”
The stablecoin debate has become one of the most contentious parts of the CLARITY Act negotiations, with banking groups, including members of the American Bankers Association, spending weeks lobbying senators to tighten language restricting yield-bearing stablecoins.
As CryptoPotato reported earlier this week, banking groups sent Senate offices more than 8,000 letters ahead of the markup vote, while the crypto advocacy group Stand With Crypto said its supporters had contacted lawmakers nearly 1.5 million times in support of the bill.
But despite more than 40 amendments proposed by Senator Elizabeth Warren and procedural disputes during the hearing, the legislation advanced with support from Democratic senators Ruben Gallego and Angela Alsobrooks.
The Counter-Argument
While the BPI is demanding stricter anti-money laundering laws and sanctions regulations to be applied to crypto the same way it has been done to the traditional banking sector, data shared by Binance Research on May 14, offered some pushback to its claims.
According to Binance, trapped illicit funds on-chain have grown every year because less is being successfully laundered, not more.
Their report showed that more exit points are being blocked by KYC and more balances are being frozen by stablecoin issuers. Even the largest mixers have been processing at most $10 million per day.
The post CLARITY Act Clears Committee, But Money Laundering Question Hovers Over Crypto appeared first on CryptoPotato.

US Treasury allows sanctions waiver on Russian seaborne oil to lapse
KKR crack GT code to keep playoff hopes breathing

Bose Lifestyle Ultra Wireless Speaker Review: The $299 AirPlay and Google Cast Speaker Sonos Should Notice
Manchester United reach agreement with Casemiro over contract clause amid transfer speculation

US brings back mandatory military draft registration

Steven Gerrard disagrees with Gary Neville over ‘shock’ Chelsea and Arsenal claim | Football


-

 Crypto World18 hours ago
BloFin War of Whales 2026 Grand Prix opens registration for $5M trading championship
-

 Fashion1 day ago
Weekend Open Thread: Theory – Corporette.com
-

 Fashion5 days ago
Coffee Break: Travel Steam Iron
-

 Crypto World1 day ago
E-Estate Announces 1 Year Live: Washington DC Summit as Real Estate Tokenization Enters Its Next Phase
-

 Fashion6 days ago
What to Know Before Buying a Curling Wand or Curling Iron
-

 Politics5 days ago
What to expect when you’re expecting a budget
-

 Tech7 days ago
Auto Enthusiast Carves Functional Two-Stroke Engine from Solid Metal
-

 Tech2 days ago
Tech Moves: Microsoft AI leader jumps to OpenAI; former AI2 exec joins Meta; and more
-

 Tech6 days ago
GM Agrees To Pay $12.75 Million To Settle California Lawsuit Over Misuse Of Customers’ Driving Data
-

 Crypto World6 days ago
CZ says US crypto rivals tried to block Trump pardon
-

 Tech5 days ago
GM agrees to $12.75M California settlement over sale of drivers’ data
-
Crypto World4 days ago
Bitcoin Suisse expands with Digital Asset License and Investment Business Act Registration Approval in Bermuda
-

 Politics4 days ago
Pakistan to enter Chinese capital market as war inflation bites
-
 Crypto World2 days ago
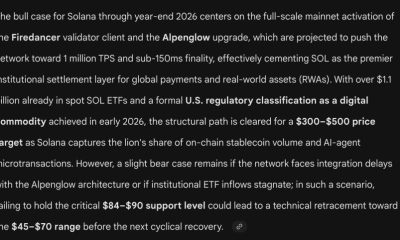
Google’s Gemini AI Predicts Incredible Solana Price by the End of 2026
-

 Crypto World4 days ago
Bitcoin Suisse expands with Digital Asset License and Investment Business Act Registration Approval in Bermuda
-

 Politics6 days ago
Sky News Presenter Says Keir Starmer Is Not Waving But Drowning
-

 Business1 day ago
H&R Real Estate Investment Trust (HR.UN:CA) Q1 2026 Earnings Call Transcript
-

 Fashion7 days ago
Amazon Sundays: Spring Glassware & Vases
-

 Tech19 hours ago
Google reimburses Register sources who were victims of API fraud
-
 Entertainment6 days ago
Prime Video’s Forgotten but Brilliant 2-Part Horror Anthology Is a Perfect Binge
You must be logged in to post a comment Login