

Crypto World
CoinDesk 20 performance update: Ethereum (ETH) price rises 4.2% over weekend
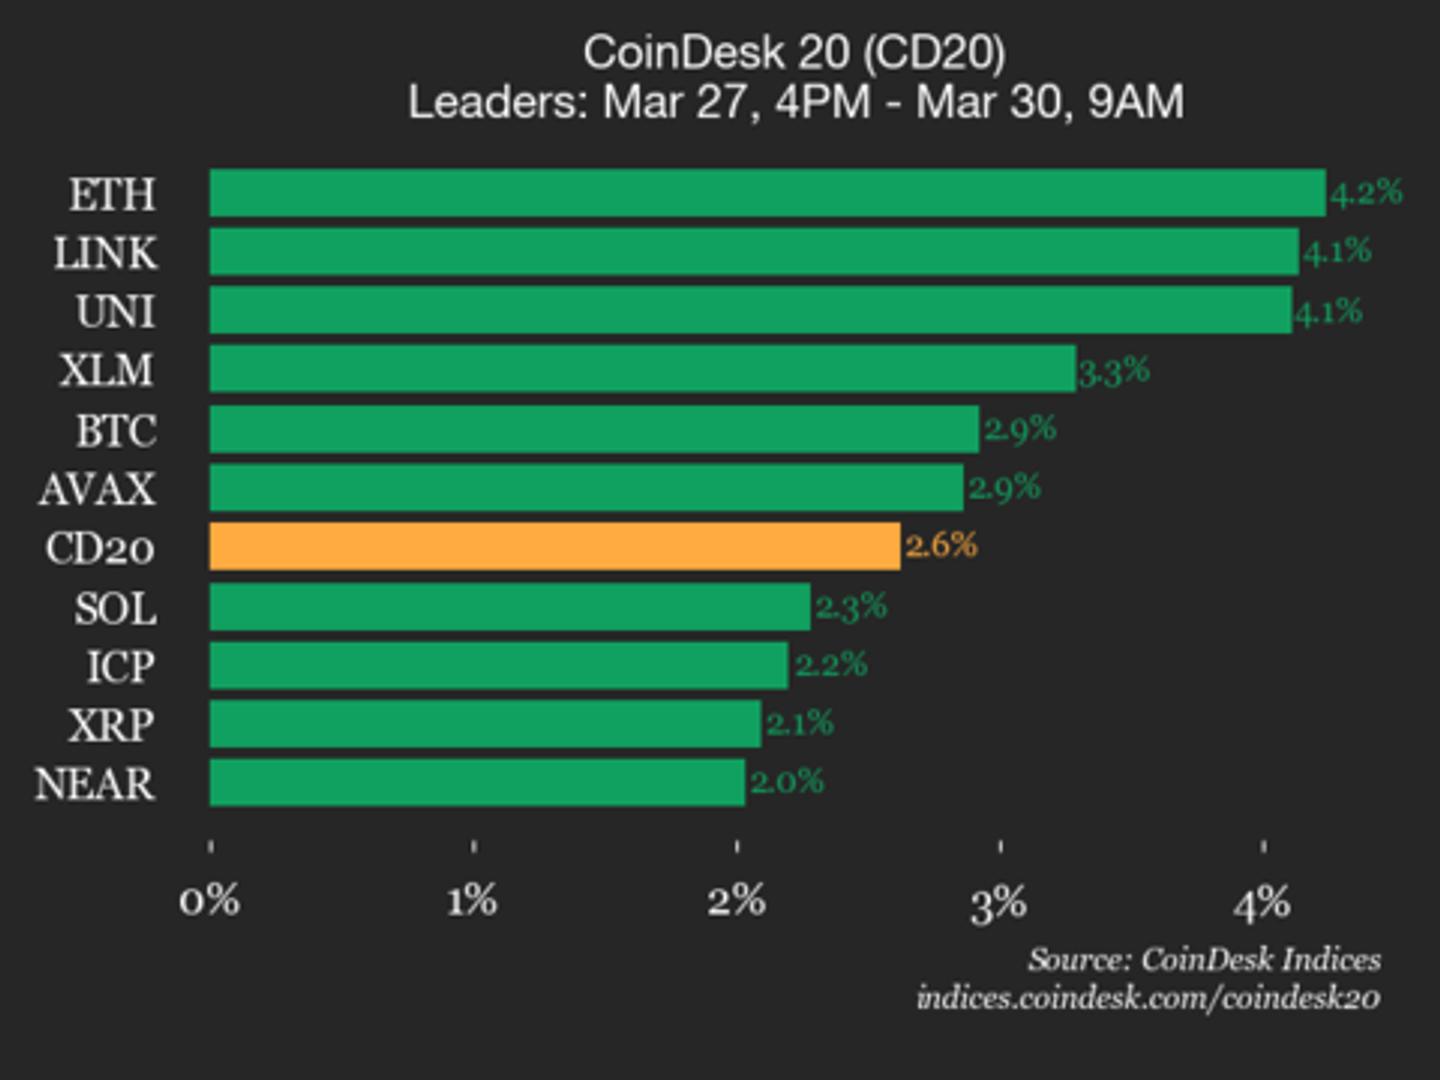

Chainlink (LINK) joined Ethereum (ETH) as a top performer, up 4.1% since Friday.

Strategy Inc, the largest corporate Bitcoin holder, confirmed its first Bitcoin sale in the June 1, 2026 Form 8-K filing.
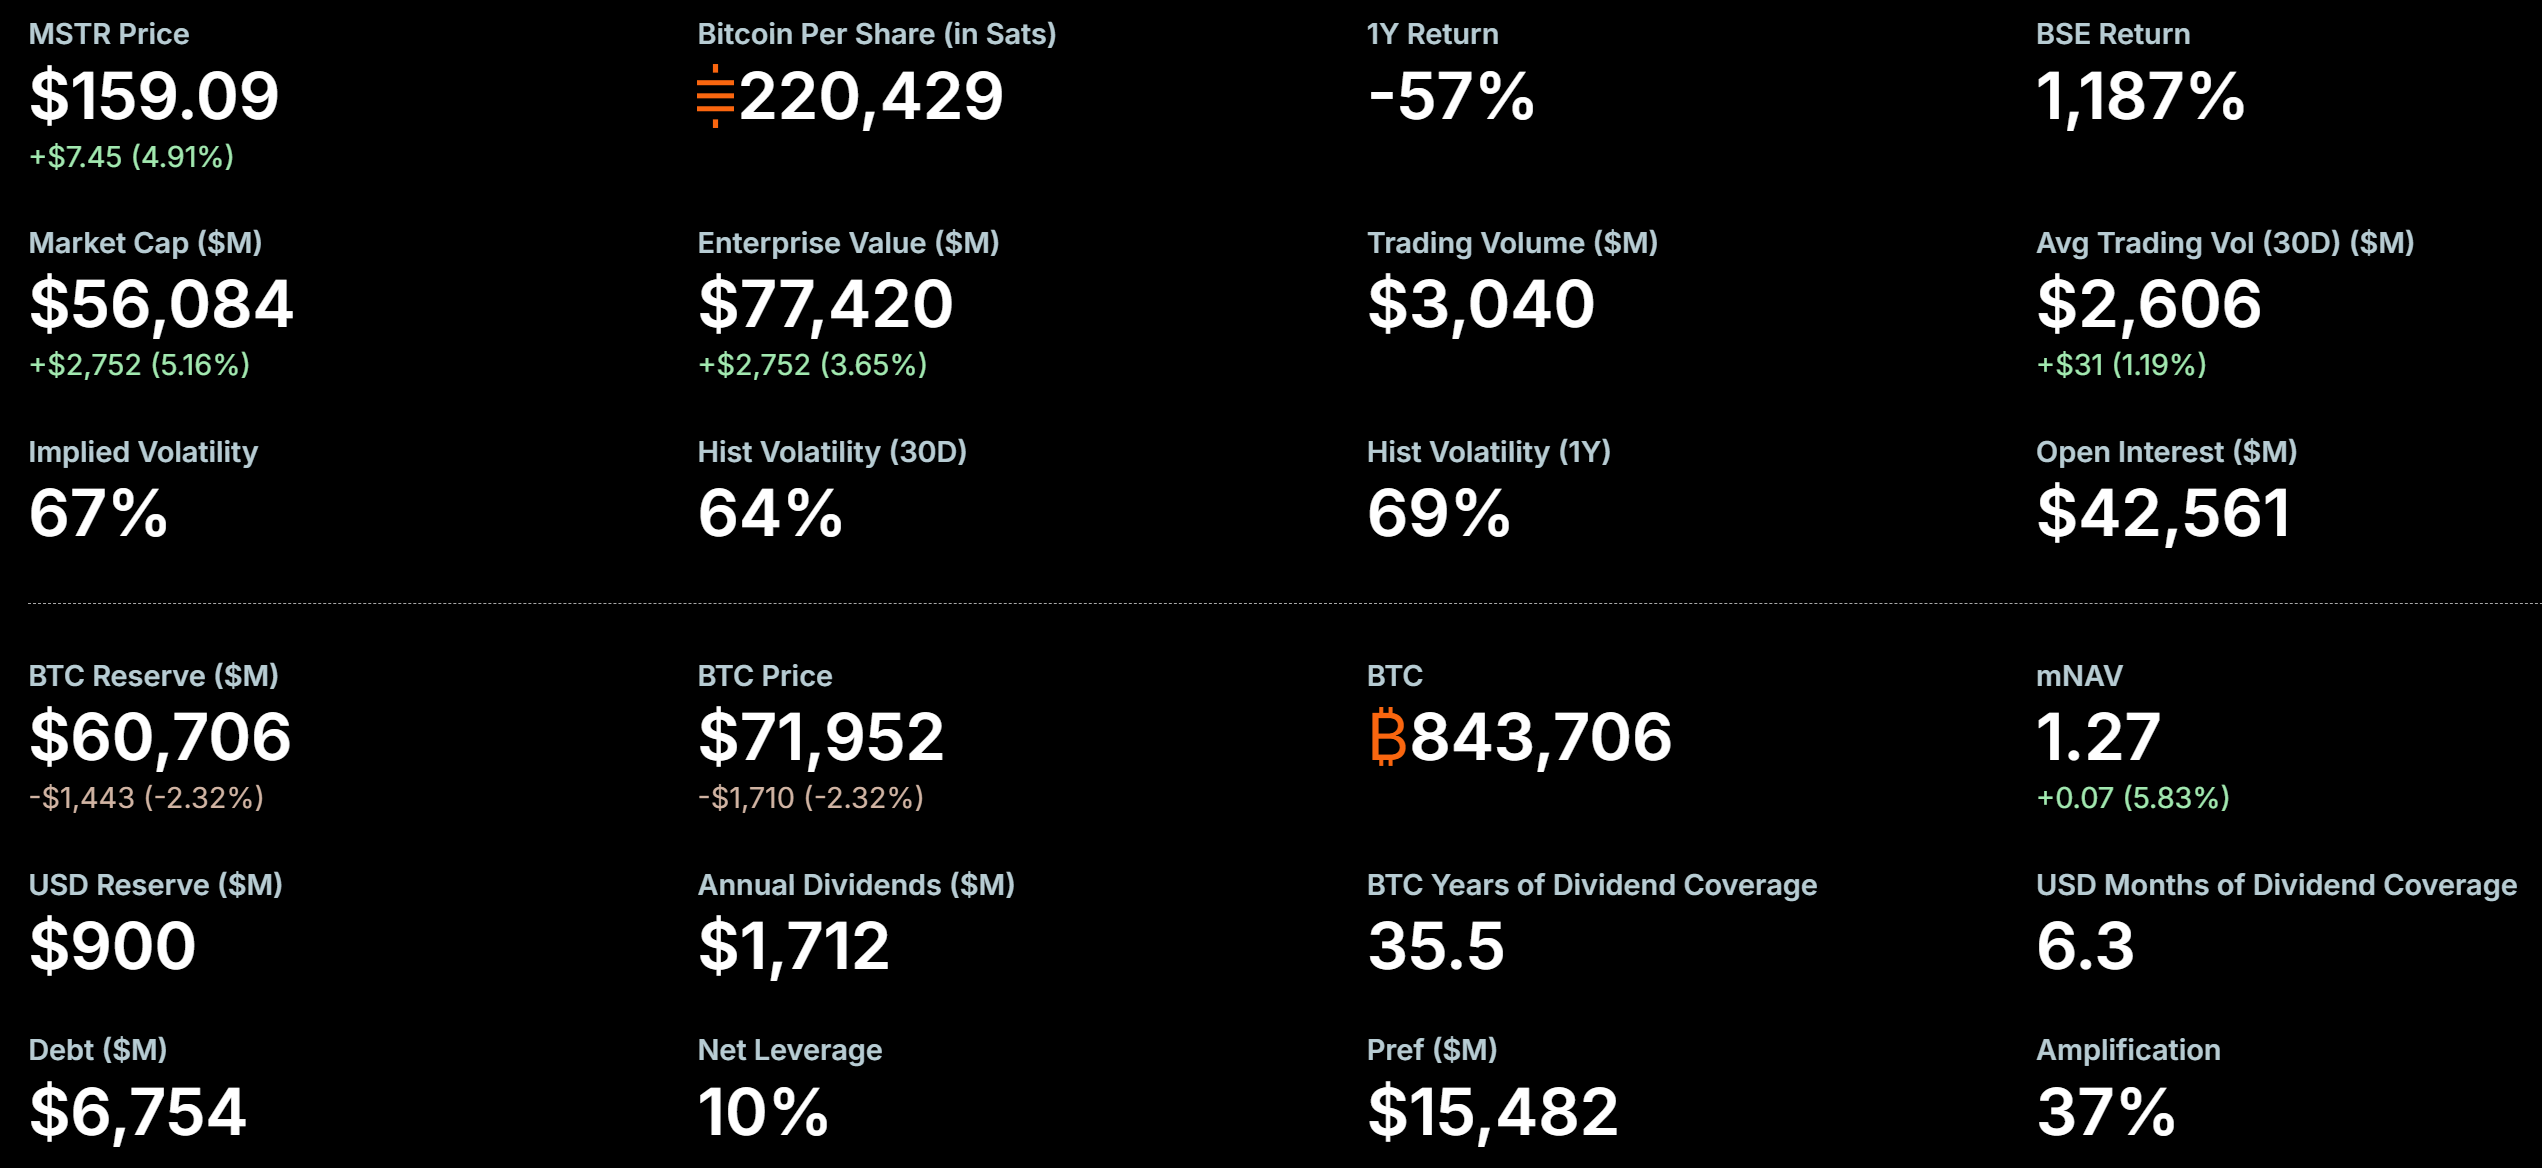
The company offloaded 32 BTC for approximately $2.5 million during May 26–31, while maintaining a massive 843,706 BTC treasury.
On-Chain Suspicion Meets Official Confirmation
Traders and on-chain analysts spotted MicroStrategy wallets moving BTC to Coinbase Prime days earlier, sparking intense speculation.
Arkham Intelligence and community trackers highlighted the unusual activity, which fueled a Polymarket bet on whether any sale would occur by May 31.
One trader bet big on YES when the market priced the probability around 11%. The June 1 filing resolved the market in his favor, delivering an estimated $200,000 payout.
Follow us on X to get the latest news as it happens
The last time MicroStrategy sold Bitcoin was in December 2022, when they disposed 704 BTC for tax-loss harvesting before repurchasing more of the pioneer crypto two days later.
Details from the latest filing, showing last week’s Bitcoin sales include:
- Sold: 32 BTC at an average of around $77,135 each (net of fees).
- Holdings as of May 31: 843,706 BTC with approximately $63.87 billion cost basis (average of around $75,699 per BTC).
- Purpose: Proceeds support preferred stock dividends (STRF, STRC, etc.).
- USD Reserve: $900 million earmarked for obligations.

Bitcoin traded near $72,000–$74,000 around the period, meaning MicroStrategy sold at a premium to recent levels.
The sale represents a tiny fraction (<0.004%) of holdings but marks a shift from pure accumulation.
MicroStrategy has aggressively grown its treasury via ATM equity and preferred stock raises, often buying thousands of BTC weekly.
This disciplined approach, selling selectively while replenishing via capital markets, aligns with executive comments on proactive treasury management.
Preferred dividends and debt service remain key priorities, backed by the dedicated USD reserve.
With Bitcoin volatility persisting and corporate treasuries under scrutiny, any larger sales or accelerated buys could influence sentiment.
MicroStrategy’s Bitcoin-per-share metric and yield targets will likely remain central to its narrative as it balances growth, obligations, and long-term conviction in Bitcoin.
The post MicroStrategy Sells Bitcoin For the First Time Since 2022, Hands Trader a $200,000 Win appeared first on BeInCrypto.

Key Takeaways
- Barclays launched coverage of IBM on Monday with an Overweight rating and set a $350 price target.
- Shares of IBM climbed approximately 11-12% to near $330 during premarket hours.
- The optimistic outlook focuses on IBM’s software division, which accounts for nearly 50% of revenue and most profits.
- According to Barclays analyst Raimo Lenschow, IBM’s infrastructure software caters to large, regulated corporations — establishing a durable customer base resistant to AI disruption.
- This bullish call adds to recent strength: IBM has climbed 28% in the last month and recorded its best weekly performance in a quarter-century.
IBM shares experienced significant upward momentum on Monday following a bullish initiation from Barclays — and the catalyst wasn’t related to quantum computing developments.
International Business Machines Corporation, IBM
Shares of IBM jumped approximately 11% in premarket action, reaching $330.11, after Barclays analyst Raimo Lenschow launched coverage with an Overweight recommendation and established a $350 price objective. This target suggests additional upside potential of 17.5% from premarket levels.
The technology giant has been experiencing remarkable momentum. IBM has advanced 28% during the past 30 days and recently delivered its most impressive weekly performance in two and a half decades. Shareholders of Big Blue have enjoyed substantial gains in recent weeks.
While quantum computing has dominated recent headlines — IBM secured $1 billion in federal CHIPS and Science Act funding to construct a dedicated quantum chip fabrication facility, subsequently committing over $10 billion of corporate capital toward quantum development and production over five years — Lenschow’s investment thesis focuses elsewhere.
The Enterprise Software Narrative
His investment case is more straightforward: IBM has transformed into a software-driven enterprise, and the market hasn’t fully recognized this evolution.
Software accounts for approximately half of IBM’s total revenue while generating the majority of corporate profits. Lenschow anticipates this revenue composition will expand over time due to software’s superior growth characteristics.
The critical element of his analysis centers on IBM’s software specialization. This isn’t consumer-facing applications or fashionable AI tools. Instead, it’s fundamental infrastructure — Red Hat Enterprise Linux, Red Hat OpenShift, automation solutions, and data analytics platforms — engineered specifically for large, sophisticated enterprises operating hybrid cloud and on-premises infrastructures.
These clients will never transition entirely to cloud environments, Lenschow observes. This dynamic creates a captive, predictable revenue stream that’s difficult to disrupt.
“We see mid single digit organic revenue growth and ongoing margin leverage, which should create a stable earnings compounder with a Quantum option,” he wrote.
A Growing Consensus
Lenschow’s perspective isn’t breaking new ground. Oppenheimer’s Param Singh employed similar terminology in January, characterizing IBM’s software assets as “sticky.” Evercore ISI’s Amit Daryanani reinforced this view in February. And during April, Citi Research’s Fatima Boolani portrayed IBM’s software and hardware as deeply embedded “across the most critical points of the world’s largest, most complex IT infrastructures.”
This convergence of analyst endorsements illustrates a compelling investment narrative gaining momentum: IBM’s enterprise software foundation represents a competitive advantage rather than a burden.
Additional attention has emerged from social media channels. Statements from Donald Trump in December commending IBM’s chief executive have reemerged online, circulating alongside discussions of other occasions where the president has publicly recognized particular equities in 2025.
The overall Wall Street sentiment remains measured. Among analysts currently tracking IBM, 10 maintain Buy recommendations while 11 rate it at Hold — establishing a Moderate Buy consensus. The average price objective stands at $291.69, indicating the stock may be appropriately valued at present levels following its recent appreciation.
IBM’s latest financial results demonstrated continued outperformance in the software division, with the corporation emphasizing hybrid cloud capabilities and AI integration throughout its enterprise customer portfolio.


Mutsamudu, Comoros, June 1, 2026 – MEXC, a leading 0-fee cross-asset trading platform, today announced the official launch of ‘RealStocks.’ This innovative equity product is now accessible to eligible users globally. The product seamlessly integrates real ownership rights of traditional financial assets with the low-friction experience of a crypto platform, further expanding MEXC’s 0-fee cross-asset trading ecosystem.
For a long time, investors looking to enter the U.S. stock market were limited to two less-than-ideal options. The first was trading through traditional brokerages, which requires enduring tedious currency exchange and deposit processes. The second was trading synthetic assets or tokenized products on crypto platforms, which often comes with drawbacks like poor liquidity and a lack of dividend payouts. The launch of ‘RealStocks’ breaks this deadlock, seamlessly bridging the gap between both worlds.
Building on a highly successful Beta phase validated by over 20,000 early users, the official launch ensures a seamless, battle-tested trading experience. Through MEXC’s licensed broker partner, Atomic Vaults, eligible users can purchase shares in real U.S.-listed companies, eligible users can purchase shares in real U.S. listed companies, with genuine market exposure and liquidity consistent with traditional U.S. equity markets. Where applicable, users are entitled to dividends or distributions on their holdings. The entire trading flow is integrated into MEXC’s existing interface. Users transact in USDT, making the experience of buying U.S. stocks similar to buying crypto in practice. Trading hours follow Nasdaq market sessions, and zero platform trading fees apply during the launch period, keeping costs to a minimum. The product has been validated by over 20,000 users during the Beta phase.

Atomic Vaults is a U.S. FINRA-licensed broker-dealer and global brokerage infrastructure provider backed by Founders Fund and ARK Invest. Processing over $15 billion in monthly trading volume, it enables access to U.S. equities, ETFs, options, and select Asian markets, with support for 24×5 trading, fractional investing, stablecoin funding, and institutional-grade clearing and custody.
MEXC is simultaneously launching three limited-time incentive campaigns.
Campaign 1: SpaceX(PRE) airdrop reward (May 28 – June 5)
Complete a U.S. stock spot trade and participate in the SpaceX(PRE) Season 2 Launchpad subscription before it closes, and receive additional SpaceX(PRE) airdrop rewards. Total prize pool: 200,000 USDT equivalent. Maximum reward per user: 5,000 USDT equivalent in SpaceX(PRE).
Campaign 2: $1,000,000 stock prize pool (June 2 – June 16)
During the campaign period, U.S. stock spot trading is available at zero fees. Complete trading tasks to share in a 1,000,000 USD equivalent stock prize pool.
Campaign 3: Real-time market data subsidy for new deposits (First month after U.S. stock launch)
Complete a qualifying deposit to receive a real-time market data subsidy — helping users start trading U.S. stocks with zero barrier to entry.
MEXC CEO Vugar Usi said:
“From Pre-IPO access to tokenized stocks, and now to real share ownership through U.S. stock spot trading, MEXC has continuously pushed the boundaries of what crypto users can access in global markets. With U.S. stock spot trading, users can now truly own world-class traditional financial assets within a familiar crypto trading environment — not just track their price. As 2026 brings a historic wave of IPO windows from the world’s top technology companies, crypto users will have the chance to participate as real shareholders for the first time. This is what Infinite Opportunities means at MEXC — not a tagline, but a product.”
‘RealStocks’ is now live and open to eligible users.
About MEXC
MEXC is the world’s fastest-growing cryptocurrency exchange, trusted by more than 40 million users across 170+ markets. Built on a user-first philosophy, MEXC offers industry-leading 0-fee trading and access to over 3,000 digital assets. As the Gateway to Infinite Opportunities, MEXC provides a single platform where users can easily trade cryptocurrencies alongside tokenized assets, including stocks, ETFs, commodities, and precious metals.
MEXC Official Website | X | Telegram | How to Sign Up on MEXC
Media contact:
Disclaimer
“0 fees” refers only to the platform’s service charge. Users may still be subject to certain fees, including but not limited to SEC transaction fees, FINRA trading activity fees (TAF), exchange and market center fees, regulatory fees, and any applicable clearing fees.
Not investment advice. For informational purposes only. Trading involves risk. Please consult a qualified professional before making any investment decision.
Territorial Limit: This service is offered only to users in certain jurisdictions. Access may be restricted in certain countries or regions due to local laws and regulations. Please refer to our Terms & Conditions for the complete list of eligible jurisdictions.


Bitmine Immersion (BMNR), the largest publicly-traded Ethereum treasury firm, bought 26,497 ether (ETH) last week, sharply reducing the pace of accumulation after making its largest purchase of 2026 just a week earlier.
The latest acquisition, worth roughly $53 million at current ETH prices, lifted Bitmine’s holdings to nearly 5.42 million tokens, or approximately 4.49% of ether’s circulating supply, according to a Monday company update.
The purchase was down more than 75% from the prior week’s 120,000 ETH haul.
The slowdown comes after Thomas “Tom” Lee, chairman of Bitmine, said in May at Consensus 2026 that the company planned to moderate accumulation as it was rapidly approaching its long-term goal of owning 5% of ETH’s supply.
Despite the slower pace, Bitmine remains one of the few large digital asset treasury firms still actively adding to its crypto holdings. Even Michael Saylor’s bitcoin juggernaut Strategy (MSTR) sold $2.5 million bitcoin last week. Bitmine has acquired more than 1 million ETH since the start of the year and now sits about 90% of the way toward its stated goal of controlling 5% of the network’s supply.
“ETH prices are not reflecting the strengthening of Ethereum fundamentals,” Lee said in Monday’s statement. “But then again, this is not surprising given we are in the early stages of crypto spring.”
Bitmine’s total crypto and cash holdings stood at $11.6 billion as of May 31. In addition to its ETH treasury, the company held 203 bitcoin, $446 million in cash, and stakes in Beast Industries and Eightco Holdings.
The firm has increasingly focused on generating income from its holdings through staking. The company estimates its staking operations generate roughly $258 million in annualized revenue, with projected rewards approaching $300 million annually through its MAVAN staking platform.

Coinbase has activated direct rupee bank rails in India, enabling local users to move money between bank accounts and crypto markets on a single platform. The feature integrates deposits and withdrawals in Indian rupees via the Immediate Payment Service (IMPS) network and unlocks access to spot trading, perpetual futures, and Coinbase’s Advanced Trade interface from one unified interface.
In a blog post published this week, Coinbase outlined that Indian users can now deposit and withdraw INR directly through IMPS while trading across multiple product layers. The move is part of a broader push to deepen Coinbase’s footprint in India, following the company’s regulatory progress and a prior foray into the market that included a brief period of UPI-based rupee deposits in 2022.
The company says the development is anchored by Coinbase’s registration with India’s Financial Intelligence Unit (FIU) earlier in 2025, a step it describes as providing a formal regulatory footing under the country’s anti‑money laundering framework. The registration comes after a tumultuous debut in 2022, when UPI-based rupee deposits were briefly supported before payments authorities distanced themselves from crypto use of the network and partners pulled back.
India’s position in global crypto adoption has been a focal point for exchanges seeking to balance regulatory risk with fast-growing user demand. Chainalysis ranked India first in its 2025 Global Crypto Adoption Index, citing strong on‑chain retail activity, centralized exchange use, and a broad array of on-ramp activity—indicators that Coinbase is keen to capitalize on as it expands access to INR rails. The country remains a competitive battlefield, with domestic platforms such as CoinDCX, CoinSwitch, ZebPay and WazirX, alongside global players like Binance and KuCoin, which have historically leveraged fiat-onramps and peer-to-peer channels rather than direct bank rails.
With rupee deposits and withdrawals now live, Coinbase is positioning itself as a bridge between domestic liquidity and its global exchange ecosystem. The firm says the INR order books have been built to support concentrated local liquidity, while users also gain access to Coinbase’s spot markets, perpetual contracts, and the Advanced Trade interface on a single platform. In practice, that means Indian traders can navigate from bank-to-crypto transfers straight into trading without switching apps or networks, a streamlined flow that could shift how retail participants interact with digital assets.
Key takeaways
- Coinbase launches direct INR rails via IMPS in India, enabling bank-to-crypto transfers on a single platform for spot, futures, and Advanced Trade.
- The move follows Coinbase’s FIU registration in March 2025, signaling a formal regulatory foothold for crypto activity in India.
- India tops Chainalysis’s 2025 Global Crypto Adoption Index, underscoring strong domestic activity and potential for continued on‑ramps and liquidity provision.
- Despite regulatory headwinds and tax considerations, India remains a key growth market, with multiple local and international exchanges competing for retail users.
Direct INR rails and what changes for Indian traders
By linking IMPS-enabled INR deposits and withdrawals to its trading rails, Coinbase provides Indian users with a direct bank-to-crypto transfer channel. This reduces friction that previously required converting rupees through third-party gateways or relying on peer-to-peer mechanisms. The platform now supports access to spot markets, perpetual futures, and its Advanced Trade interface, all in a single experience.
Industry observers note that the move could broaden participation among new entrants who are attracted to the convenience of direct rupee onramps, especially in a market where mobile payments and self-directed trading have become widely adopted. While domestic exchanges have long dominated the landscape, the availability of direct INR rails to a global exchange like Coinbase could raise the stakes for liquidity competition and pricing efficiency across Indian crypto markets.
That said, investors should monitor how the INR rails interact with broader regulatory requirements in India, including AML steps and tax rules that shape user behavior. Coinbase’s own disclosures emphasize compliance alignment with local authorities, a necessary condition for sustaining a broad retail onboarding pump in a highly regulated environment.
Regulatory momentum and market context
The March 2025 FIU registration marks a notable milestone in Coinbase’s attempt to formalize its presence in India. The company stated that the registration enables it to offer crypto trading services in the Indian market under the country’s AML framework, a prerequisite that was missing during earlier, more speculative phases of its Indian operation.
India’s policy landscape remains nuanced, with taxes and reporting requirements shaping user incentives. A 30% tax on many digital asset gains and a 1% tax deducted at source on certain transactions have created a complex environment for both retailers and platforms. Despite these constraints, India’s large and digitally engaged population has drawn sustained investment and competition from global and domestic players alike, as reflected in Chainalysis’ 2025 ranking.
Chainalysis highlighted India as the top country in its adoption index, a signal that on-chain activity, exchange usage, and onshore liquidity are formidable forces shaping the trajectory of crypto in the world’s second-most populous nation. For Coinbase and similar platforms, that combination of size and activity creates a compelling case for expanding on‑ramps, liquidity, and product breadth.
Market dynamics: competition, liquidity, and user choice
India’s crypto exchange ecosystem is crowded, with homegrown platforms like CoinDCX, CoinSwitch, ZebPay, and WazirX serving domestic traders, alongside major global players that have sought access via local or cross-border channels. The shift toward direct INR rails could intensify competition for user deposits and trading activity, particularly if Coinbase’s INR liquidity pools and global order books offer improved pricing and deeper liquidity compared with other onramps.
Beyond domestic players, the broader crypto landscape has included P2P rupee access via major exchanges such as Binance and KuCoin. However, the direct IMPS route via Coinbase represents a more traditional banking rail, potentially improving reliability and speed for on- and off-ramps and reducing reliance on quasi-fiat bridges. For users, that could translate into more predictable settlement times and better liquidity visibility across the exchange’s global ecosystem.
What readers should watch next
As Coinbase builds out INR liquidity and expands product access, investors and traders should watch how the Indian market adapts to direct INR rails and evolving regulatory scrutiny. Key questions include: Will direct bank rails attract a broader base of retail participants, and how will Indian regulators respond to expanding on-chain activity linked to global platforms? How will the interplay between tax policy and on‑ramp options shape user behavior and platform competition in the months ahead?
For now, Coinbase’s direct INR rails represent a meaningful step in normalizing bank-to-crypto flows in India, reinforcing the country’s standing as a premier growth hub for crypto adoption and on‑ramp innovation. The next phase will likely hinge on how efficiently the system can scale liquidity, maintain compliance, and navigate the complex regulatory terrain that has already influenced several high-profile market moves in recent years.
As the market watches, Indian users can expect more clarity on how foreign and domestic platforms balance accessibility with compliance, and how this balance will influence the long-term trajectory of crypto usage in one of the world’s most dynamic digital ecosystems. For now, the availability of direct INR rails marks a practical, headline-grabbing improvement in user experience, with potential ripple effects across liquidity, competition, and investor confidence in India’s crypto markets.
Crypto investment products extended losses to three straight weeks last week amid ongoing selling pressure in markets and limited institutional demand.
Crypto exchange-traded products (ETPs) recorded $1.67 billion in outflows last week, the second-largest weekly withdrawal of 2026, CoinShares reported on Monday.
The fresh outflows bring three-week losses to $4.21 billion, with total assets under management dropping to $141 billion, the lowest level since early April.
CoinShares head of research James Butterfill attributed surging outflows to an Iran-related risk-off move that has now overwhelmed any cushioning effect from CLARITY Act progress. “The pattern is reminiscent of the January-February episode that delivered five consecutive negative weeks,” he said.
Bitcoin sees the largest weekly outflow of 2026
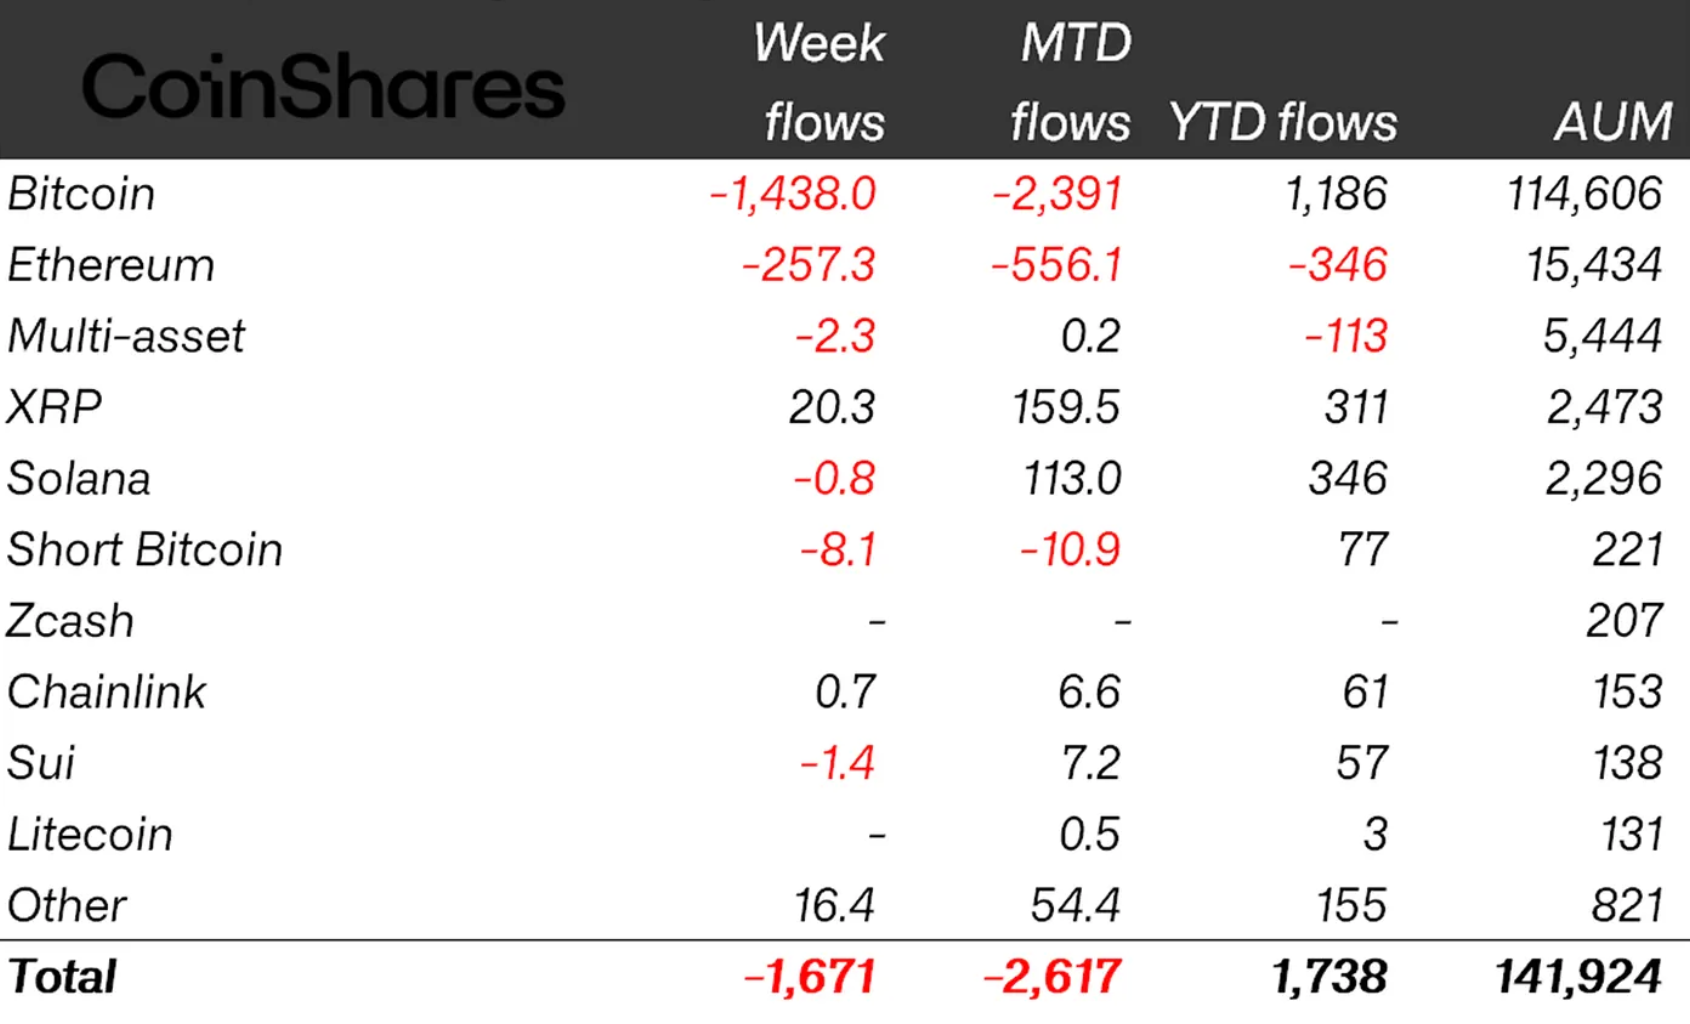
Bitcoin (BTC) ETPs led weekly outflows by a wide margin, with $1.44 billion leaving the funds, marking the largest weekly outflow so far this year.
The funds were $2.4 billion down month-to-date but still had about $1.2 billion in inflows year-to-date, while assets under management fell to $114.6 billion.

Crypto ETP flows by asset (in millions of US dollars). Source: CoinShares
Ether (ETH) funds continued to see selling pressure with $257.3 million in outflows, bringing year-to-date losses to $346 million.
Altcoin participation also collapsed, CoinShares’ Butterfill said, referring to only five assets recording substantial inflows above $1 million, down from nine a week prior.
XRP (XRP) again led positive momentum with $20.3 million in inflows, while Hyperliquid (HYPE) and Near (NEAR) followed with $10.8 million and $7.6 million, respectively.
US drives losses with $1.63 billion of outflows
Regionally, the United States drove the global outflow story with $1.63 billion of outflows, aligning with $1.42 billion in outflows from US-listed spot Bitcoin exchange-traded funds (ETFs), according to SoSoValue data.
Germany joined the risk-off sentiment with $25.7 million of outflows, while Sweden and Hong Kong saw $6.6 million and $4.5 million in outflows, respectively. The Netherlands again was the only country to see inflows above $1 million, with $1.3 million in inflows, down from $6.6 million a week prior.
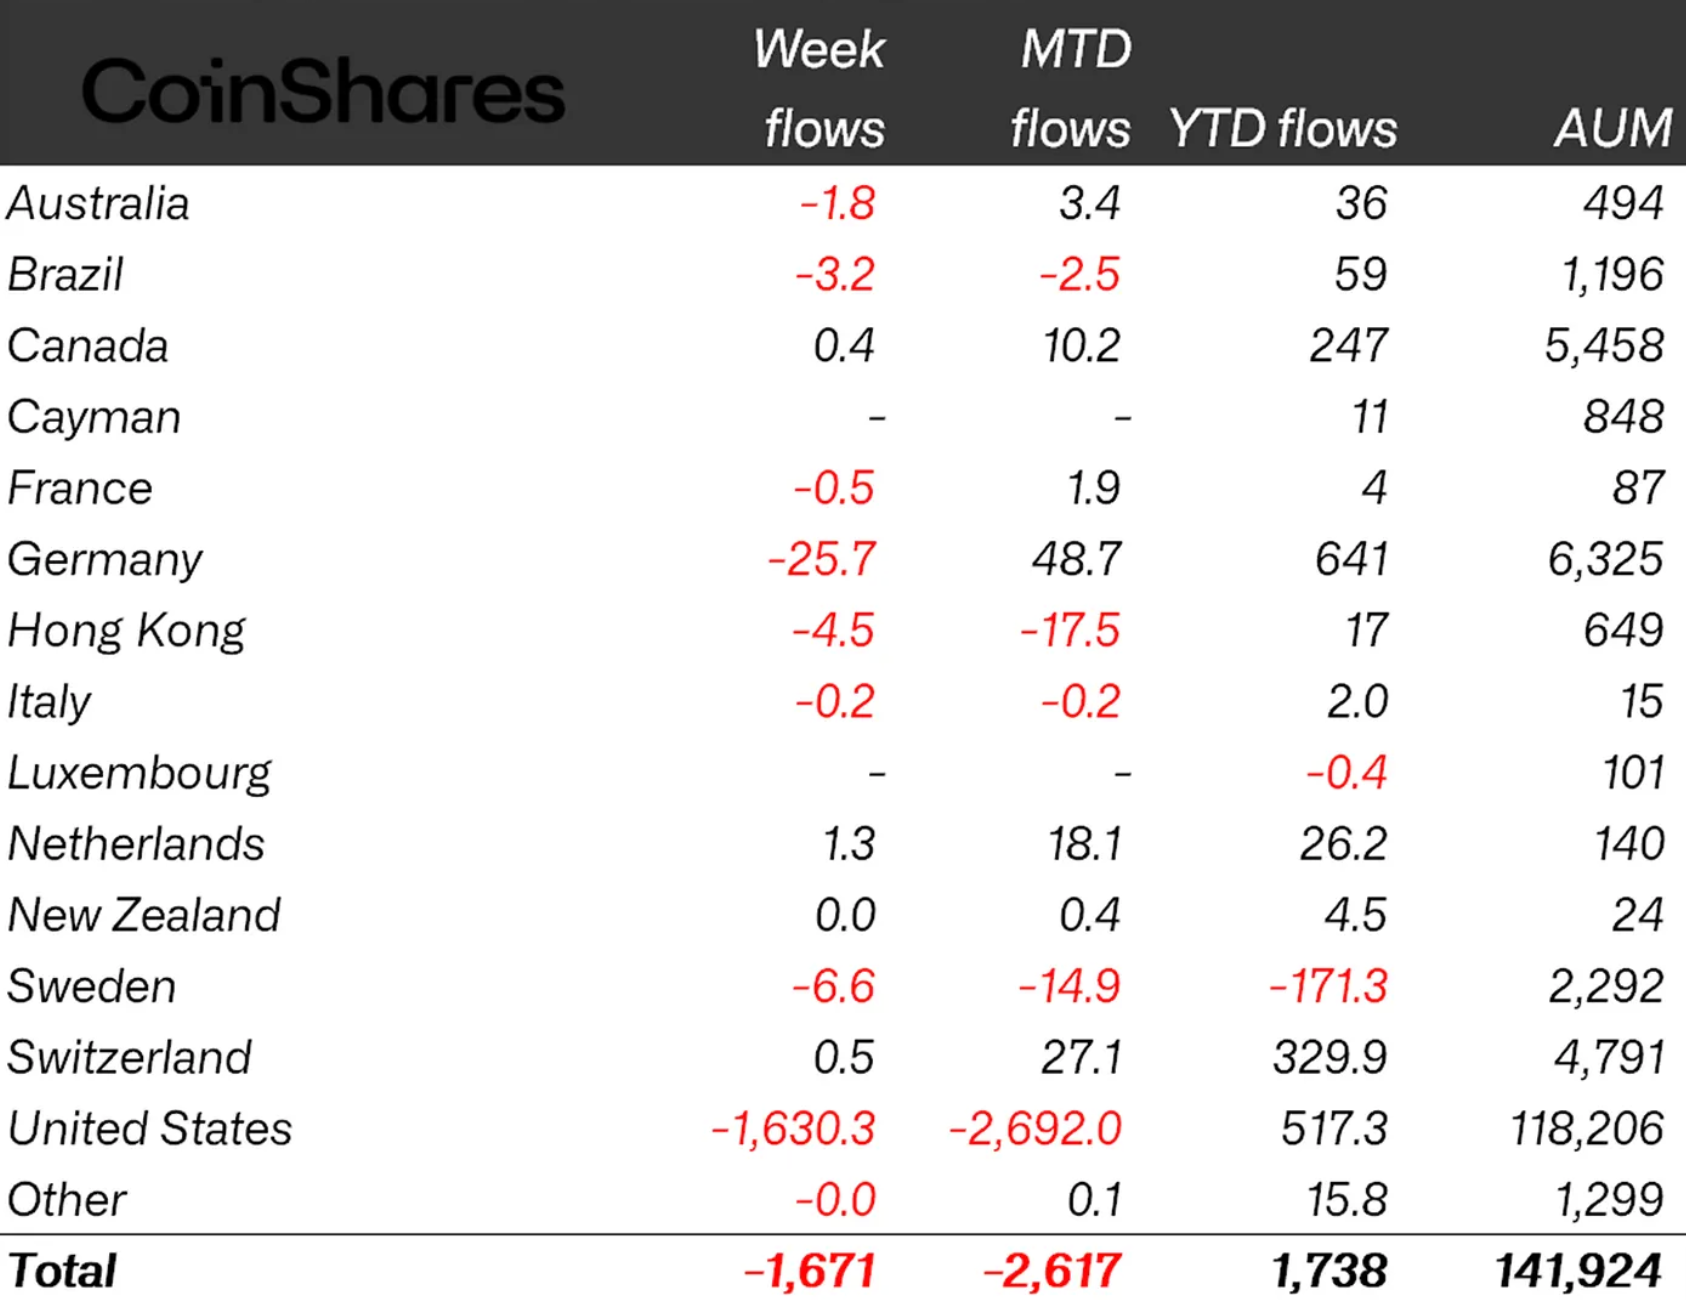
Crypto ETP flows by country (in millions of US dollars). Source: CoinShares
According to the derivatives trading desk at Laser Digital, the crypto sell-off last week came without a clear catalyst and was affected by underperforming equities.
Related: Strategy’s Michael Saylor teases BTC buy with ‘working better’ tweet
The unit cited a lack of demand, including Michael Saylor’s Strategy announcing that it did not purchase any BTC between May 18 and May 24.
“With STRC still trading below par and the continued lack of interest from retail buyers, BTC is expected to remain weak for the time being,” it said in a statement seen by Cointelegraph.
Magazine: HYPE chases $100 target, ETH could dump below $1800: Market Moves


Michael Saylor weeks ago teased that it was coming, but the news for the moment is shocking already depressed crypto markets even further.
Strategy (MSTR) in a Monday morning filing disclosed the sale of 32 bitcoin for $2.5 million. The amount is a rounding error compared to the 840,000-plus BTC held by the company, but it’s nevertheless significant, suggesting even larger sales down the road as Strategy looks to fund dividend payments on its high-yielding preferred stock STRC.
Bitcoin has slipped just below $72,000 on the news, down nearly 3% over the past 24 hours. MSTR shares are lower by 5.15% premarket. U.S. stocks, meanwhile. are set to add to record highs hit last week, with futures on all three major indices in the green.
Importantly, it’s not the first time Saylor and team have sold some of their stack. The company near the bottom of the 2022 bear market sold 704 bitcoin at about $18,000 each.
Bitcoin bulls can only hope the current sales again might be marking a significant bottoming in prices.

Key Highlights
- Kentucky Retirement Systems dramatically expanded its ServiceNow holdings by 400% during Q4, acquiring an additional 51,904 shares valued at approximately $9.94 million.
- Multiple institutional players made substantial position increases, pushing total institutional ownership to 87.18% of outstanding shares.
- Shares began Monday trading at $124.56, trading above the 200-day moving average of $123.39 despite remaining below the 52-week peak of $211.48.
- First quarter revenue surpassed expectations at $3.77 billion compared to the projected $3.75 billion, marking a 22.1% year-over-year increase.
- Analysts maintain a “Moderate Buy” rating with a collective price target of $141.85.
ServiceNow (NOW) shares are capturing significant institutional investor interest, as fourth-quarter 2025 filings reveal a substantial wave of position building and expansion among professional money managers.
Leading the charge, Kentucky Retirement Systems quadrupled its ServiceNow stake to 64,880 shares, representing approximately $9.94 million in value at filing time. This dramatic move signals strong conviction rather than a minor portfolio adjustment.
This bullish sentiment extended across multiple institutions. Peapack Gladstone Financial Corp expanded its holdings by an impressive 505.5%, Florida Financial Advisors increased exposure by 552.9%, and Waterloo Capital grew its position by 384.1%. Meanwhile, Rothschild Wealth initiated a fresh stake valued near $310,000.
Cumulatively, institutional stakeholders now control 87.18% of ServiceNow’s total shares outstanding.
NOW kicked off Monday’s session at $124.56 per share. The stock maintains a position above its 200-day moving average of $123.39, though it continues trading significantly below its 52-week high of $211.48. With a 52-week low of $81.24, the stock has achieved a meaningful rebound from its bottom levels.
The enterprise software giant carries a market capitalization of $128.42 billion alongside a price-to-earnings ratio of 74.23.
First Quarter Results Exceed Expectations
ServiceNow unveiled its Q1 performance on April 22nd, delivering revenue of $3.77 billion that topped the Street’s $3.75 billion estimate. This figure reflects a robust 22.1% year-over-year expansion.
Earnings per share reached $0.97, aligning precisely with analyst projections. The comparable quarter in the prior year produced EPS of $0.81. Looking ahead to the complete fiscal year, the analyst community currently projects earnings of $2.36 per share.
The company achieved a net margin of 12.59% coupled with an 18.16% return on equity.
Street Ratings and Executive Trading
Wall Street maintains a generally optimistic stance on ServiceNow shares. Citigroup elevated its price objective from $154 to $158 while maintaining a “Buy” rating. Evercore increased its target from $140 to $150 with an “Outperform” designation. BTIG reaffirmed its “Buy” recommendation with a $150 target. DA Davidson sustained its “Buy” rating with the most aggressive target at $190. Cantor Fitzgerald adjusted its target downward to $122 but preserved an “Overweight” rating.
Among 43 monitored analysts, the distribution stands at: two Strong Buy ratings, 35 Buy ratings, five Hold ratings, and one Sell rating. The average price target comes to $141.85.
Regarding insider transactions, Director Paul Edward Chamberlain divested 1,500 shares on May 14th at $87.23 each, trimming his stake by 3.23%. Insider Paul Fipps sold 1,048 shares on May 18th at $98.51 apiece, representing a 7.99% reduction. Both transactions occurred through predetermined Rule 10b5-1 trading plans. Fipps executed his sale specifically to satisfy tax liabilities associated with vesting equity compensation.
Collectively, company insiders disposed of 28,071 shares totaling roughly $2.53 million over the past quarter. Executive and board ownership represents merely 0.34% of the company.


Strategy (MSTR) sold 32 bitcoin between May 26 and May 31 at an average net price of $77,135 a coin, totaling $2.5 million, the company disclosed in an 8-K filing on Monday.
Bitcoin briefly dropped under the $72,000, per CoinDesk data, with over $90 million in BTC-tracked futures positions liquidated shortly on the move.
The disposal is Strategy’s first disclosed bitcoin sale and the proceeds are earmarked to fund distributions on its preferred stock, according to a footnote in the filing.
In addition, for the week, Strategy raised $128.3 million through its at-the-market (ATM) common stock program and allocated a small portion of the proceeds to increase its U.S. dollar cash reserve from $871 million to $900 million. After depleting a substantial portion of its cash holdings $1.5 billion of its 2029 convertible notes.
The company held 843,706 bitcoin at an average purchase price of $75,699 as of May 31, putting the sale price above its blended cost basis but also above where bitcoin was trading on Monday below $72,000 per CoinDesk data.

Seemingly every company is obsessed with artificial intelligence these days, whether it’s how the technology is transforming their industry or the effects it’s having on employees and customers.
But the degree to which companies are utilizing AI tools internally and adapting to a rapidly changing reality varies dramatically. A new study from AI-Driven Enterprise Institute (AIDE) breaks down how well S&P 500 companies — and their leaders — are adopting AI compared to their peers.
The top performers, unsurprisingly, are centered in the tech industry, according to the data, which was shared with CNBC. In looking at four areas — literacy, advocacy, orientation and implementation — AIDE gave each company a score of up to 100 in the four categories and then provided an overall index score.
In technology, the highest company score (the average of the orientation and implementation pillars) and the only 100, went to chipmaker Nvidia, which has become the world’s largest company by selling the chips and systems that have powered the development of AI models and services. Meta and Amazon also scored 100, but in the S&P 500, those companies are considered communication services and consumer discretionary names, respectively.
The only other 100 company score went to energy producer SLB, formerly Schlumberger. The next highest scorer was retailer Walmart, followed by AES and NextEra Energy, which are both classified as utilities.
The new open-source index draws from publicly available data like earnings call transcripts, job openings and patent applications to measure how much executives know and say about AI, as well as how much their companies are prioritizing the technology and bringing it into daily operations.
The data doesn’t measure whether AI is driving financial returns, but it’s meant to give leaders an objective way to compare their strategy to their peers without relying on self-reported surveys, said Paul Cheek, AIDE’s CEO and a senior lecturer at Massachusetts Institute of Technology.
“When a board asks a CEO — ‘How are we doing compared to our peer group?’ — I don’t want it to be speculative,” Cheek said in an interview. “I want there to be some data that they can use to back up what they have to share.”
Cheek said there’s “significant room for improvement” for board members and executives to increase their own AI literacy, adding that boards need to better understand AI “as it relates to the ability to manage risk and strategic investments in the organizations that create value for all of us.”
Here are the the 20 companies with the top company scores, based on their “orientation” and “implementation” scores:
- Nvidia (100)
- Schlumberger (100)
- Amazon (100)
- Meta (100)
- Walmart (95.84)
- AES (95.46)
- NextEra Energy (95.44)
- Ecolab (95)
- Digital Realty (94.74)
- Chevron (94.74)
- Alphabet (94.72)
- Equinix (94.59)
- IQVIA (93.75)
- Dow (93.34)
- Halliburton (92.83)
- Broadridge Financial Solutions (91.66)
- Microsoft (91.37)
- Block (90.91)
- Duke Energy (90.91)
- PepsiCo (90.62)
These companies were at the top of their sector based on the “AIDE Index”:
WATCH: Meta reshapes workforce as AI disrupts entry level hiring


Leveraged ETF Dashboard And SSO History

MicroStrategy Sells Bitcoin For the First Time Since 2022, Hands Trader a $200,000 Win

Forget ‘The Silence of the Lambs,’ Sigourney Weaver’s Twisted Serial Killer Thriller Is Free To Stream Soon


-

 NewsBeat5 days ago
Israel says it has killed new Hamas military leader in Gaza City airstrikes
-

 Tech5 days ago
NASA taps Blue Origin to deliver lunar rovers for Moon Base initiative
-

 Politics7 days ago
Bridgerton Season 5: Cast, Release Date And Everything We Know So Far
-

 Sports6 days ago
2026 NBA Finals schedule, odds: Knicks await Thunder or Spurs after winning East
-

 News Videos5 days ago
XRP *JUST* SUCCEEDED!!!! CLARITY ACT EXPOSED!!! (SHE EXPOSED IT)
-

 News Videos3 days ago
This is BROKEN! INSANE 5x MONEY CAR WASH WEEK! The NEW GTA Online UPDATE Today! (GTA5 New Update)
-
 Crypto World6 days ago
Micron Crosses $1 Trillion Market Cap as AI Demand Reshapes Memory Sector
-
 NewsBeat7 days ago
Hottest May day ever as London hits 34.8C in 2C leap from previous records
-

 Business6 days ago
Selena Gomez Reportedly Upset Over Benny Blanco’s Comments on Her ‘Terrible’ Diet
-
 Tech6 days ago
China assigns ID codes to 28,000+ humanoid robots
-

 Business7 days ago
Nikkei 225 Surges Past 65,000 for First Time as Iran Peace Hopes Fuel Record Rally
-

 Tech7 days ago
Microsoft’s quiet Claude Code retreat and the real cost of enterprise AI
-

 Tech3 days ago
Waymo dominates autonomous vehicle registrations as Tesla trails behind
-
 Entertainment7 days ago
‘Breaking Bad’ Star’s Easy-to-Binge 6-Part Crime Series Spin-Off Is Finally Heading to Free Streaming
-

 NewsBeat7 days ago
Crowds find riverside shade in York as temperatures soar
-
Tech5 days ago
The Samsung pay deal is the moment Korean unions changed register
-
 Tech2 days ago
SpaceX just won a second Golden Dome contract. This one is $4.16 billion.
-

 Entertainment6 days ago
Days of our Lives 2-Week Spoilers May 25-June 5: Gwen Rages, Abe Confesses & 2 Tragic Anniversaries!
-

 Tech7 days ago
Westone Audio and Etymotic Acquired by Fidelity Collective in Major IEM Market Move
-
 Entertainment6 days ago
Taylor Swift Fans Label Travis Kelce’s Beer-Chugging A ‘Red Flag
You must be logged in to post a comment Login