

Crypto World
Hyperliquid Whale Refuses to Close HYPE Short Despite Being Down $22M
A Hyperliquid (HYPE) whale is refusing to close a massive short position even as the token’s rally leaves the trader sitting on more than $22 million in unrealized losses.
Key takeaways:
- HYPE’s 134% year-to-date rally, rising ETF inflows and fresh whale accumulation may deepen squeeze pressure on the short seller.
- Technical setups suggest a potential 20% pullback toward $51.5–$45.
HYPE whale increases short exposure to over $100 million
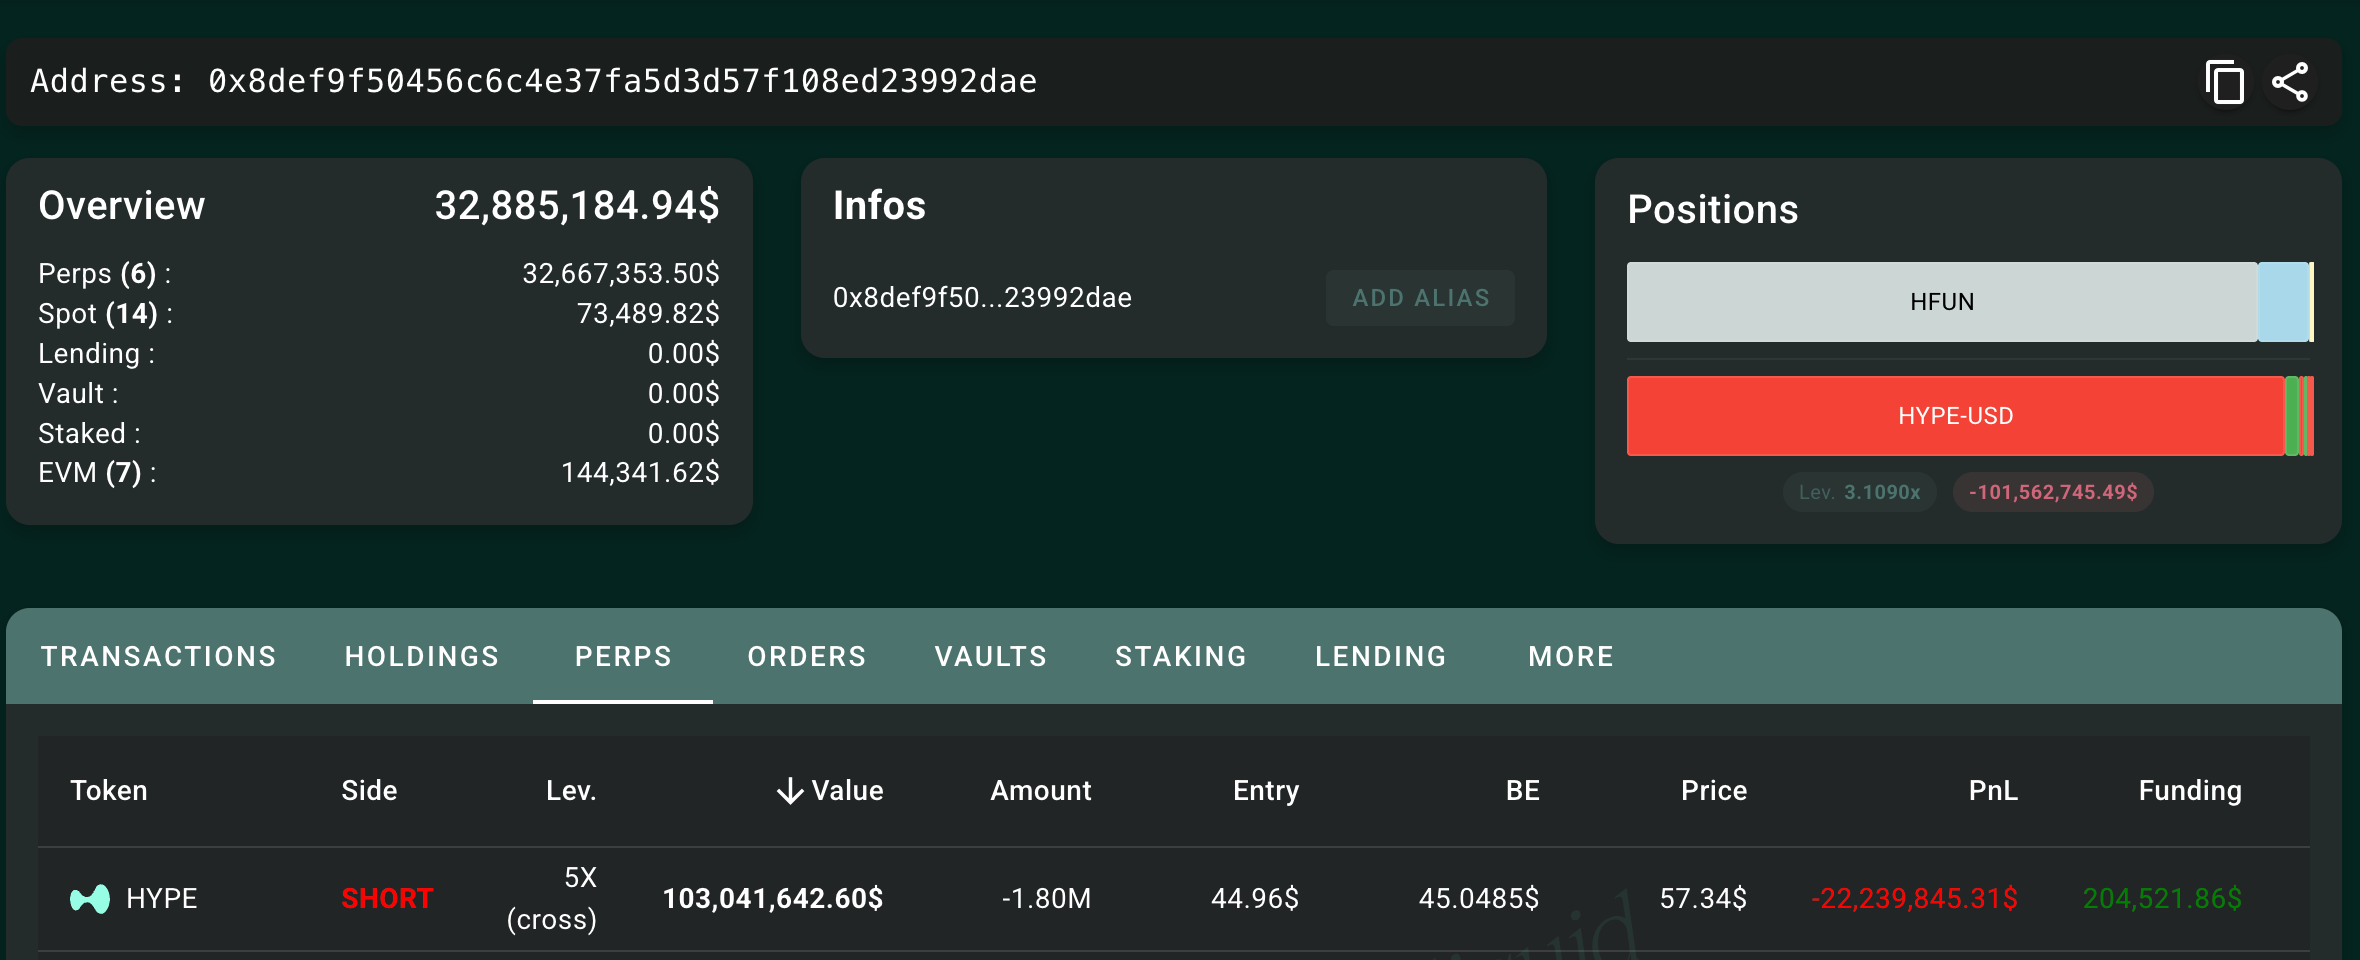
As of Thursday, the wallet ‘0x8ef…’ held a 5x cross-margin short on 1.80 million HYPE, worth about $102.98 million, with an entry price near $44.96, according to HypurrScan data.
With HYPE trading around $57.30, the position was down roughly $22.18 million. The trader had earned about $204,522 in funding, but that barely offset the growing losses as HYPE rallied nearly 8% intraday.
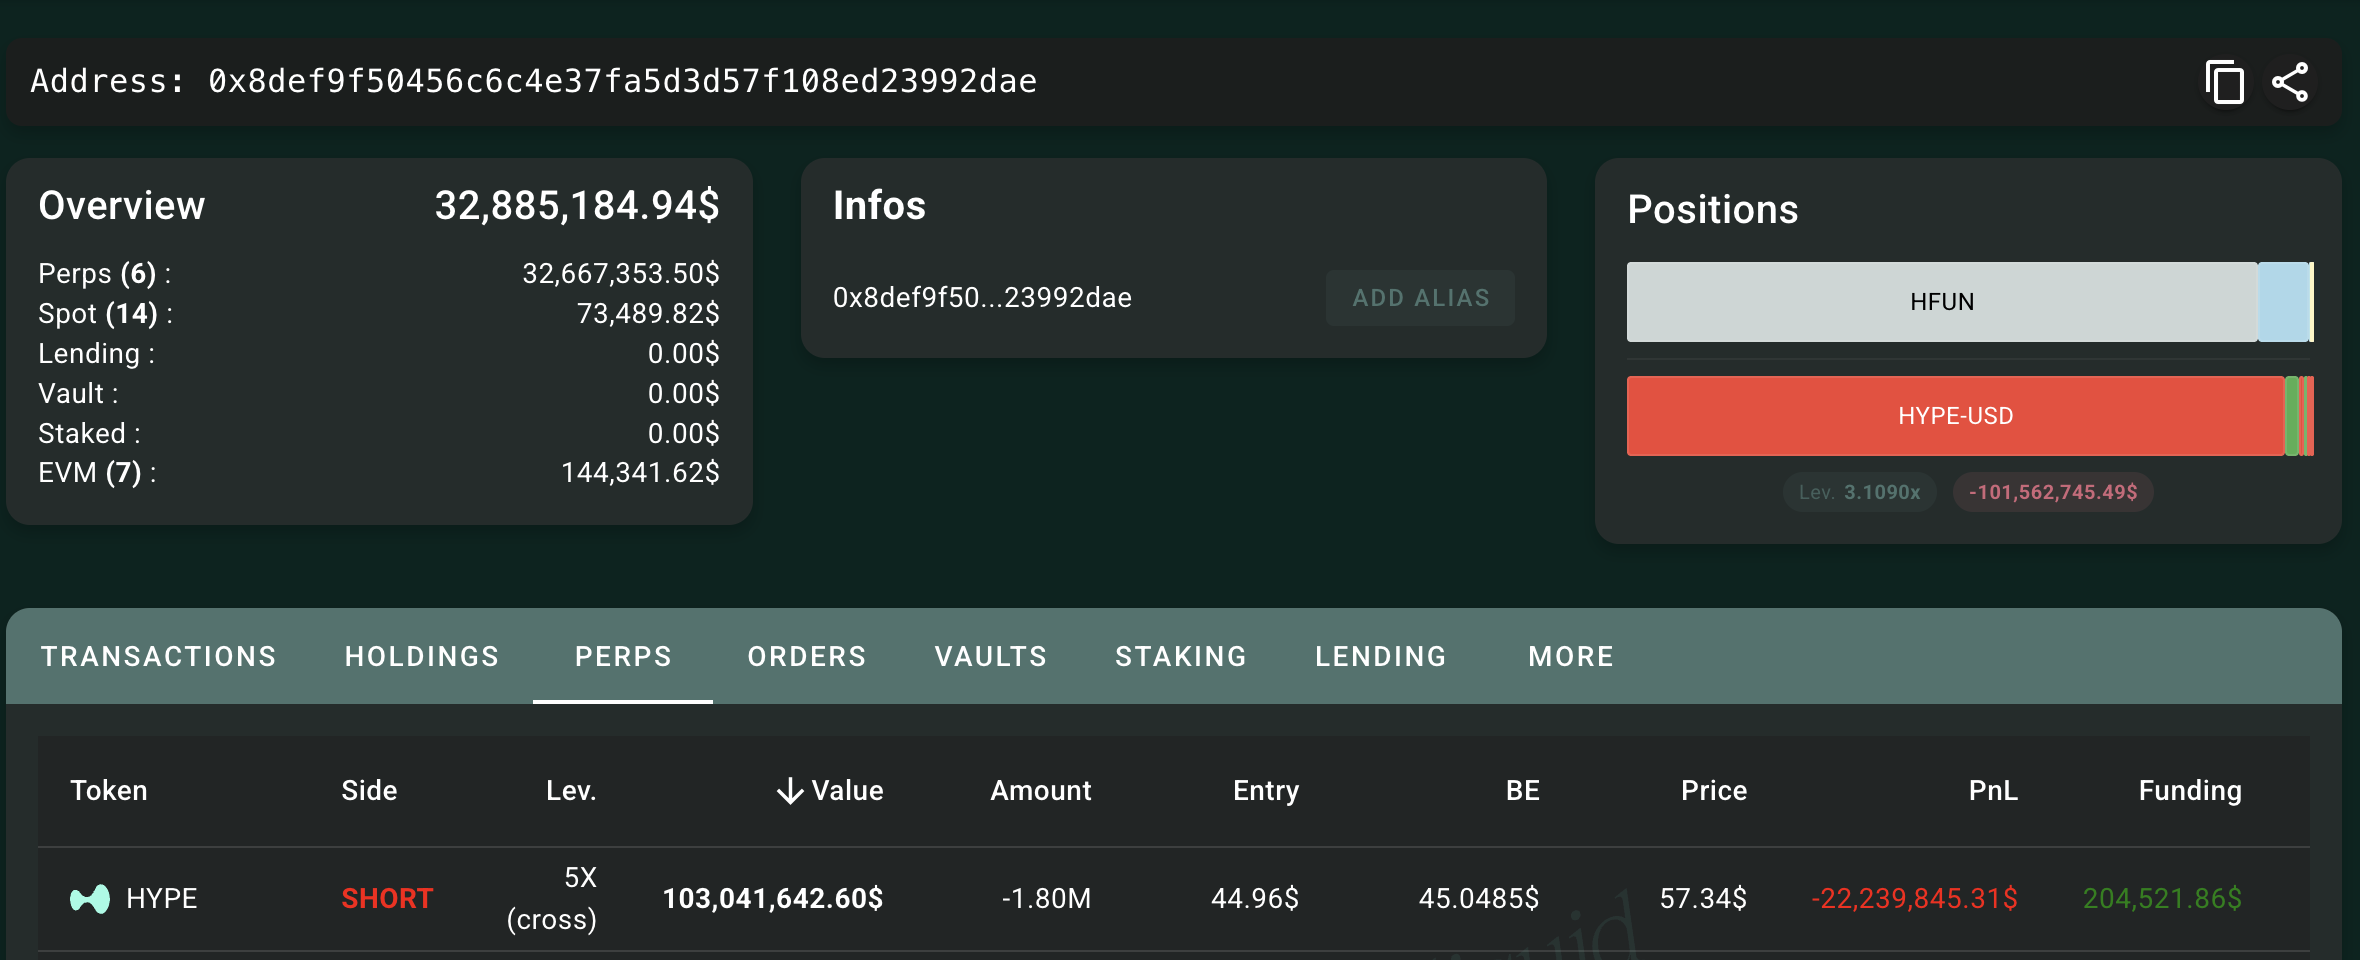
HYPE whale’s perpetual positions dashboard. Source: HypurrScan
The short exposure was worth about $95 million earlier on Thursday, suggesting the whale has increased its exposure despite mounting losses. It risks liquidation if the HYPE price rises to around $69.
Strong HYPE accumulation may deepen whale’s losses
HYPE has emerged as one of the best-performing cryptocurrencies so far in 2026, up about 134% compared to the crypto market’s 16% drop.
A huge chunk of those gains surfaced in May as market attention turned to newly launched US spot HYPE ETFs and Coinbase’s role as the official treasury deployer for USDC on Hyperliquid.
Since the May 12 launch, these ETFs have attracted $58.73 million amid a steady increase in daily inflows, according to data resource SoSoValue.
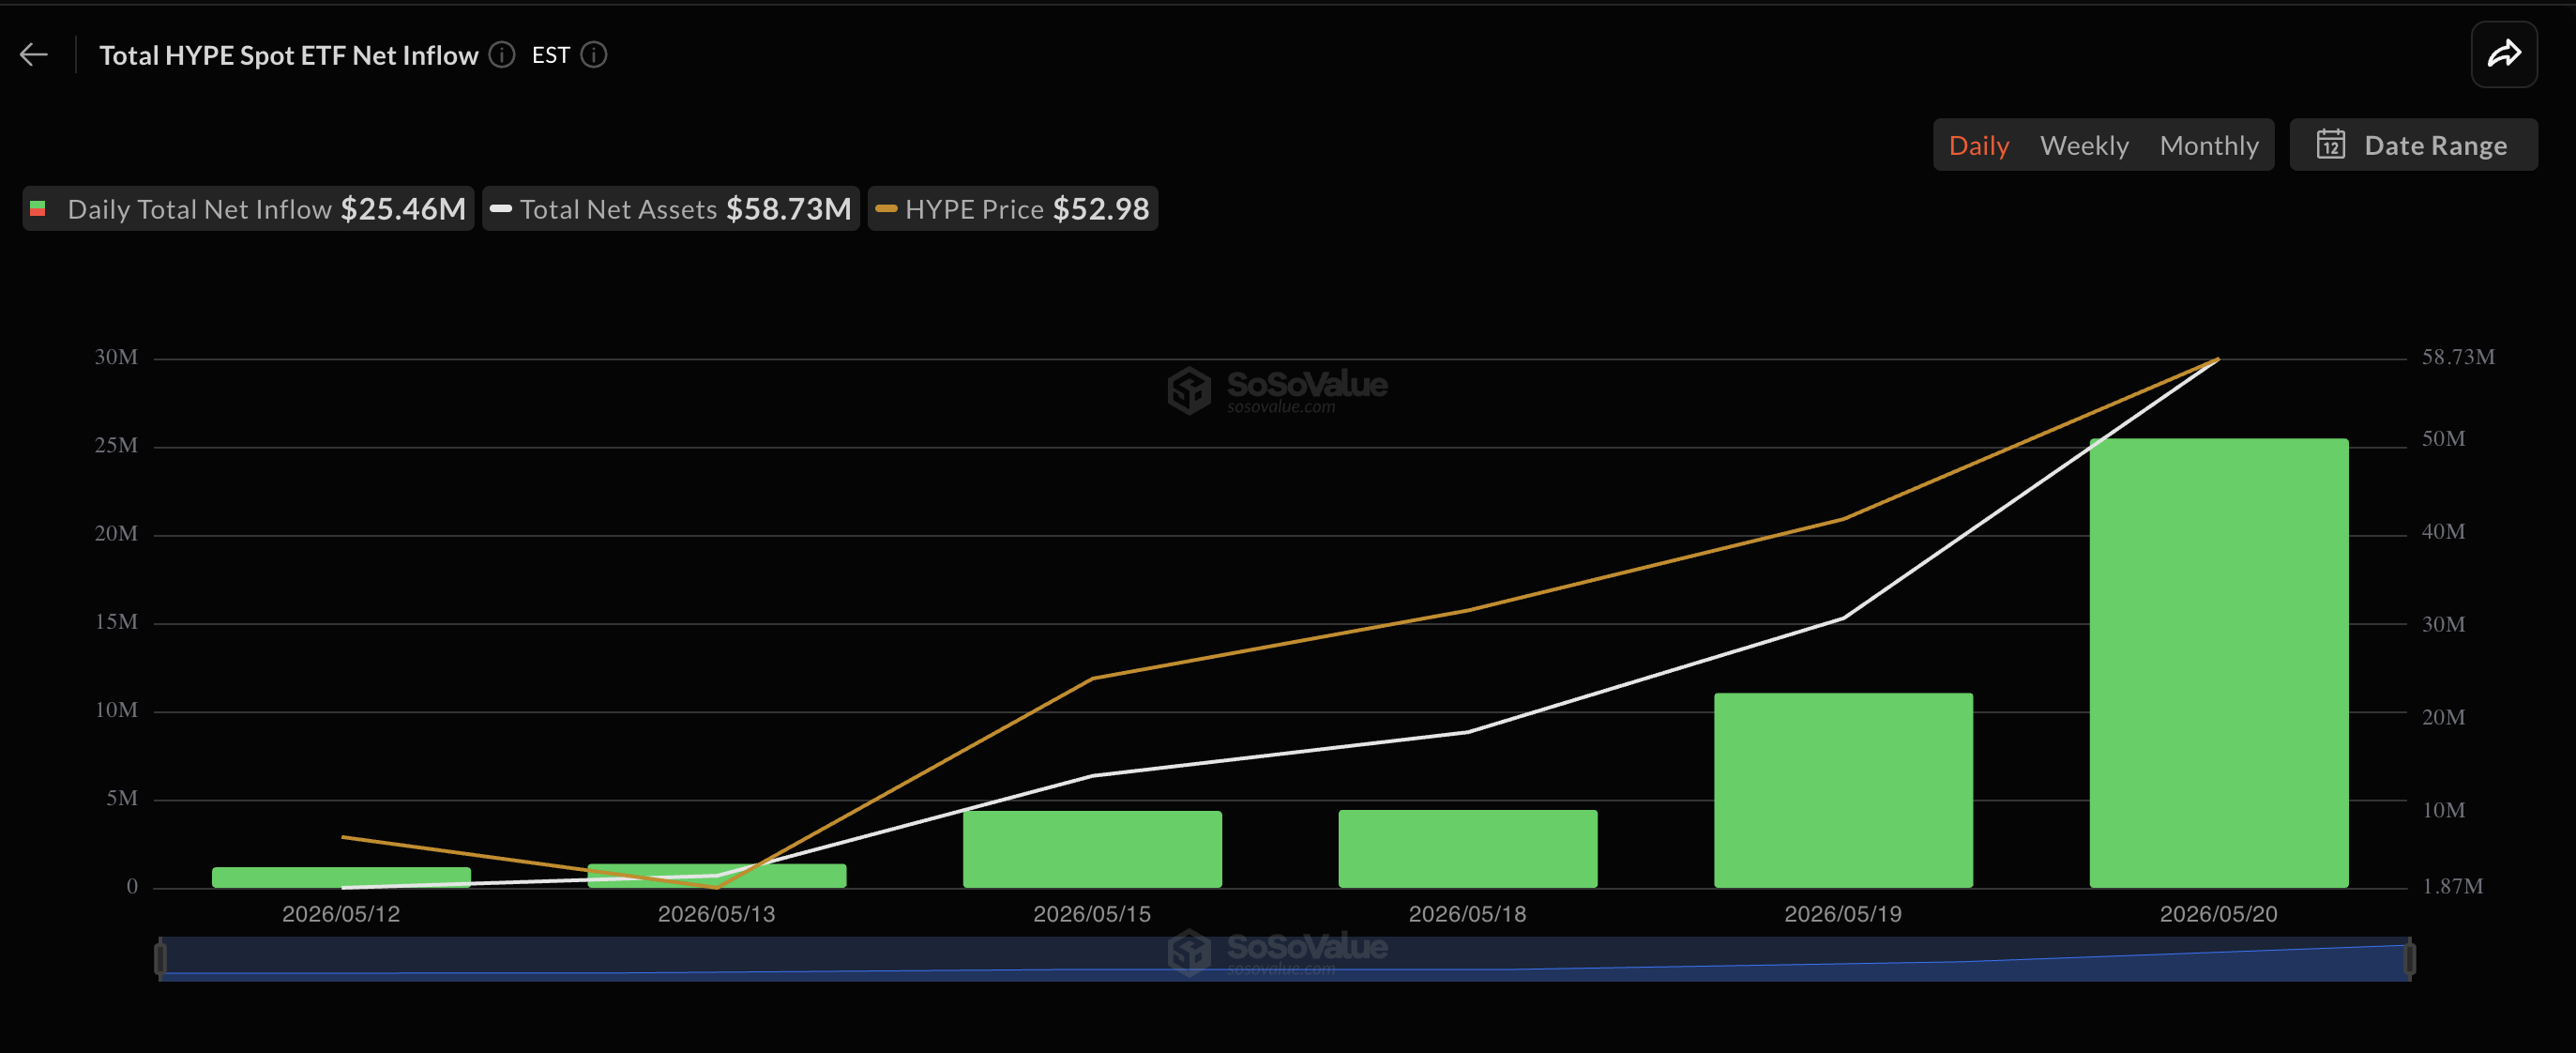
US spot HYPE ETFs net inflows. Source: SoSoValue
A wallet linked to Galaxy Digital bought 158,100 HYPE worth $8.8 million in two hours, while a new wallet withdrew 536,247 HYPE worth $29.87 million from Coinbase over two days, according to data resource Arkham Intelligence.
Together, they accumulated or withdrew around 694,500 HYPE, valued at nearly $38.67 million. Such moves may deepen losses for the already underwater short seller.
Related: Hyperliquid eyes 55% price rise after Silicon Valley investor’s ‘massive HYPE buy’
As of Thursday, Hyperliquid had witnessed $36.33 million in liquidations on a 24-hour rolling basis, according to CoinGlass. Shorts accounted for $34.29 million, or about 94% of the total, while long liquidations were only $2.03 million.
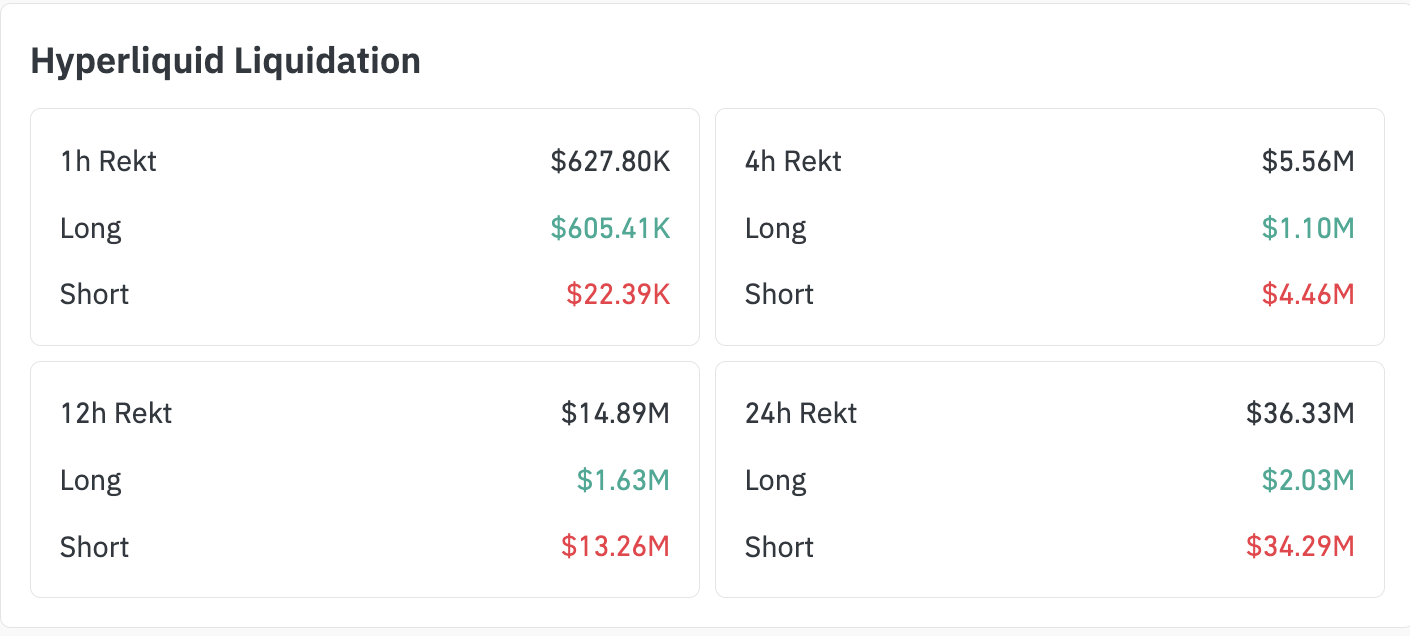
Hyperliquid liquidation data. Source: CoinGlass
That shows HYPE’s rally is heavily driven by forced short covering, increasing squeeze risk for the underwater whale if prices keep rising.
HYPE technicals hint at a 20% correction
HYPE’s rally is showing signs of upside exhaustion as the price tests the upper boundary of its ascending channel.
That resistance zone sits near $59–$60, the same area that marked HYPE’s September 2025 record high before plunging by over 65%.
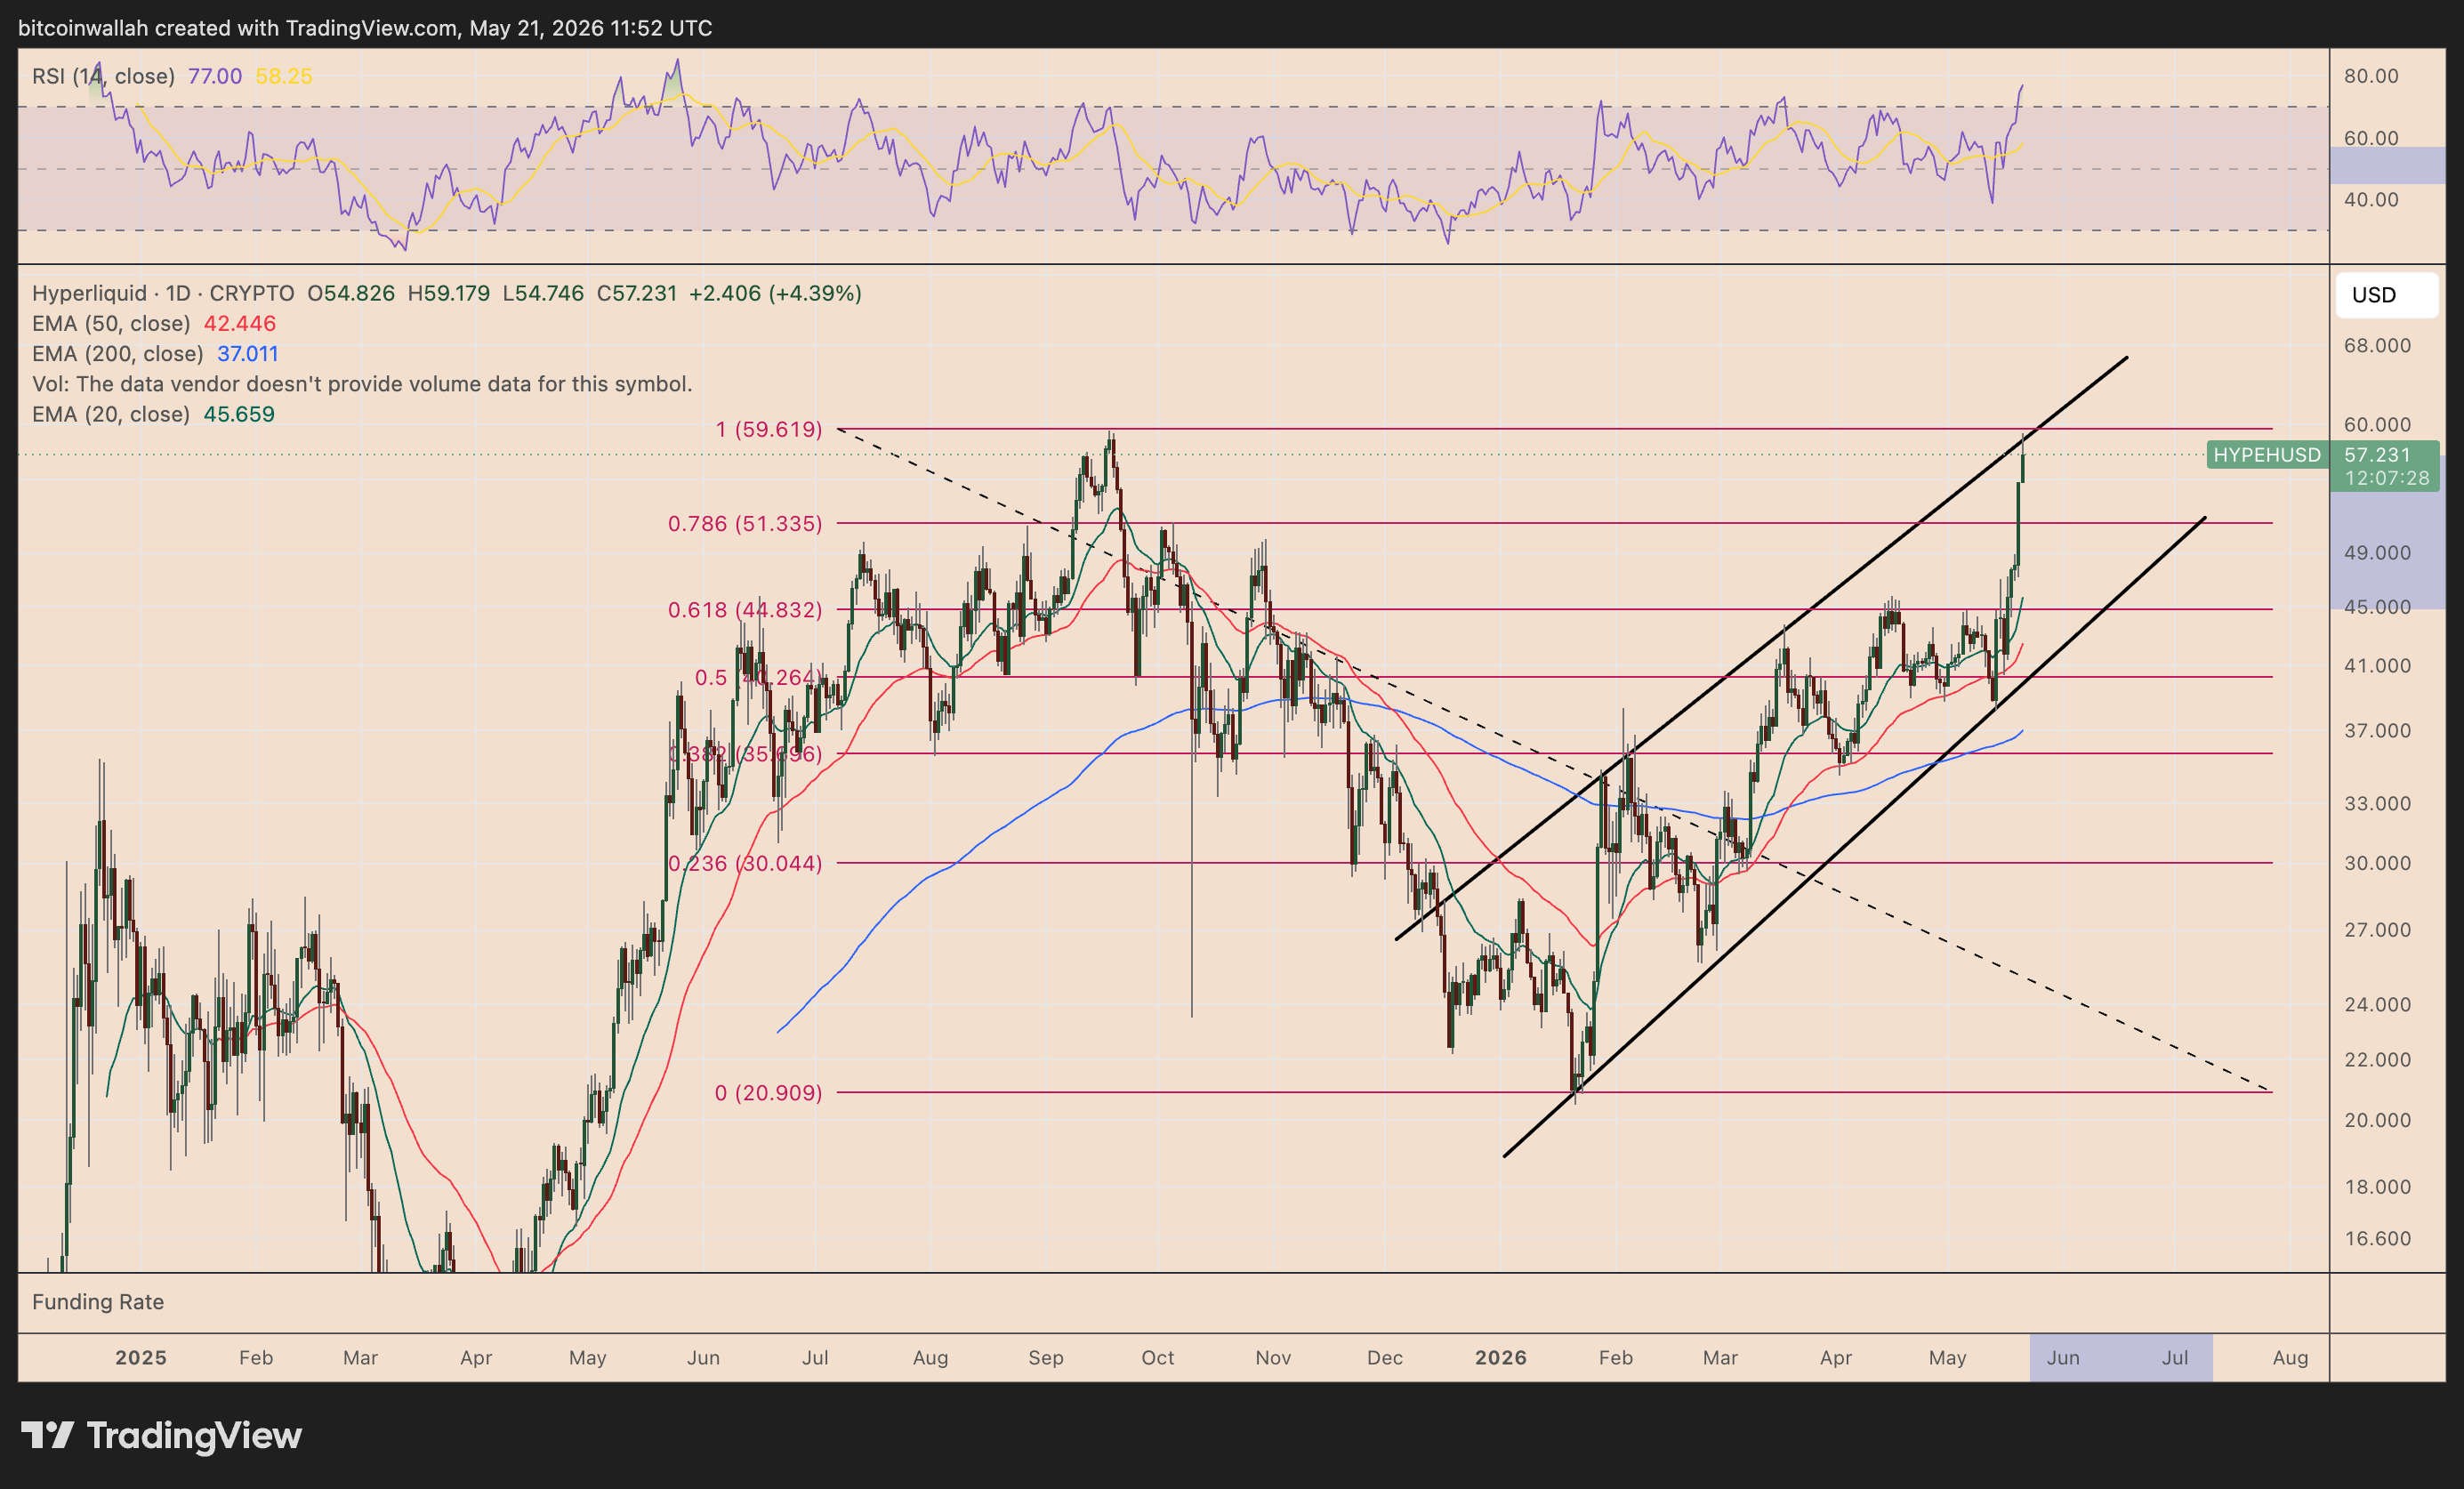
HYPE/USD daily chart. Source: TradingView
Its daily relative strength index (RSI) has also climbed to around 77, the highest level since May 2025, putting HYPE firmly in overbought territory.
A pullback from this resistance confluence could send HYPE toward the 0.786–0.618 Fibonacci retracement range, near $51.5–$45. This range aligns with the channel’s lower trend line.
In other words, HYPE price risks a decline of up to 20% from current levels if traders start taking profits near the channel top.
The short seller would recover roughly $10.4 million–$22.1 million from current levels, though the trade would only turn profitable below the $44.96 entry price, excluding funding and fees.

Crypto World
BTCC Exchange Eliminates Fees Across Every Layer of Crypto Trading in Landmark Zero-Barrier Initiative

[PRESS RELEASE – Lodz, Poland, June 18th, 2026]
BTCC, the world’s longest-serving cryptocurrency trading platform, today announced a series of zero-fee campaigns spanning deposits, spot trading, and TradFi futures. The launch represents a deliberate strategic effort to lower the barriers to entry that have historically kept retail traders on the sidelines, and to ensure that cost is never the reason a trader hesitates to participate.
The Zero-Barrier initiative targets both first-time users and seasoned traders, making it easier and more affordable than ever to move money, trade trending assets, and capture market movements on a single platform.
Zero Cost to Fund Your Account
Recognizing that every trade begins with a deposit, BTCC is ensuring that the first step costs nothing for new users looking to fund their accounts for the first time.
Users in specific regions can now deposit via Visa or Mastercard with no fees attached. Funds arrive within five minutes and no prior campaign registration is required, meaning traders can move from sign-up to making their first trades almost instantly.
For users in other regions, 0% Interac e-Transfer deposit fees are available on their first fiat deposit. By eliminating entry-level friction at the funding stage, BTCC is making it significantly easier for new users to take their first step into crypto trading without any cost.
Zero Cost From Spot to Meme Coins & TradFi Futures
Once users fund their accounts, the Zero-Barrier initiative continues. BTCC is offering a 100% spot trading fee rebate on five of the most actively traded crypto assets: BTC, ETH, XRP, SOL, and DOGE. Users who accumulate at least 50 USDT in spot trading volume during the campaign will receive a full rebate on fees of up to 2,000 USDT, allowing traders to trade major cryptos without watching fees erode their returns.
Beyond spot, the zero-fee offering extends into futures. BTCC is rolling out a permanent 0-fee promotion on selected coins, with the first phase covering DOGE, PEPE, SHIBA, and 20+ popular meme coins. As this asset class matures and attracts a growing base of active traders, removing fees from these pairs reflects BTCC’s commitment to meeting users where market interest is strongest. Eligible pairs can be accessed on the futures trading page by selecting the “0 Fee” filter.
For traders with an eye on traditional financial markets, BTCC’s TradFi 0-Fee campaign goes even further. Launched June 1, 2026, it covers all opening and closing positions across four major market categories:
- Precious and industrial metals: Gold, Silver, Platinum, Palladium, and Aluminum
- Energy commodities: Brent Crude Oil, WTI Crude Oil, and Natural Gas
- Global indices: S&P 500, Nasdaq 100, Dow Jones, FTSE 100, DAX, and Nikkei 225
- Forex and US stocks: Major currency pairs plus companies like Apple, Tesla, NVIDIA, Microsoft, and Amazon
Putting Users First
The Zero-Barrier initiative is a statement about where BTCC’s priorities lie. In an industry where fee structures have long favoured the platform over the trader, BTCC is taking a different position: that sustainable growth comes from empowering users. By removing fees at the deposit stage and across spot and futures trading, BTCC ensures users keep more of what they earn, from the first deposit to their spot and futures trades.
For information about the 0-fee campaigns, uses can visit the following official pages:
- 0 fees on Visa/Mastercard deposits
- 0 fees on Interac e-Transfer deposits
- 100% spot trading fee rebates
- 0 fees on DOGE and 20+ hot meme coins futures pairs (Select “0 Fees” filter)
- 0 fees on TradFi futures
About BTCC
Founded in 2011, BTCC is a leading global cryptocurrency exchange serving over 11 million users across 100+ countries. As the official regional sponsor of the Argentine Football Association (AFA) and with NBA All-Star Jaren Jackson Jr. as its global brand ambassador, BTCC offers secure and accessible cryptocurrency trading services, focused on delivering a user-friendly experience while adhering to applicable regulatory standards.
Official website: https://www.btcc.com/en-US
The post BTCC Exchange Eliminates Fees Across Every Layer of Crypto Trading in Landmark Zero-Barrier Initiative appeared first on CryptoPotato.


Key takeaways
- Bitcoin remains vulnerable as hawkish Federal Reserve guidance, rising Treasury yields, and inconsistent ETF demand continue to dampen investor sentiment.
- With BTC trading below key moving averages and lacking strong buying momentum, the near-term bias remains bearish.
Bitcoin (BTC) remained under pressure on Thursday, trading below the $64,000 level as investors reacted to a hawkish message from the U.S. Federal Reserve and mixed institutional demand signals.
The leading cryptocurrency continues to struggle for momentum, with risk appetite fading across financial markets after the Fed signaled a tougher policy outlook despite leaving interest rates unchanged.
Federal Reserve maintains rates but adopts hawkish tone
The U.S. Federal Reserve left its benchmark interest rate unchanged at 3.50% to 3.75% during its latest policy meeting, the first chaired by Kevin Warsh.
While the decision itself was widely expected, markets were focused on the Fed’s forward guidance and updated economic projections.
The central bank removed language suggesting a bias toward further monetary easing and instead signaled support for maintaining higher rates for longer. Policymakers now project the federal funds rate to end the year at 3.8%, up from the 3.4% forecast issued in March.
The revised outlook prompted traders to increase expectations for tighter monetary policy, with markets now pricing in nearly an 85% probability of a rate hike in December.
As a result, U.S. Treasury yields and the U.S. dollar moved higher, reducing demand for risk-sensitive assets such as cryptocurrencies.
Institutional demand for Bitcoin remains mixed, offering little support for a sustained recovery.
According to CoinGlass data, spot Bitcoin exchange-traded funds (ETFs) recorded a net outflow of $82.20 million on Wednesday, following:
The inconsistent flow pattern, coupled with a slight bearish bias, suggests institutional investors remain cautious amid macroeconomic uncertainty.
Should ETF outflows continue or accelerate in the coming sessions, Bitcoin could face additional downside pressure.
Bitcoin price outlook: Relief bounce shows signs of weakness
Recent price action indicates that Bitcoin’s rebound from oversold conditions may have been driven more by seller exhaustion than by renewed buying demand.
Bitcoin continues to trade within a bearish short-term structure and remains below several key moving averages.
BTC is currently trading below the 50-day EMA at $70,042, the 100-day EMA at $72,839, and the 200-day EMA at $78,174.
The failure to reclaim these levels reinforces the broader downtrend and highlights persistent overhead selling pressure.
Additionally, the previously broken uptrend support near $73,833 has now turned into a major resistance zone.
Technical indicators continue to favor caution. The Relative Strength Index (RSI) on the 4-hour chart remains below 50, indicating ongoing bearish momentum without yet reaching deeply oversold conditions.
The Moving Average Convergence Divergence (MACD) histogram remains slightly positive, suggesting that recent rebounds may be corrective moves within a broader bearish trend rather than the beginning of a sustained recovery.

If Bitcoin attempts a rebound, traders will likely focus on several major resistance zones. The first major resistance at $64,004 could pave the way for higher hurdles at $70,042 – 50-day EMA
A move above these levels would be required to significantly improve the technical outlook.
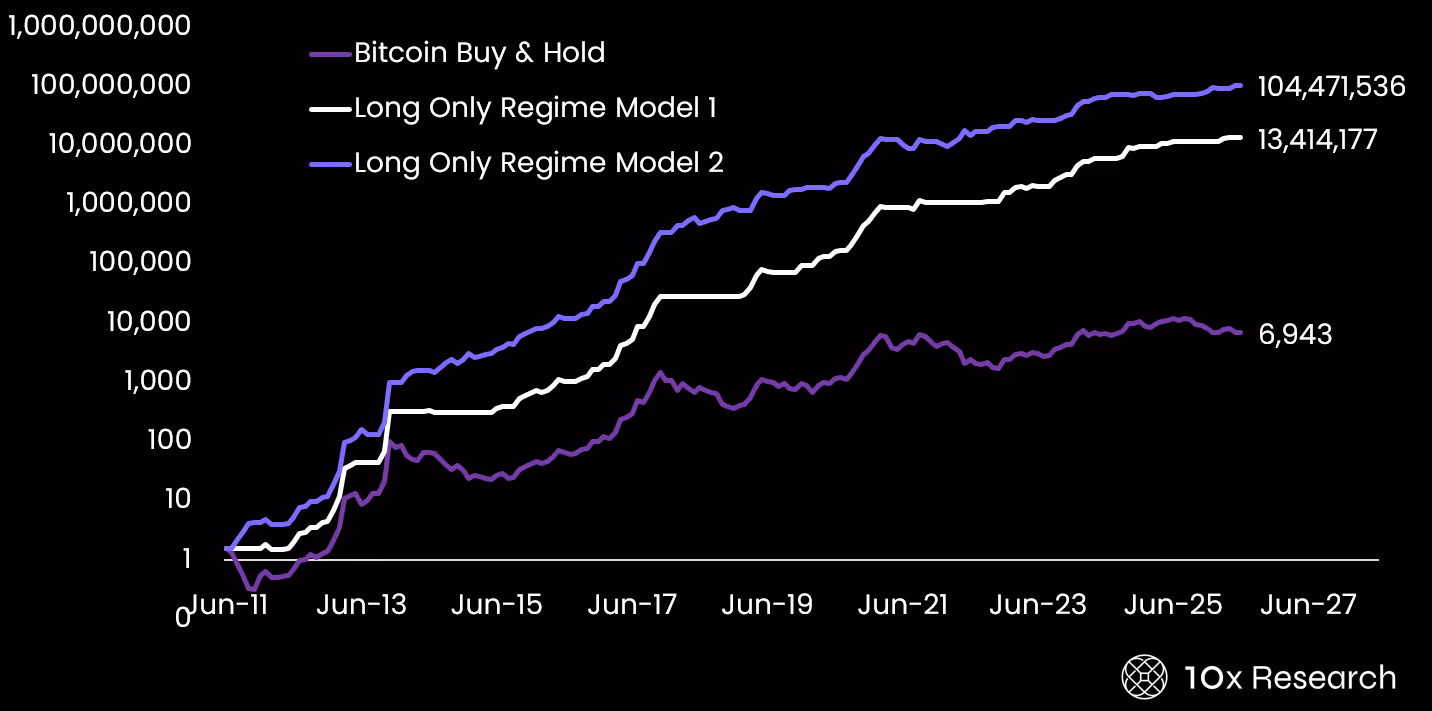
The win rate of a cycle-aware approach is lower than buy-and-hold, winning not by being right more often, but by avoiding the months when bitcoin loses 20%, 30%, or 40%. Those months cluster, and stepping aside during them is not timing the market; it is about reading the cyclical structure of the asset.
We have made three public, timestamped market calls since 2022: the October 2022 cycle bottom, the July 2023 projection of a $125,000 target and the October 2025 bear signal, each grounded in the same signal framework. The methodology is not infallible. But it is systematic, auditable and structurally better suited to bitcoin’s cyclical nature than the passive approach most advisors currently deploy.
Bitcoin rewards those who understand its cycle. Advisors who treat it like any other asset are leaving risk-adjusted returns on the table and exposing clients to drawdowns that, in practice, end portfolios rather than weather them.

– Markus Thielen, CEO, 10x Research
Ask an Expert
If blockchain technology succeeds, are investors owning the right things?
For years, investors assumed that if a blockchain ecosystem grew, its native token would naturally appreciate. Increasingly, I’m not convinced that’s always true. Technology can become indispensable while value accrues elsewhere to sequencers, applications, stablecoin issuers or liquidity layers.

A Strategy director has sold nearly $9 million worth of company shares over the past three months as pressure on the firm’s preferred stock offerings and concerns over future dividend funding continue to weigh on MSTR.
Summary
- Strategy director Jarrod Patten has sold nearly $9 million worth of MSTR shares over the past three months.
- QCP estimates Strategy has about 7.5 months of liquidity to support preferred stock dividend payments.
- Bernstein maintained its $450 MSTR price target despite the stock falling roughly 31% over the past month.
According to a recent filing with the U.S. Securities and Exchange Commission, Strategy director Jarrod Patten exercised options to acquire 1,500 Class A shares at a strike price of $18.236 and immediately sold them on the open market at roughly $134 per share, generating a profit of around $200K.
The transaction adds to a steady pattern of insider selling. SEC filings show Patten has disposed of 55,750 MSTR shares during the last three months, with total proceeds approaching $9 million. His latest sale comes as Strategy stock remains under pressure following a sharp decline in both Bitcoin and the company’s preferred securities.
Following the transaction, Patten still holds 28,406 Class A shares, positions across several Series A perpetual preferred stock offerings, and 44,250 unexercised director stock options.
Dividend concerns have moved into focus
Attention has increasingly shifted toward Strategy’s ability to support dividend obligations tied to its preferred stock products.
According to market maker QCP, Strategy’s current liquidity position can fund dividend payments for roughly seven and a half months.
As crypto.news reported, QCP said the company could eventually face a decision between raising additional capital, diluting shareholders further, or selling Bitcoin if alternative funding sources become less attractive.
The concern emerged shortly after Strategy completed several balance-sheet transactions. QCP noted that the company repurchased nearly $1.5 billion of convertible notes due in 2029 while raising approximately $200 million through MSTR stock sales. Part of those proceeds was later used to acquire another $100 million worth of Bitcoin.
Investor attention has also centered on Strategy’s preferred securities. STRC, the company’s Stretch preferred stock, recently fell to a record low of $89, leaving it about 11% below its intended $100 value and increasing scrutiny of the firm’s capital structure.
Earlier this month, Strategy disclosed the sale of 32 BTC valued at approximately $2.5 million to fund STRC dividend payments. The transaction marked the first known Bitcoin sale by the company after years of maintaining a strict accumulation strategy.
Analyst targets remain unchanged despite weakness
Selling activity by company insiders has continued throughout 2026. Earlier filings showed Chief Executive Officer Phong Le, Chief Financial Officer Andrew Kang, and former Executive Vice President Wei-Ming Shao collectively sold millions of dollars’ worth of MSTR shares in March. Kang and Patten reduced their holdings as the stock weakened despite record highs in major U.S. equity indexes.
MSTR closed 5.09% lower at $116.56 on Wednesday as risk assets weakened after the Federal Reserve kept interest rates unchanged at 3.50% to 3.75% while signaling potential tightening risks for 2026. The stock extended its decline on Thursday, falling another 2.1% to $114.04. With those losses, MSTR is now down roughly 31% over the past month.
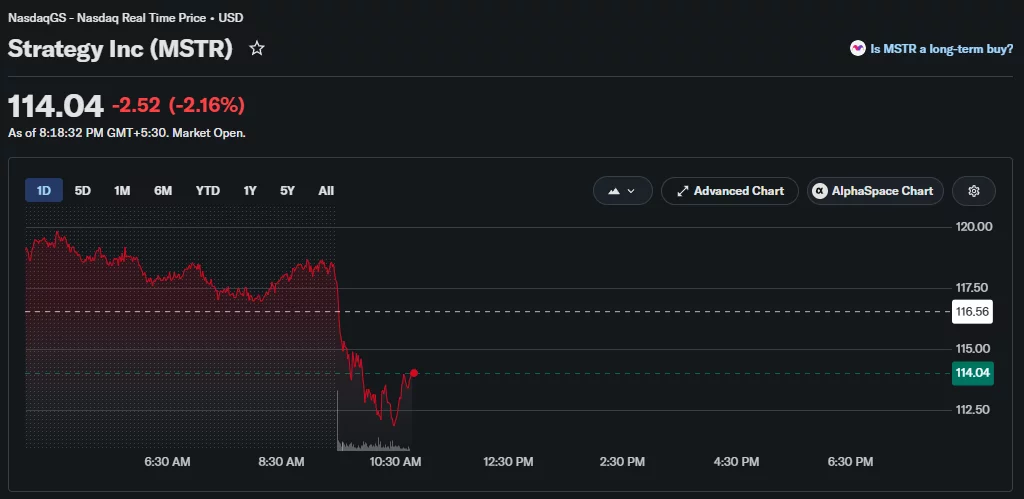
Meanwhile, Bitcoin traded near $63,850 at press time after dropping nearly 2% in the past 24 hours.
Despite the recent decline, analysts at TD Cowen, Citigroup, Bernstein, and BTIG have maintained their existing bullish ratings on MSTR shares. Bernstein analysts reiterated a buy rating and kept a 12-month price target of $450, while TD Cowen targets $350, Citigroup holds at $260, and BTIG maintains a target of $250.

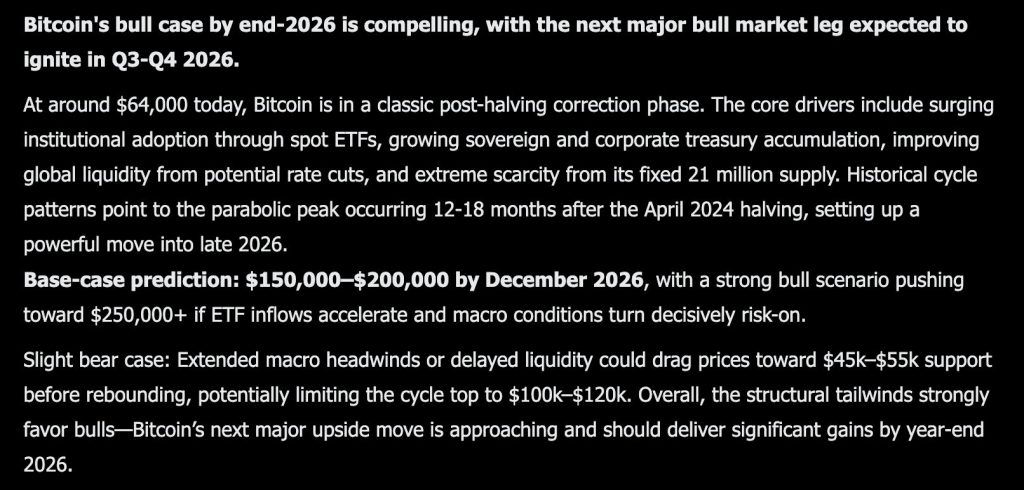
There is a specific phrase in this prediction worth sitting with for a second, classic post-halving correction phase. Elon Musk’s Grok AI is not predicts the current chart as weakness or trend failure.
It is describing it as a known stage in a known cycle, one that has historically resolved into the most explosive part of the entire bull market. At $64,000, that framing is the difference between fear and patience, and Grok is firmly on the side of patience.
The base case is $150,000 to $200,000 by December 2026, with a strong bull scenario stretching past $250,000 if ETF inflows accelerate and macro conditions turn decisively risk-on.
That is a 2.3x to over 3.9x move from here, built on the same drivers that have shown up across nearly every major prediction in this series.
Surging institutional adoption through spot ETFs, growing sovereign and corporate treasury accumulation, improving global liquidity from potential rate cuts, and the hardest variable of all, a fixed 21 million coin supply that gets more scarce by the day.
What makes Grok’s case distinct is the historical anchor. Cycle patterns point to the parabolic peak landing 12 to 18 months after the April 2024 halving, which places the ignition point squarely in Q3 to Q4 2026, right where the prediction sets its target window.
The bear case is treated as a detour rather than a derailment. Extended macro headwinds or delayed liquidity could drag prices toward $45,000 to $55,000 support before rebounding, potentially capping the cycle top at $100,000 to $120,000 instead of six figures beyond that.

Even Grok’s pessimistic scenario keeps Bitcoin meaningfully higher than today, which tells you how asymmetric this setup looks from where price currently sits.
Bitcoin Price Prediction: The Floor That Keeps Refusing To Break
BTC is at $64,042 today, sitting almost exactly where it traded back in February after the post-ATH selloff first hit. That repetition matters.
This is now the third distinct test of the $60,000 to $64,000 zone since the all-time high near $128,000 last October, and each prior test produced a recovery rather than a breakdown.
Markets that keep finding buyers at the same level over many months are telling you something about where real demand sits, and this zone has earned that credibility through repetition rather than a single bounce.
The overhead picture is where the real test lives. Every recovery attempt since the October peak has stalled somewhere between $80,000 and $96,000, a wide band of resistance built from trapped buyers at multiple failed breakouts.
For Grok’s six figure thesis to gain real traction on the chart, Bitcoin needs to clear that entire zone decisively rather than just poke through it temporarily, the way it did briefly in October before reversing hard.
The RSI sits at 37.63 with the signal line at 31.33, a gap of just over 6 points, modest compared to some of the sharper divergences seen elsewhere in this series but still meaningfully positive.
Momentum dipped into the high 20s during the June low and has since climbed back above its average without yet reaching neutral, which is consistent with a market still digesting the correction phase Grok describes rather than one already accelerating into a new leg.
That is actually the more honest signal here. The chart is not yet shouting bull market. It is quietly suggesting the bleeding from this correction has slowed, which is precisely the stage that should come before the launch Grok is calling for in the back half of the year.
Discover: The Best Token Presales
You Might Like What Grok AI Predicts About LiquidChain
The rotation is happening now. Most people will only spot it in hindsight.
Large-cap crypto isn’t failing. It’s capped. Bitcoin, Ethereum, and XRP have pressed against the same resistance bands for weeks, and the macro tailwinds keep getting pushed back a quarter. Holding assets whose upside depends on someone else’s catalyst isn’t a strategy. It’s waiting.
Capital that has survived enough cycles moves before the destination becomes obvious, not after.
Early-stage infrastructure runs on different math. A market cap small enough turns a modest rotation into a sharp price move. The asymmetry exists because the market hasn’t priced in what’s being built yet, and the gap between current valuation and actual worth is where the return comes from.
Multi-chain fragmentation drains real money out of DeFi every day. Bitcoin, Ethereum, and Solana operate as isolated liquidity systems with no native connection between them. Anyone moving value across ecosystems pays for that isolation directly, in fees, slippage, and failed transactions.
LiquidChain folds all three networks into a single execution layer. One deployment reaches the full ecosystem. No tax on crossing between chains.
The market hasn’t found this yet. That’s the point.
The presale sits at $0.01454, with just over $840,000 raised. Ground floor isn’t marketing language here; it’s a literal description of where the project sits in its lifecycle.
Execution is unproven. Adoption is unknown. Those risks are real and worth stating plainly. Established assets offer a smoother climb toward a ceiling the market can already see. This is an earlier seat at a table nobody has built yet.
Explore the LiquidChain Presale
The post Elon Musk Grok AI Predicts Explosive Bitcoin Price by The End of 2026 appeared first on Cryptonews.
Anthropic and India’s Sarvam AI build rival artificial intelligence (AI) systems on different continents. Yet the two labs are quietly tied together, and the connection has nothing to do with their technology.
The link sits inside their cap tables. The same global investors that fund the maker of Claude have also placed money into India’s most prominent AI startup.
Lightspeed Anchors Both Companies
Lightspeed Venture Partners led Anthropic’s $3.5 billion Series E round in March 2025. The financing valued the Claude maker at $61.5 billion.
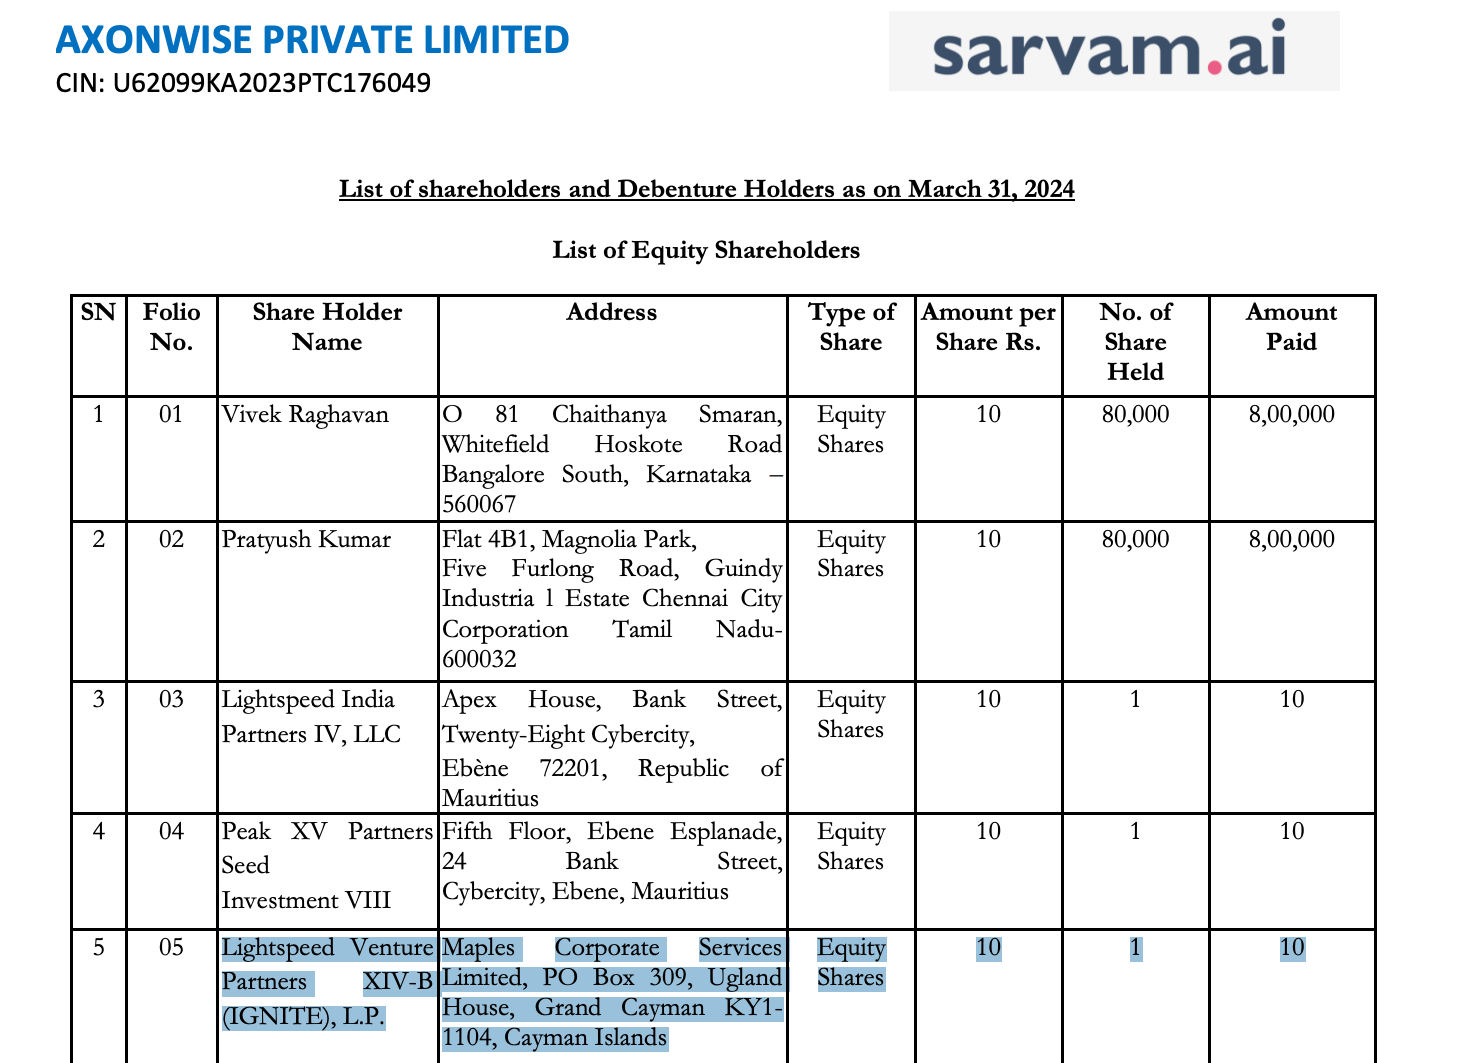
Indian corporate filings tell a parallel story. Lightspeed entities hold equity shares, preference shares, and convertible debentures in Axonwise Private Limited.

Axonwise is the legal entity behind Sarvam AI, which recently raised $234 million at a $1.5 billion valuation. Vivek Raghavan and Pratyush Kumar founded the company in 2023. Therefore, the same firm anchors a frontier US lab and an Indian challenger at once.
Follow us on X to get the latest news as it happens
General Catalyst’s Indian Backdoor
General Catalyst’s link to Sarvam runs through an acquisition. In 2024, the firm linked up with Venture Highway, an India-focused seed investor.
Venture Highway Fund III holds Series A convertible debentures in Sarvam. General Catalyst also backs Anthropic and Mistral AI in France. That places it across three of the most-watched AI labs.
Besides Anthropic, the same filings tie Sarvam to OpenAI as well. Khosla Ventures holds Sarvam equity and Series A preference shares. The firm was OpenAI’s first venture capital investor.
The shared backers do not make the AI firms partners. However, they show how concentrated AI funding has become. The same names increasingly decide which labs scale, from San Francisco to Bengaluru.
Subscribe to our YouTube channel to watch leaders and journalists provide expert insights
The post Anthropic and Sarvam AI Share Something Beyond Their Focus on AI appeared first on BeInCrypto.
Ripple continues to strengthen its ecosystem by inking strategic deals, participating in major investments, and announcing important news.
Despite these positive developments and the solid institutional interest, XRP has dumped hard over the past several months and currently trades nearly 70% below its all-time high registered last summer.
All the Latest Stuff
Earlier this week, Gate.io (one of the leading cryptocurrency exchanges) added the XRP/RLUSD trading pair on its platform, thus embracing both of Ripple’s assets. The company’s native token is available on almost all major trading venues, while the stablecoin has also been on a tear lately.
Not long ago, Mastercard expanded its infrastructure to allow merchants and partners to settle transactions in various cryptocurrencies, including RLUSD. Other well-known entities that have enabled users’ access to the financial product include OKX, Binance, Kraken, and more.
Ripple also made a strategic investment in Flutterwave (a leading payments company in Africa), with the deal aiming to integrate RLUSD into the organization’s infrastructure.
The upgrade of the XRP Ledger has drawn attention, too. According to the X account BSCN, the underlying technology powering XRP will be improved to mitigate quantum computing risks and support the emerging AI economy.
“The plan includes hybrid signature technology that can switch to stronger protections if needed. The initiative has been in development since 2024. Executives say the goal is to attract major financial institutions to the network,” the post reads.
Hollywood and Ripple
The company’s annual conference, Ripple Swell, which gathers leaders from traditional finance, the crypto world, and XRP enthusiasts, will take place in New York at the end of October.
This year, the event will be attended by one of Hollywood’s most popular actors, Matt Damon. The Oscar winner, who is a co-founder of Water.org, will tell participants how his organization is leveraging Ripple’s payment system and RLUSD to accelerate money movement and drive real-world impact across Asia, Africa, and Latin America.
The ETF Front
Institutional interest in XRP remains strong, with inflows into spot XRP ETFs continuing to surpass outflows. This indicates that pension funds, hedge funds, and other conservative investors keep increasing their exposure to the asset, thereby laying the groundwork for a potential price surge.
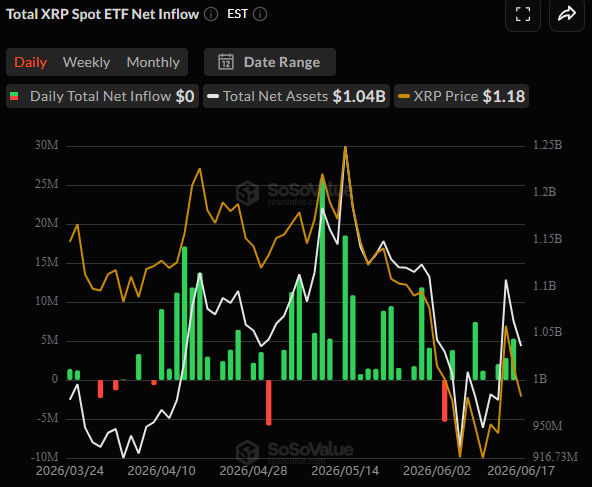
It is worth noting that spot BTC and ETH exchange-traded funds don’t enjoy the same investor interest and have been heavily bleeding in recent months.
XRP Price Outlook
Even with this progress, XRP has fallen by about 15% over the past month, mirroring the broader crypto market’s bearish trend. It currently trades at around $1.16, and some analysts believe a further decline could be on the way.
X user Sjuul | AltCryptoGems claimed that XRP is “again in trouble,” adding that if bulls don’t save the next support at $1, “things might get even more ugly.”
On the other hand, the whales’ activity suggests a rebound might come next. As CryptoPotato reported, wallets holding at least 1 million XRP have acquired more than 1.5 billion XRP in the last six months, indicating strong conviction and perhaps preparing for the next bull run.
The post Ripple (XRP) News Today: June 18 appeared first on CryptoPotato.
Crypto World
Iren (IREN) Stock Surges on Jefferies Buy Rating: AI Infrastructure Play Gains Momentum

TLDR
- Jefferies launched coverage of Iren (IREN) with a Buy recommendation and $79 price objective; shares were hovering near $58.11.
- The stock rallied approximately 5% during premarket hours Thursday after the bullish analyst report.
- Analysts emphasized IREN’s approximately 6 gigawatt land portfolio and fully integrated GPU cloud infrastructure.
- The firm has secured a five-year, $9.7 billion agreement with Microsoft and a $3.4 billion Nvidia AI cloud partnership, aiming for $3.1 billion in yearly recurring revenue.
- Revenue at IREN surged 105% in the trailing twelve-month period as the business shifted from cryptocurrency mining operations to AI infrastructure services.
Shares of Iren (IREN) gained approximately 5% during Thursday’s premarket session following Jefferies’ initiation of coverage featuring a Buy recommendation and a price objective of $79. Trading around $58.11 when the coverage began, the target represents potential upside of roughly 36%.
Jefferies analyst Jonathan Petersen spearheaded the coverage launch, emphasizing IREN’s standing as a fully integrated AI cloud infrastructure company backed by an extensive powered land portfolio spanning approximately 6 gigawatts.
The investment firm underscored IREN’s strategic partnerships with Microsoft and Nvidia as fundamental pillars supporting the bullish thesis. Combined, these agreements are projected to generate $3.1 billion in recurring annual revenue.
The Microsoft partnership encompasses a five-year arrangement valued at $9.7 billion for Nvidia GB300 GPU infrastructure, centered at IREN’s 200 MW Childress location. The deal structure features a $1.9 billion advance payment alongside $3.65 billion in GPU financing carrying approximately 6% interest.
According to Jefferies, this framework enables IREN to recover its $8.8 billion capital outlay during the contract period, delivering unlevered internal rates of return above 20%.
Additionally, IREN maintains a distinct $3.4 billion AI cloud partnership with Nvidia. Jefferies noted these strategic relationships position IREN alongside industry players like CoreWeave (CRWV) and Nebius (NBIS) in the competitive landscape.
Transformation From Cryptocurrency Mining to AI Cloud Services
IREN originally operated predominantly as a Bitcoin mining operation. The organization has successfully transitioned into a vertically integrated AI cloud infrastructure provider, a transformation Jefferies characterized as a “compelling strategic pivot.”
Revenue climbed 105% during the trailing twelve months, demonstrating the velocity of this operational shift.
Controlling its own real estate and data center facilities provides IREN with operational agility to accommodate diverse customer requirements — ranging from powered shell environments to comprehensive GPU cloud implementations, according to Jefferies.
Geographic Growth Into European and Australian Markets
Beyond its current operations in the United States, IREN recently finalized the purchase of Ingenostrum, S.L., operating as Nostrum Group, a Spanish AI data center developer. This transaction delivers approximately 490 megawatts of secured, grid-connected capacity and represents IREN’s inaugural expansion into Europe.
IREN has also executed a transmission connection agreement for a projected 800 MW data center facility in Bundey, South Australia — anticipated to rank among the largest data center installations across the Asia-Pacific geography.
After the Australian development announcement, B. Riley elevated its price target on IREN to $96 while maintaining a Buy rating. Macquarie reaffirmed an Outperform stance with a $90 price objective.
Needham has adopted a more conservative perspective, reducing its financial estimates for IREN based on expectations of a slower AI cloud revenue acceleration extending through calendar year 2026 and diminished forecasts for Bitcoin-related contributions.
The stock has delivered approximately 493% returns over the preceding twelve-month period.

US President Donald Trump took it to his social media platform Truth Social to declare that oil has begun flowing, jobs are at record levels, and prices in the US are dropping, which will increase affordability.
While there are some controversies about the last few statements, oil prices are indeed dropping now, with USOIL dipping below $73 per barrel.

Today’s decline to $73 and just under it means that USOIL has dropped by roughly 40% since the peak after the war broke out at almost $120 per barrel. However, its price is yet to reach the lows before the US and Israel started the war against Iran.
Trump also said Iran “can never have a nuclear weapon,” which will make the world safer, as part of the Iran-US deal that is reportedly agreed to, but it’s still not signed.
The POTUS also bragged that the “stock markets are roaring, jobs are at records, and prices are dropping (affordability). He explained that the US is “strong, safe, and respected like never before.” He ended his statement with, “YOU’RE WELCOME!”
It’s worth noting that the US CPI numbers for the past two months hit multi-year highs, so the decline in prices and rising affordability have yet to be proven. The US stock market is close to its record level, but not quite there.
Bitcoin’s price, on the other hand, has followed USOIL’s path south in the past 24 hours. Yesterday’s decline was mostly attributed to the US Fed refusing to change the rates and the new Chairman’s hawkish stance.
Today, though, BTC dipped once again to $63,600 after Trump’s statement went live. Although it rebounded to $64,200 immediately, it was stopped once again and now sits well below $64,000.
The post Trump Says ‘You’re Welcome’ as Oil Is Flowing and Prices Are Dumping appeared first on CryptoPotato.


U.S. regulators have proposed requiring certain payment stablecoin issuers to verify customer identities under a new rule issued as part of the GENIUS Act framework.
Summary
- U.S. regulators have proposed requiring certain payment stablecoin issuers to adopt customer identification programs similar to those used by banks and credit unions.
- The proposed GENIUS Act rule would require issuers to verify customer identities while treating permitted payment stablecoin issuers as financial institutions under the Bank Secrecy Act.
- Regulators said secondary market stablecoin transactions generally would not trigger customer identification requirements, limiting the rules to direct relationships between issuers and customers.
The Federal Reserve Board said Thursday that it is seeking public comment on a joint proposal that would require covered stablecoin issuers to maintain effective Customer Identification Programs, or CIPs.
The proposal was issued alongside the Financial Crimes Enforcement Network, the Federal Deposit Insurance Corporation, the Office of the Comptroller of the Currency, and the National Credit Union Administration.
An 117-page notice published by the agencies said the rule would implement provisions of the Guiding and Establishing National Innovation for U.S. Stablecoins Act, known as the GENIUS Act. The proposal would formally treat permitted payment stablecoin issuers as financial institutions under the Bank Secrecy Act and require them to maintain customer identification procedures.
Comments on the proposal will be accepted for 60 days after publication in the Federal Register.
Rule would apply bank style identity checks to stablecoin issuers
The agencies said permitted payment stablecoin issuers would need to collect and verify customer information before opening an account relationship. Required information would generally include a customer’s name, address, date of birth or formation, and identification number.
The proposal would require issuers to adopt risk-based procedures designed to establish a reasonable belief that they know the true identity of each customer. Regulators said those procedures should take into account an issuer’s size, business model, customer base, account types, and methods used to open accounts.
“This is the next step to ensure that permitted payment stablecoin issuers are fully integrated into Bank Secrecy Act regulations,” NCUA Chairman Kyle Hauptman said, adding that the proposal mirrors existing customer identification requirements used by credit unions and sets standards for identifying and verifying account holders.
“It sets clear standards for identifying and verifying account holders and safeguards the interests of credit unions and their members. By establishing robust customer identification requirements, we are reinforcing our commitment to preventing money laundering and terrorist financing in our financial system.”
The proposal follows earlier NCUA rulemakings related to payment stablecoins. The agency said it issued a proposed rule last month covering operational and risk management standards for licensed payment stablecoin issuers and released a separate proposal in February 2026 governing applications from issuers under its jurisdiction.
Regulators exclude most secondary market transactions
The proposed rule draws a distinction between direct dealings with a stablecoin issuer and transactions that occur elsewhere in the market.
Regulators said customer identification requirements would apply when a user establishes a formal relationship with a permitted payment stablecoin issuer through activities such as issuance, redemption, custody, reserve management, or other authorized services.
The agencies also proposed that simply holding or transferring a payment stablecoin would not create an account relationship with the issuer. The document states that secondary market activity, including transfers between users and transactions conducted through intermediaries, generally would not trigger customer identification obligations for the stablecoin issuer.
The agencies said applying customer identification requirements to every stablecoin transfer could be impractical because issuers often do not have direct relationships with users participating in secondary market transactions.
The proposal arrives days after a bipartisan group of U.S. senators urged the Treasury Department to preserve a role for state regulators under the GENIUS Act. In a June 16 letter to Treasury Secretary Scott Bessent, lawmakers led by Senator Cynthia Lummis asked Treasury to provide clearer guidance on how states can obtain certification for their own stablecoin regulatory frameworks.
The GENIUS Act allows issuers with no more than $10 billion in outstanding stablecoins to operate under certified state regulatory regimes. The customer identification proposal states that its requirements would apply not only to federally supervised issuers but also to stablecoin issuers operating under eligible state frameworks established under the law.

Brexit has cut trade in almost every sector of the UK economy, study warns
Sebi board to consider reintroducing open-market window for buybacks on Friday
BTCC Exchange Eliminates Fees Across Every Layer of Crypto Trading in Landmark Zero-Barrier Initiative


-

 Business4 days ago
No Jackpot Winner as $257 Million Prize Rolls Over to $269 Million Monday Draw
-

 Fashion6 days ago
Weekend Open Thread: Tuckernuck – Corporette.com
-

 Crypto World7 days ago
Oppenheimer backs SpaceX as $70 billion retail frenzy builds
-

 Crypto World7 days ago
Markets Rally as SpaceX IPO Looms Amid Iran Tensions and Inflation Surge
-
 Crypto World4 days ago
Zimbabwe Requires Crypto Businesses to Register Annually Under New FIU Regulations
-

 Crypto World5 days ago
Bitget enters Argentina’s regulated crypto market through PSAV registration
-

 Tech6 days ago
NanoClaw integrates JFrog registries to secure AI agent downloads
-

 NewsBeat7 days ago
El Nino has formed in the Pacific and could set records, forecasters say
-

 Tech6 days ago
This Week In Security: Microsoft On Microsoft, Register Your Domains, Linux On ARM, And FreeBSD Joins The File Cache Club
-
 Entertainment7 days ago
Donnie Wahlberg & More Heat Up Las Vegas at Circa’s Barry’s Downtown Prime
-
 Tech7 days ago
Opendoor Ends India Operations, Fueling a Bigger Conversation About AI and Outsourcing
-

 NewsBeat6 days ago
FBI searches office of Ohio voter registration group
-

 Business7 days ago
AT&T: Verizon's 27% Outperformance Sets Up A Solid Entry Point
-
 Tech7 days ago
Anthropic is spending $150M to embed 1,000 AI fellows inside nonprofits. No degree required.
-
 Entertainment7 days ago
‘The Pitt’s Fan-Favorite Doctor Confirms Noah Wyle Gave His Blessing to Return [Exclusive]
-

 Tech7 days ago
Klipsch Heritage First Listen at High End Vienna 2026: Rebellion, OJAS and Klipschorn Bring the Horns
-
 Crypto World7 days ago
Ripple and Bitso Bring MXNB Stablecoin to XRP Ledger
-

 Tech7 days ago
Former AWS CEO Adam Selipsky to lead new $10B AI data center venture
-

 Fashion7 days ago
Coffee Break: Scarf Waist Belt
-
 Entertainment4 days ago
Matt Damon’s Viral Sci-Fi Thriller Has Taken Over HBO Max
You must be logged in to post a comment Login