

Crypto World
Iran Launches Bitcoin-Settled Insurance Platform for Hormuz Strait Shipping

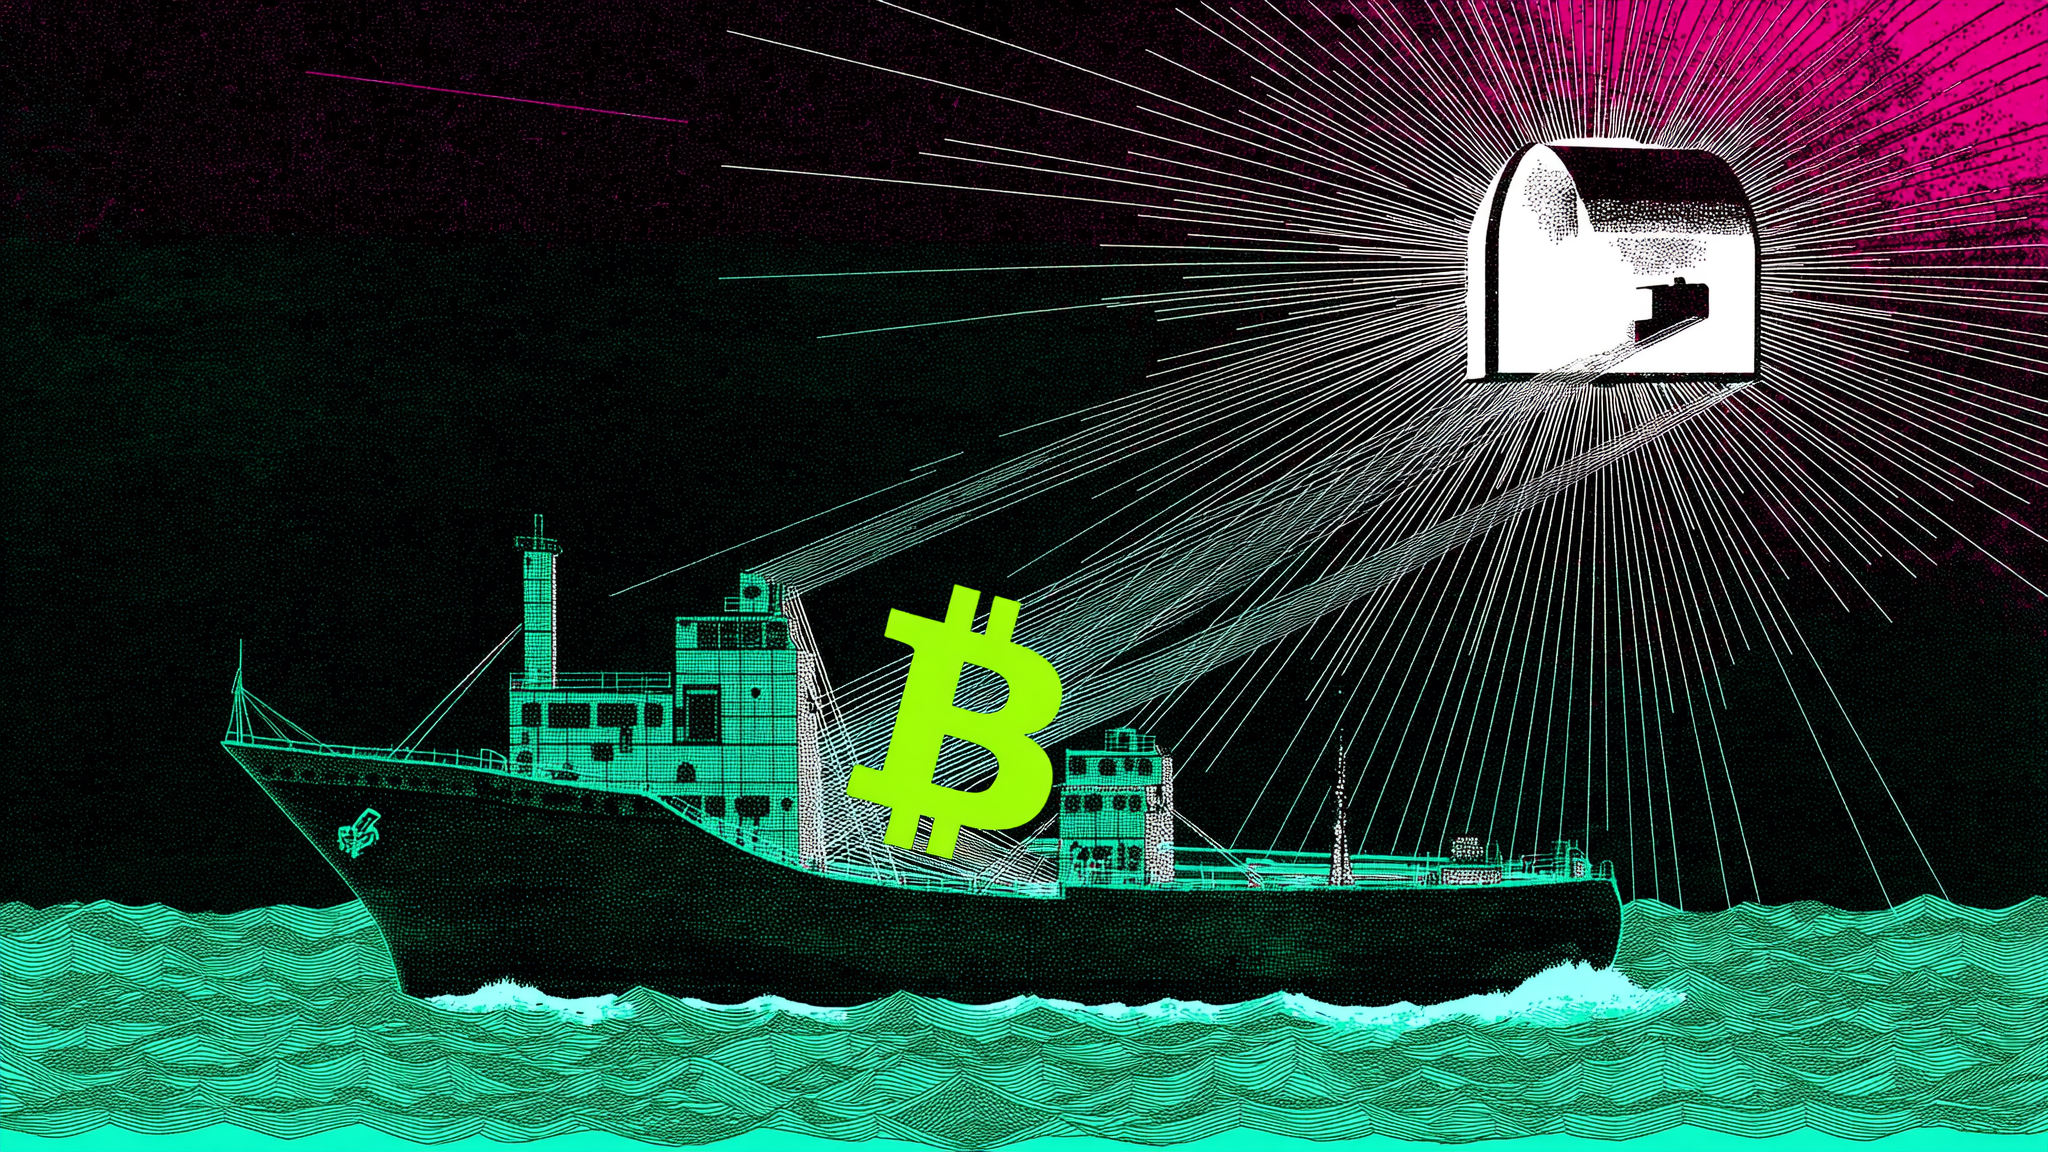
Iran has unveiled Hormuz Safe, a Bitcoin-backed insurance service enabling shipping companies to obtain coverage for transiting the Strait of Hormuz.


Circle’s USYC tokenized Treasury bill fund has reached $2.9 billion in market cap, becoming the largest T-Bill fund deployment across blockchain networks.
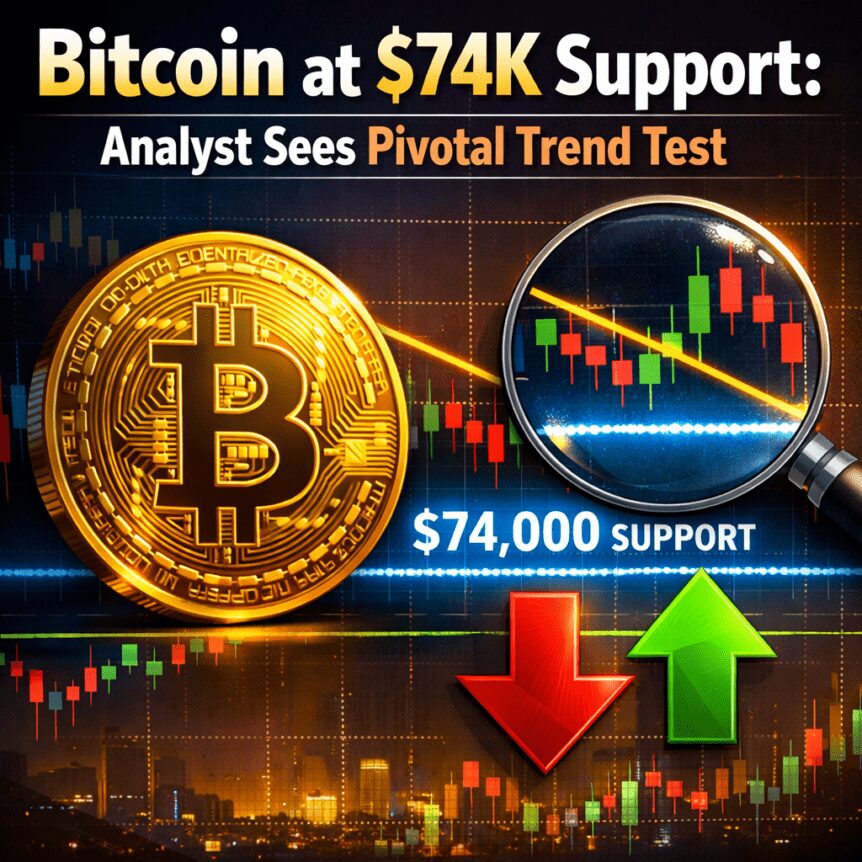
Bitcoin (BTC) gave up the $80,000 level over the weekend and now faces a historically significant battle around $74,000-$75,000. This zone has repeatedly served as a critical support floor over the past two years, and analysts say the next test could be pivotal for the ongoing bear market.
Analyst Ardi notes that the $74,000-$75,000 region has anchored BTC’s price action in multiple phases. In 2024, the zone helped cap a seven-month consolidation, and in early 2025 it provided support before Bitcoin ascended to cycle highs near $126,000. As BTC approaches this crucial band after posting a 5.78% weekly correction to roughly $77,900, the weight of the zone is reinforced by several major price pivots formed there across different timeframes.
Key takeaways
- BTC is testing a long-standing support band around $74k-$75k after dipping below $80k, a level that has repeatedly defined price stability in recent years.
- Analysts see the next retest of this zone as potentially decisive for the current bear market, given its historical role as a support anchor across multiple cycles.
- The Bitcoin market-signal framework known as the bull-bear structure index has shifted back to bearish territory after BTC failed to sustain above $82k, signaling renewed selling pressure.
- On-chain activity highlights a shift of long-term holders’ coins to exchanges, with a rising share of older BTC moving on-chain and toward selling, amplifying near-term downside risk.
- If BTC can hold the $70k-$75k neighborhood, traders see potential for a relief rally toward the mid-to-high $80k range; a break below the zone could widen the downside toward $50k-$60k.
Critical price zone under scrutiny
As BTC approaches the $74,000-$75,000 corridor, market observers emphasize the zone’s weight as a potential fulcrum for the bear market. Ardi explains that this area has repeatedly functioned as a technical anchor, shaping strategic decisions for traders looking for the next directional impulse. The recurrence of pivotal pivots near this level across multiple timeframes adds to the sense that a robust defense here could extend the downtrend, while a durable hold might set the stage for a fresh leg higher once demand returns.
Bitcoin’s recent price action—trading around $77,900 after a weekly decline—puts the market in a position where a decisive hold in the $74k-$75k zone could calm near-term downside risks and pave the way for new momentum if buyers reemerge. The narrative hinges on whether buyers can sustain a floor in this band or if sellers gain the upper hand and drive BTC into deeper correction territory.
Bearish signals strengthen as price stalls above $82k
Market signals tracking BTC’s structural balance offer a sobering read. Bitcoin researcher Axel Adler Jr. notes that the Bitcoin bull-bear structure index turned bearish again after BTC failed to maintain a run above $82,000 earlier this month. The metric aggregates six indicators—spanning ETF demand proxies, trader activity, exchange flows, and short-term momentum—to gauge whether buyers or sellers currently control the market. A positive reading points to buyer dominance, while a negative one signals growing selling pressure.
The bullish tilt proved fleeting. The index turned positive for less than three trading days, around early May when BTC flirted with $82,000. By May 17, the reading had collapsed to -23.49, underscoring a swift reversal toward seller control. This shift aligns with a broader view that fading upside momentum could be accompanied by renewed selling pressure, particularly if price fails to sustain critical levels.
On-chain dynamics reinforce this sentiment. CryptoQuant data show more BTC flowing onto exchanges from investors who bought BTC six to twelve months ago, a cohort that typically sits on significant unrealized losses when prices retreat. The analysis notes the average cost basis among this cohort sits around $110,851, suggesting many holders are vulnerable to realizing losses as prices pull back.
Historically, this reflects investors locking in major losses and exiting the market, creating severe spot-market selling pressure.
Additionally, the share of older coins moving to exchanges spiked to about 10.54%, far above the usual sub-1% threshold. Easy On Chain highlighted this pattern as a potential sign that longer-held positions are being liquidated, adding to near-term selling pressure and challenging the odds of a rapid rebound until demand returns.
For context, recent coverage around Bitcoin’s price action has also looked at potential near-term traps and the broader supply/demand balance. A linked analysis from Cointelegraph discussed a bullish trap around the mid-$70k range, underscoring how fragile the market’s immediate upside can be when tested at key levels.
What happens next: scanning the two likely paths
Traders are watching the $70,000 level as a more decisive floor. Alex Wacy, another market observer cited in the coverage, framed the possible outcomes as a bifurcation: holding the $70k zone could underpin a return to the $85,000–$90,000 range, rekindling bullish expectations if demand reasserts itself. Conversely, losing the $70k area—and notably breaking below the $74k-$75k support band—could open a path toward deeper losses, potentially targeting the $50,000–$60,000 region if the selling pressure persists and momentum fails to recover.
These scenarios reflect a market navigating a delicate balance between macro uncertainty, fading upside momentum, and shifting on-chain behavior. If buyers manage to stablize above the pivotal zone, workflow from traders, funds, and miners could align toward a renewed attempt at higher highs, possibly drawing in fresh participation and forcing a reappraisal of risk in a market that has struggled to sustain meaningful rallies since mid-2024.
The broader context remains important. The interaction between price action, on-chain movements, and market sentiment indicators suggests a market that could see either a short-lived relief rally or a renewed leg lower depending on whether buyers respond decisively around the $74k-$75k zone. As always, traders will be parsing every retail and institutional signal, while analysts emphasize that a broad macro backdrop—ranging from central bank policies to global risk appetite—will continue to shape BTC’s trajectory.
Readers should monitor the next price action near the $74k-$75k support and the $82k threshold for momentum. The next few weeks could reveal whether the bear market finds a durable floor or slides further as longer-term holders reassess risk and exit positions into strength or weakness in the spot market. For ongoing analysis and updates, keep an eye on market commentary that connects price levels with on-chain signals and fund flows, as these elements collectively illuminate the risk-reward landscape for Bitcoin in the near term.
Related reading: BTC price ‘bull trap’ at $76.5K? Five things to know in Bitcoin this week
The second-largest digital asset tumbled to its lowest level since the beginning of April, mirroring a broader market pullback triggered by escalating tensions between the US and Iran.
Many analysts warn that a deeper correction may be developing, though an important technical indicator signals a potential recovery.
Further Slump Incoming?
Several hours ago, ETH dropped below $2,100 before slightly rebounding to the current $2,150 (CoinGecko’s data), indicating a substantial 8% decrease over the past week. The renowned analyst Ali Martinez argued that the asset seems to be breaking out of another flag, underscoring the significance of the $1,100 area as a key accumulation region.
It is important to note that nearly a week ago, he described the $2,200-$2,400 range as a “no-trade zone,” claiming that only a sustained close outside this area will define “the next major move.”
Other worrying factors that Martinez has touched upon lately include the rising number of ETH tokens stored on exchanges (which increases selling pressure) and a TD Sequential indicator that flashed a sell signal.
Crypto Rover also gave his two cents. He told his 1.5 million followers on X that the ETH appears to be repeating the setup seen in 2022, suggesting the current cycle may still lie ahead. For his part, Sjuul | AltCryptoGems opined that the cryptocurrency has lost stamina, just as expected.
“Now it has receded to the lower band of the channel and is threatening to break below it. Either buyers will step in soon, or things are going to get nasty here,” he added.
The Silver Lining
Despite the bearish sentiment and broader market weakness, ETH’s Relative Strength Index (RSI) suggests an impending resurgence. The technical analysis tool measures the speed and magnitude of recent price changes, as traders often use it to identify possible reversal points.
It runs from 0 to 100, where anything below 30 indicates that the asset has entered oversold territory and could be due for a revival. In contrast, readings above 70 mean that ETH is overbought and poised for a potential correction.
Just a few hours ago, the RSI dropped to around 23, the lowest level since early February. Currently, it stands at roughly 30, which still supports the bullish outlook.

- ETH RSI, Source: CryptoWaves
The post Key Ethereum (ETH) Indicator Drops to a 3-Month Low: Price Rebound Incoming? appeared first on CryptoPotato.

Bittensor (TAO), down 9.6% over the weekend, joined Bitcoin Cash (BCH) as an underperformer.

Galaxy Digital became the second company this year to secure a New York BitLicense, following Strike’s approval in March.


VanEck and Grayscale have submitted fresh amendments to their spot BNB ETF applications, signaling active engagement with the SEC as competition intensifies for the next altcoin ETF.

XRP price dropped 2% on May 18, sliding to $1.3865 as traders sold aggressively into the $1.42 resistance zone.
Summary
- XRP fell from $1.4138 to $1.3865 as 144.3 million in volume pushed the token down from the $1.42 area during the May 17 23:00 UTC session.
- The token remains inside a multi-month symmetrical triangle, with analysts warning the setup is compressing toward a decisive breakout point.
- Key support sits at $1.38, with a failure below that level opening a path toward $1.30, while a close above $1.42 would signal sellers are losing grip.
XRP fell as traders took profits aggressively after another failed push above $1.42, knocking the token back below $1.40 in the 24-hour session ending May 18.
The sharpest move came during the May 17 23:00 UTC session, when 144.3 million in volume pushed price from the $1.42 area to lows near $1.378. Buyers stepped in around $1.38 to limit the loss, and XRP recovered partially into the close.
The rejection is technically significant. As crypto.news reported, roughly 1.24 billion XRP tokens are held by investors who entered between $1.45 and $1.47, creating a structural supply wall that absorbs buying on every approach to that level.
XRP price locked in triangle compression
Analysts have pointed to a months-long symmetrical triangle compressing XRP’s price action, with the apex tightening toward a resolution in late May. The pattern is approaching a decisive breakout point, with sellers still controlling the $1.42 upper edge even as buyers defend $1.38 on each test.
Standard Chartered analyst Geoffrey Kendrick has projected that Senate Banking Committee advancement of the CLARITY Act could unlock $4 to $8 billion in additional XRP ETF inflows, making that vote the primary binary catalyst for any breakout above $1.45. As crypto.news documented, XRP ETFs recorded $81.63 million in net inflows in April, the best month of 2026, yet price failed to sustain momentum despite consistent institutional demand.
What happens if $1.38 breaks
A clean breakdown below $1.38 removes the floor under the current consolidation and opens the path toward $1.30. Traders who entered at higher levels have been the primary selling force on each recovery attempt. The crypto.news XRP price page shows the token trading at roughly a 62% discount to its July 2025 all-time high of $3.65.
A close above $1.42 would be the first signal that sellers are losing their grip on the upper range. Until then, the symmetrical triangle continues to compress toward a resolution that technical analysts warn could be sharp in either direction.
Crypto World
Hyperliquid's USDC deal could supercharge HYPE, pressure Circle, Coinbase margins, analysts say


The revenue share deal could shift an estimated $160 million in revenue from Coinbase and Circle into Hyperliquid’s ecosystem, Compass Point analysts said.

TLDR
- Revolut has launched a Dogecoin-themed physical debit card in the United Kingdom and the European Union.
- The company said customers can use the card anywhere Visa and Mastercard are accepted.
- Revolut confirmed that users will not face additional exchange fees on purchases.
- The firm stated that transactions will follow the exchange rate at the time of payment.
- Revolut said crypto card payments may create tax obligations depending on local regulations.
Revolut has introduced a Dogecoin-themed physical debit card to expand crypto payments into daily spending. The company will launch the card in the United Kingdom and across the European Union, excluding Hungary, Switzerland, and Portugal. It said customers can use the card anywhere Visa and Mastercard operate.
Revolut Expands Crypto Payments With Dogecoin Card
Revolut confirmed that it will issue the Dogecoin card to users in selected European markets. The company stated that customers can pay at any merchant that accepts Visa (V) or Mastercard (MA). It said the rollout will begin in the United Kingdom and EU member states, except Hungary, Switzerland, and Portugal.
The company shared details about the card on X. It said users will not pay extra exchange fees when they make purchases. However, it clarified that transactions depend on the exchange rate at the moment of payment and may create tax obligations under local laws.
Revolut said the card forms part of its wider crypto offering. The company has worked to connect digital assets with standard payment networks. It aims to let users spend tokens through familiar retail systems.
The Dogecoin card supports payments funded by crypto balances held within the app. Users can convert their holdings at the point of sale. The company priced Dogecoin at $0.1047 during the announcement.
Revolut has expanded its crypto services during 2025. It integrated Polygon into its platform to support remittances and staking of POL tokens. It also enabled in-app crypto card payments for supported assets.
The company stated that the Dogecoin card aligns with growing demand for crypto-linked debit products. Exchanges such as Coinbase (COIN) and Crypto.com have widened their card programs. Firms now seek to connect token balances with daily retail activity.
Banking Push and Broader Expansion
Revolut continues to grow its banking operations alongside crypto services. In March, it secured approval to launch a fully licensed bank in the United Kingdom. The company confirmed that regulators granted the authorization after a formal review.
The firm also applied for a de novo banking license in the United States. It submitted the application to expand its presence in the American market. The move would allow it to operate as a regulated bank if approved.
Revolut stated that it will manage crypto card payments through its existing app framework. The company processes transactions using established payment rails. It said exchange rates apply at the time of each purchase.
The Dogecoin card represents the latest addition to Revolut’s payment portfolio. The company continues to introduce new financial products across regions. It confirmed that the card rollout will begin with eligible customers in the United Kingdom and EU markets.


Kraken revenue rose 3% year-on-year to $507m in Q1 2026 as futures trading jumped 51%, Payward said Monday.
Summary
- Payward posted $507m in Q1 2026 adjusted revenue, up 3% year-on-year, despite Bitcoin falling 22% during the quarter and industry-wide spot volumes dropping 38%.
- Futures daily average revenue trades rose 51%, driven by NinjaTrader, Breakout, and expanded derivatives offerings from the recently completed Bitnomial acquisition.
- Adjusted EBITDA fell to $18m as Payward continued spending on acquisitions, product development, and regulatory infrastructure ahead of a planned IPO.
Payward, Kraken’s Wyoming-based parent company, said in a Monday press release that it generated $507 million in Q1 2026 adjusted revenue, up 3% from the same quarter a year earlier. Bitcoin fell 22% during the quarter and industry-wide spot trading volume dropped 38%, yet Payward’s diversified platform cushioned the decline.
A year earlier, Payward had reported $492 million in Q1 2025 adjusted revenue, making the 3% year-on-year gain notable given the steeper market downturn this cycle.
Co-CEO Arjun Sethi said in the release: “Where others pulled back, we leaned in.” Growth in futures and newer business lines offset weakness in core crypto markets, with Kraken’s spot market share rising to 5.2% in March from roughly 3.5% in mid-2025.
Kraken revenue beats rivals through diversification
Rival platforms reported sharper declines in trading revenue over the same period. Payward attributed its resilience to its stronger institutional business and growing derivatives offering, built partly through its $550 million acquisition of CFTC-licensed platform Bitnomial, which crypto.news covered when the deal completed on May 4.
Total platform transaction volume reached $357 billion in Q1, while funded accounts rose 47% year-on-year to 6.1 million and assets on platform reached $40 billion.
Adjusted EBITDA fell to $18 million as Payward continued investing in acquisitions including tokenization platform Backed, token management firm Magna, Bitnomial, and payments company Reap.
Crypto.news reported that non-trading revenue sources including custody, payments, and financing accounted for 53% of Payward’s 2025 total, a structural shift that reduces dependence on volatile trading volumes.
What Payward’s IPO delay means
Payward filed its draft S-1 with the SEC confidentially in November 2025 but paused the process in March, citing market conditions. Sources indicate a public listing may slip to 2027. The exchange also cut approximately 150 employees in May, attributing the reductions to AI-driven operational efficiencies, representing roughly 5% of its total workforce.
Payward’s M&A push positions it as the most comprehensively regulated crypto derivatives platform in the US. Crypto.news documented how the Bitnomial deal and Deutsche Börse’s $200 million stake established Payward as a regulated hub for digital asset futures and options inside the US, with its IPO filing remaining active.

Trump Just Created An Unconstitutional $1.776 Billion Loyalty Rewards Program For MAGA

Bradford Road crash causes diversions in Great Lever

Kyndryl Holdings, Inc. (KD) Presents at J.P. Morgan 54th Annual Global Technology, Media and Communications Conference Transcript
Manchester United reach agreement with Casemiro over contract clause amid transfer speculation

US brings back mandatory military draft registration

Steven Gerrard disagrees with Gary Neville over ‘shock’ Chelsea and Arsenal claim | Football


-

 Crypto World3 days ago
BloFin War of Whales 2026 Grand Prix opens registration for $5M trading championship
-

 Fashion3 days ago
Weekend Open Thread: Theory – Corporette.com
-

 Crypto World3 days ago
E-Estate Announces 1 Year Live: Washington DC Summit as Real Estate Tokenization Enters Its Next Phase
-

 Politics7 days ago
What to expect when you’re expecting a budget
-

 Tech4 days ago
Tech Moves: Microsoft AI leader jumps to OpenAI; former AI2 exec joins Meta; and more
-
Crypto World6 days ago
Bitcoin Suisse expands with Digital Asset License and Investment Business Act Registration Approval in Bermuda
-

 Tech7 days ago
GM agrees to $12.75M California settlement over sale of drivers’ data
-

 Politics6 days ago
Pakistan to enter Chinese capital market as war inflation bites
-

 Crypto World6 days ago
Bitcoin Suisse expands with Digital Asset License and Investment Business Act Registration Approval in Bermuda
-
 Crypto World4 days ago
Google’s Gemini AI Predicts Incredible Solana Price by the End of 2026
-
 Business3 days ago
H&R Real Estate Investment Trust (HR.UN:CA) Q1 2026 Earnings Call Transcript
-

 Tech3 days ago
Google reimburses Register sources who were victims of API fraud
-

 Sports3 days ago
Napoleonic enters 2026 Doomben 10,000 field via Abounding withdrawal
-

 Politics7 days ago
The geopolitics behind the UK’s South Atlantic hantavirus rescue mission
-

 NewsBeat6 days ago
Comment on Keir Starmer surviving the day as Prime Minister like a turd that wont flush
-

 Politics7 days ago
The Board of Deputies just smeared Polanski to suck up to Farage
-

 Fashion6 days ago
The Best-Kept Makeup Secret for a More Defined Face
-
 Entertainment4 days ago
Zara Larsson Has Blunt Response To Chris Brown Diss
-

 Politics6 days ago
The Trial of Majid Freeman, Verdict
-
 Tech6 days ago
Why AI is making typography a boardroom conversation
You must be logged in to post a comment Login