
Crypto World
Kaspa Price Near Key Support as Compression Signals Imminent Breakout Move

TLDR:
- Kaspa trades near critical support as price compression signals a potential high volatility breakout soon
- Descending resistance continues to cap price while buyers defend the $0.033 support zone repeatedly
- A move above $0.05 could shift momentum and open upside toward $0.07 and higher resistance levels
- Failure to hold support may trigger a sharp drop toward the next demand zone near $0.025 levels
Kaspa’s daily price structure is approaching a critical moment as the price compresses near long-standing support. Market participants are closely watching whether the asset can reclaim higher levels or extend its broader downtrend after months of sustained selling pressure.
Kaspa Price Structure Signals Tight Compression
A recent tweet from market analyst JACKIS draws attention to Kaspa’s evolving chart structure across multiple phases.
The asset previously experienced a sharp rally, climbing from near $0.005 to above $0.20. That move formed a classic expansion phase, supported by higher highs and strong momentum.
However, price action later transitioned into a choppy range between $0.12 and $0.20. This phase showed repeated rejection near highs, suggesting weakening momentum. As a result, distribution likely took place before the market shifted direction.
Selling pressure then took control, forming a prolonged downtrend with consistent lower highs. The chart now shows a descending resistance trendline stretching from near $0.18 toward current levels around $0.04. At the same time, support has held near the $0.033 to $0.035 zone.
This structure resembles a descending triangle combined with a falling wedge. Such formations often appear during late-stage trends where price compresses tightly. As volatility decreases, the likelihood of a sharp move increases.
The analyst notes that Kaspa is now sitting directly on key structural support. Price has tested this level multiple times without a decisive breakdown. Even so, buyers have yet to produce a strong reversal move.
Breakout Conditions Define Near-Term Direction
The current setup places Kaspa at a decision point where both bullish and bearish scenarios remain possible. A move above the descending trendline near $0.045 to $0.05 would shift short-term momentum. That step could open the path toward reclaiming the $0.06 to $0.07 range.
If that level is recovered, price may continue toward $0.07 to $0.08 as the first resistance zone. Further strength could bring the $0.10 to $0.12 area back into focus. This region previously acted as support before turning into resistance.
On the other hand, failure to hold the $0.033 support level could trigger a sharp decline. The chart shows limited structure below this range, which may lead to faster price movement downward. The next demand zone is projected near $0.025 to $0.028.
The tweet also points to the absence of strong bullish momentum so far. While support has held, there has been no impulsive bounce to confirm accumulation. This keeps downside risk active as price remains compressed near the lower boundary.
At the same time, repeated tests of support suggest buyers are still present. Compression near key levels often leads to sudden expansion. The direction of that move depends on whether resistance breaks or support fails.
JACKIS suggests that a move above March highs could support a broader recovery during the second quarter. However, confirmation remains essential before any trend shift is established.
For now, Kaspa remains locked within a tightening structure. Market participants are watching closely for a breakout signal that defines the next phase.


Why is crypto going up? Ethereum is about to tap $2,400, while Solana mirrors Bitcoin’s gain as it pushes toward $75,000 on the back of what analysts are calling the “US grand deal.” It’s a macro catalyst that may have more runway than most expect.
— Ash Crypto (@AshCrypto) April 13, 2026
 Iran has offered to pause nuclear activity for up to 5 years but Trump wants 20 years.
Market is expecting a US-Iran deal soon. pic.twitter.com/QvppJJevrl
The rally is broad-based; Aave, HYPE, Ethereum, and Solana are all leading gains as risk appetite floods back into digital assets. Positive regulatory sentiment under the current US administration, combined with accelerating institutional inflows into ETH products, appears to be driving the move. Citi’s 12-month ETH target of $5,440 is suddenly getting attention again.
The question now is not why crypto is up, but how far it can run, and which assets offer the most asymmetric upside from here.
Discover: The best pre-launch token sales
Why? Why is Crypto Going Up Today?
The Grand Deal. It is the macro layer that changes institutional math. It is maybe covering the peace deal on the US-Iran war, but it could also change the tailwinds on structured DeFi access, custody frameworks, and tokenized asset classification, and removing the compliance ambiguity that has been keeping institutional crypto allocations capped at exploratory positions.
The Grand Deal can also, in the end game passes key legislative hurdles, compliance teams greenlight expanded exposure, Bitcoin $75K becomes a structural target rather than a speculative one, and ETF inflow data confirms the repositioning over the following two to three weeks. Yes, when politicians stop thinking about war, they can start thinking about the Clarity Act more.
— U.S.A.I.
(@researchUSAI) April 14, 2026
For Altcoins like Solana, the picture is similarly constructive, SOL is tracking ETH’s momentum with the broader risk-on move, though specific technical levels remain in flux.
The macro tailwind, driven by the same geopolitical and trade deal sentiment that has lifted Bitcoin toward $75,000, provides a supportive floor for both assets.
Discover: The best crypto to diversify your portfolio with
LiquidChain Targets Early Mover Upside as Altcoins Test Key Levels
Altcoins at the current price are already priced in a significant recovery. To 4x from here, big coins like Ether and SOL need to reach something beyond a multi-year horizon, but hardly the asymmetric bet it was in 2022. Early-stage infrastructure projects launching into a bull market tend to offer a different risk/reward profile entirely.
A new layer emerges. Only a few see it first. — LiquidChain (@getliquidchain) March 24, 2026
The future is LiquidChain  ⟁https://t.co/vqvBcdSj94 pic.twitter.com/R7ZeZ0NPGl
LiquidChain is a Layer 3 infrastructure project positioning itself as the cross-chain liquidity layer — fusing Bitcoin, Ethereum, and Solana liquidity into a single execution environment. The core architecture includes a Unified Liquidity Layer, Single-Step Execution, Verifiable Settlement, and a Deploy-Once framework that lets developers reach all three ecosystems simultaneously without rebuilding protocol stacks.
The presale is currently priced at $0.01449, with more than $660K raised to date. The coin also offers 1600% APY staking bonus for new buyers.
Research LiquidChain’s presale terms before the next pricing tier closes is worth the 10 minutes.
The post Why is Crypto Up? Ether, HYPE, and Solana Lead Following US Grand Deal appeared first on Cryptonews.
Key takeaways
- BTC is approaching $75,000 after adding nearly 5% to its value since Monday.
- The rally comes despite the ongoing crisis in the Middle East.
Bitcoin (BTC) has stabilized above $74,000 as of Tuesday’s press time, following a 5% rally the previous day. This price surge comes as the US enforces a blockade on the Strait of Hormuz during ongoing peace talks with Iran. US Vice President JD Vance hints at a grand deal in the works, demanding an end to Iran’s nuclear ambitions.
Market sentiment recovers with $500M in liquidations
The broader cryptocurrency market is seeing a recovery, with over $500 million in liquidations across the last 24 hours, primarily driven by short squeezes. Aave (AAVE), Algorand (ALGO), and Ethereum (ETH) are leading the charge in the market’s upward momentum.
As negotiations between the US and Iran progress, the US military has started blocking the Strait of Hormuz, halting the movement of transiting ships. Vice President JD Vance emphasized that the situation is now in Iran’s hands, with the primary focus of US talks being Iran’s nuclear material exit and halting uranium enrichment. Former President Donald Trump also commented that “the other side” has approached him for a deal.
The peace talks appear to be fueling a “risk-on” sentiment, especially in the cryptocurrency market. According to CoinGlass data, the last 24 hours saw $531 million in liquidations, with $426 million attributed to short liquidations. This massive short squeeze indicates a major bearish wipeout.
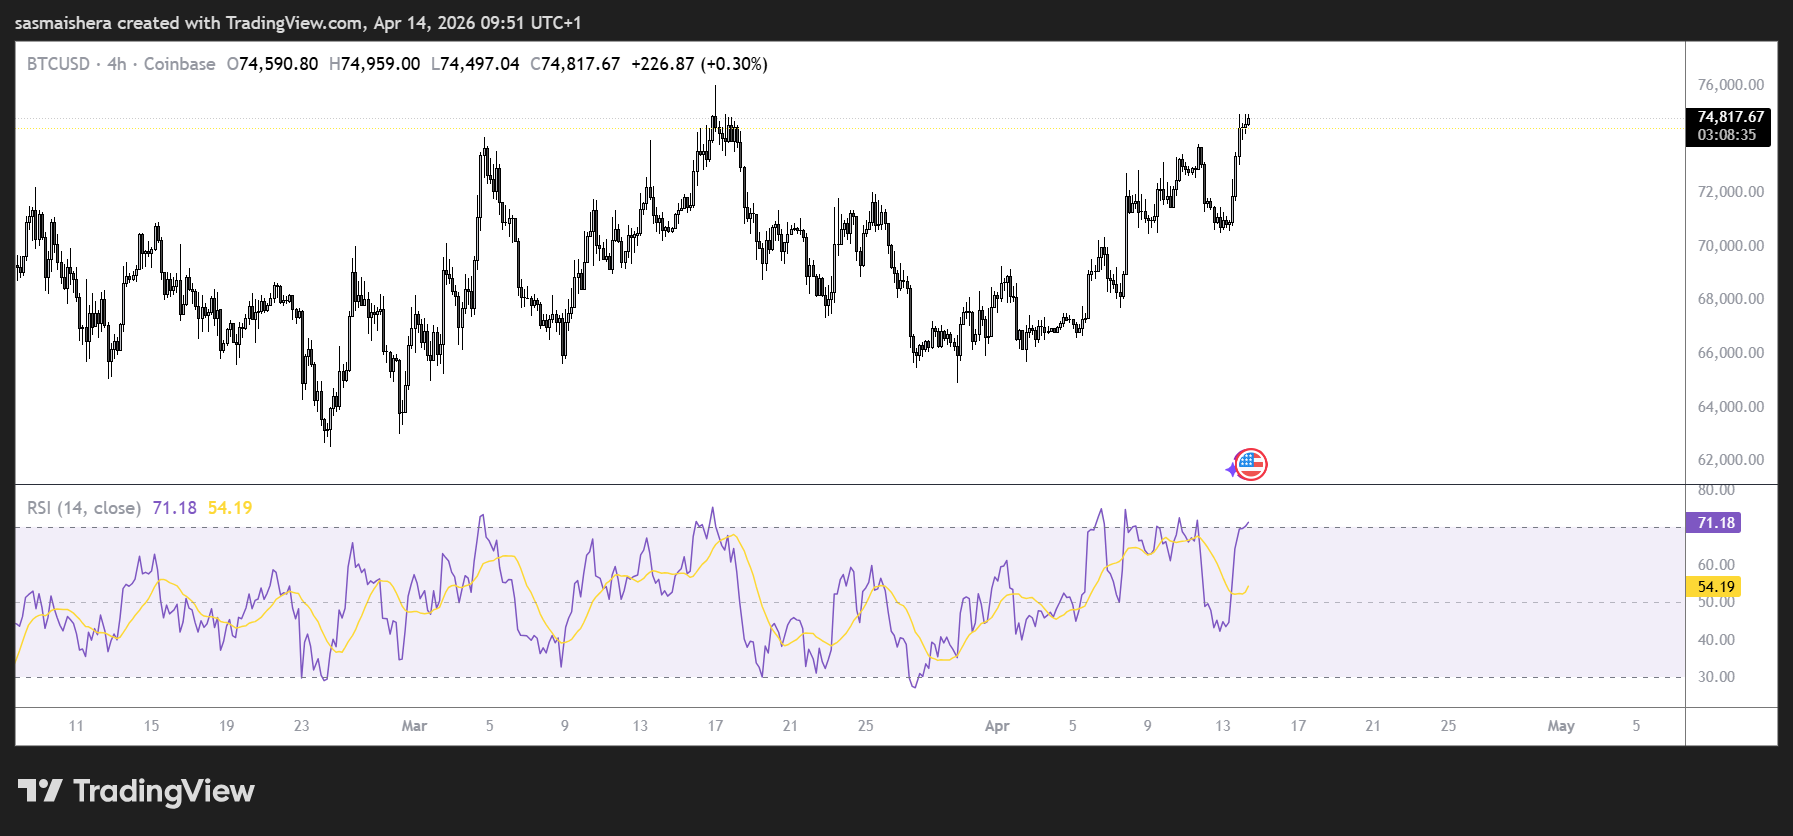
Bitcoin is approaching key resistance levels
The BTC/USD 4-hour chart remains bearish and efficient despite the recent rally. Bitcoin remains in a neutral-to-bullish trend, holding above its 50-day Exponential Moving Average (EMA) at $71,019. However, it is still capped below the 100-day EMA at $75,309.
Immediate resistance lies near the 100-day EMA and the 23.6% Fibonacci retracement level at $75,623, from a previous downtrend spanning $126,199 to $60,000. A daily close above this range would signal potential upward movement, with the next target being the 200-day EMA at $82,936, followed by the 50% Fibonacci retracement at $93,099.

Market momentum is favoring the bulls, with the Relative Strength Index (RSI) at around 62 and the Moving Average Convergence Divergence (MACD) in positive territory, both suggesting upward pressure is gaining traction.
On the downside, Bitcoin’s initial support is found at the 50-day EMA around $71,019. A break below this support could weaken the current bullish momentum and push the price lower, potentially testing the Fibonacci support level near $60,000.
Crypto World
STRC trading surge drives record volume and signals largest bitcoin purchase since launch

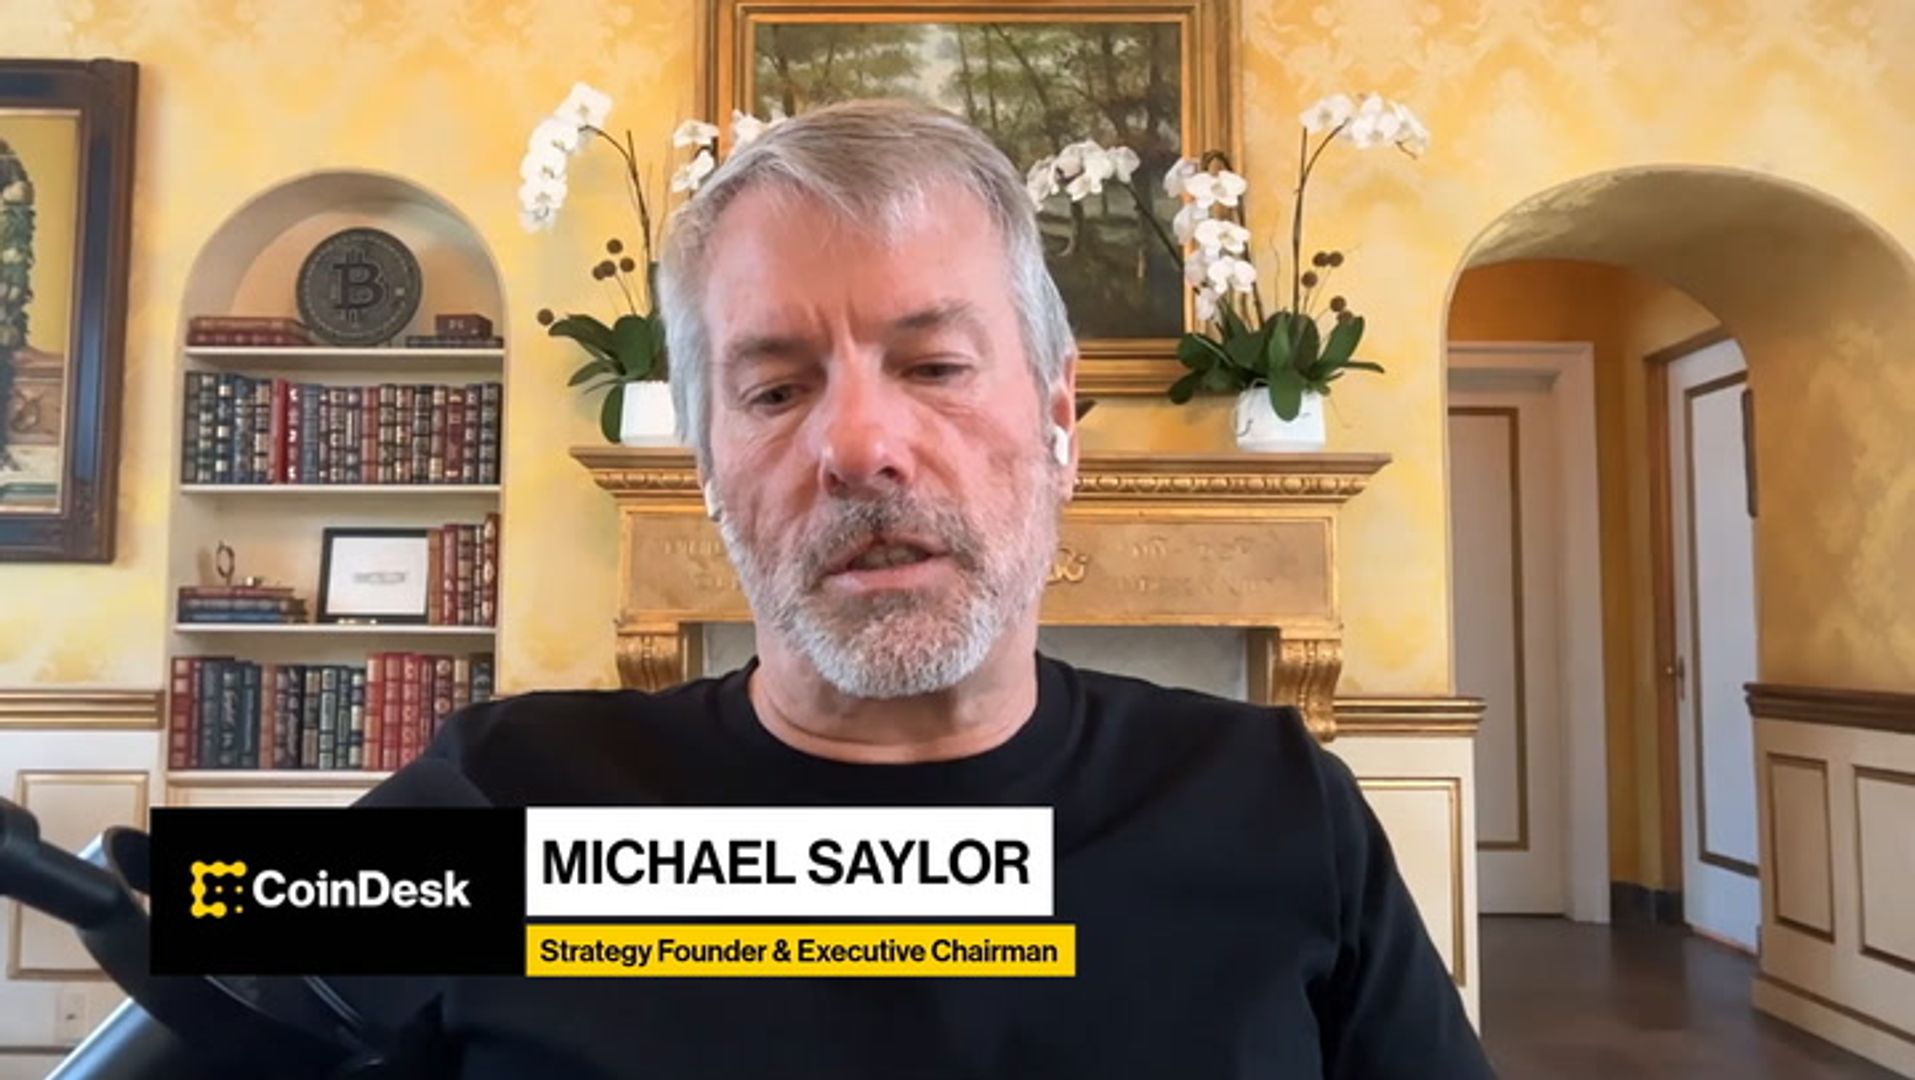
Stretch (STRC), the perpetual preferred security sold by Strategy (MSTR) to fund its bitcoin purchases, posted record trading volume on Monday, funding the biggest single-day buying splurge through the company’s at-the-market (ATM) program.
The world’s largest publicly traded bitcoin holder is estimated to have added 7,800 BTC, according STRC.live, as STRC volume surged to $1.16 billion, more than four times the 30-day average of $278 million.
This comes after Strategy purchased $1 billion worth of bitcoin last week, funded entirely by STRC, which offers an 11.5% annual dividend, paid monthly in cash. The stock maintained its $100 par value throughout the entire trading session.
Historically, the trading day preceding the ex-dividend date, the cutoff date after which new buyers are no longer entitled to the next dividend payment, tends to see the highest trading volume. That’s Wednesday, so it’s possible trading on Tuesday may be even higher than Monday’s record.
STRC now has a market capitalization of $6.4 billion, exceeding the combined market cap of the company’s other preferred securities, including STRD at $1.1 billion, STRK at $1 billion, and STRF at $1.2 billion, according to the MSTR dashboard.
The common stock rose 2.9% on Monday and was 3.7% higher in pre-market trading.
Read More: The one metric investors are overlooking in Michael Saylor’s Strategy
Key takeaways
- Hyperliquid is up 8% in the last 24 hours, maintaining its position in the top 10.
- The coin could rally towards the $50 psychological level if the bullish sentiment persists.
Hyperliquid (HYPE) continues its upward momentum, trading above $44 as of Tuesday after an 8% surge on the previous day. With strengthening on-chain data, favorable derivatives metrics, and technical analysis pointing to further gains, the outlook for HYPE remains bullish, with a target of $50 in sight.
Bullish Sentiment Backed by On-Chain and Derivatives Metrics
On-chain data from CryptoQuant suggests a strong buy-side dominance in both Hyperliquid’s spot and futures markets, with cooling conditions indicating a favorable environment for a potential price rise. The market shows mostly neutral conditions across other metrics, reinforcing the possibility of an upside move.
On the derivatives front, CoinGlass data reveals that HYPE’s futures Open Interest (OI) has surged to $1.96 billion on Tuesday, up from $1.5 billion on April 3. This steady rise in OI points to new capital entering the market, which could propel HYPE’s price higher. This is the highest level of futures OI seen since early November.
Moreover, CoinGlass’ long-to-short ratio for HYPE stands at 1.04, signaling a predominantly bullish sentiment in the market, as more traders expect the price to rally.
Price Forecast: HYPE bulls target $50
The HYPE/USD 4-hour chart is extremely bullish and efficient. HYPE’s price has extended its gains, surpassing the March high of $43.75 and reaching above $44 on Tuesday. If the upward trend continues, HYPE could target the October 30 high of $50.15.
The Relative Strength Index (RSI) on the daily chart is currently at 69, indicating strong bullish momentum as it moves toward overbought territory. Additionally, the Moving Average Convergence Divergence (MACD) indicator recently showed a bullish crossover on April 10, further supporting a positive outlook for HYPE.
Should HYPE experience a pullback, it could find support near the psychological $40 level. However, the prevailing market conditions suggest a strong potential for further upside, with $50 being the next major resistance.
UK Liberal Democrats have urged the Financial Conduct Authority (FCA) to investigate Nigel Farage’s ties to Bitcoin treasury company Stack BTC after it disclosed a 37 Bitcoin purchase and published promotional material featuring the Reform UK leader, who is also a shareholder.
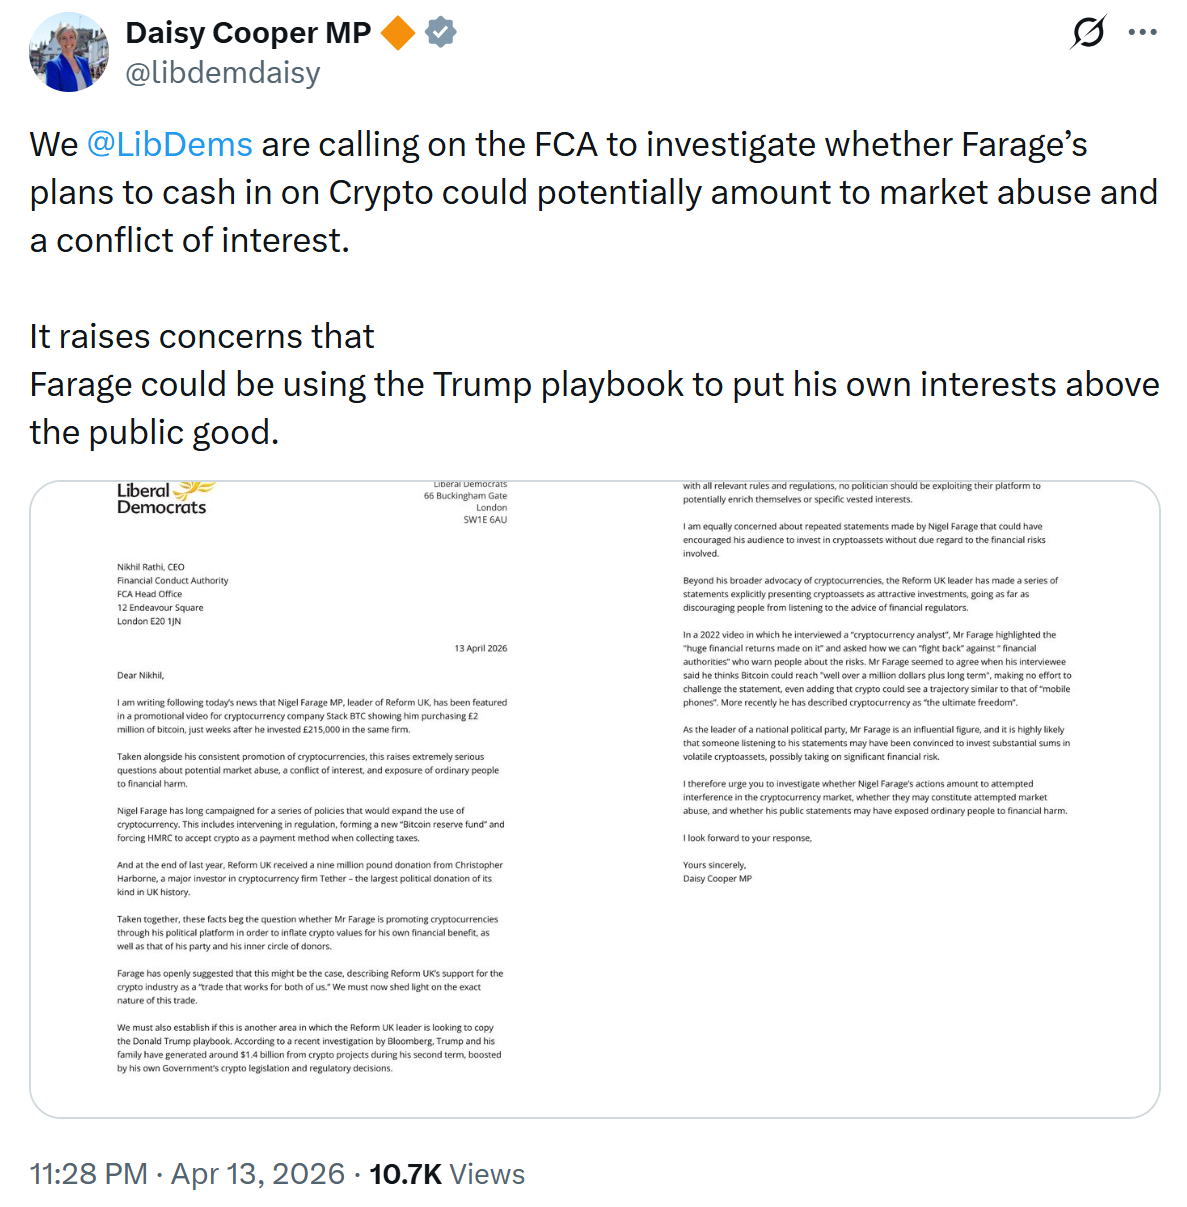
In a letter to the FCA, Liberal Democrat deputy leader Daisy Cooper asked the regulator to investigate whether Farage breached market rules by appearing in a promotional video for Stack BTC while holding a financial stake in the company.
“The FCA must investigate whether Farage’s plans to cash in on Crypto could potentially amount to market abuse and a conflict of interest,” she wrote, adding that “we cannot allow political leaders to treat the financial markets like a personal piggy bank to potentially line their own pockets.”
Stack BTC said Monday that it purchased 37 Bitcoin (BTC) for roughly $2.7 million as part of its treasury strategy. In a video tied to the purchase, Farage said that a Bitcoin treasury company cannot exist without holding Bitcoin.
The scrutiny adds to questions over the intersection of crypto and UK politics as Farage deepens his involvement with Stack BTC and lawmakers push for tighter rules on digital asset donations to political parties. An FCA spokesperson told Cointelegraph that they will “review the letter and respond directly.”
Cointelegraph reached out to Stack BTC for comment, but had not received a response by publication.
Related: UK sanctions $20B scam market by cutting ‘legitimate’ crypto ties
Farage deepens ties to Stack BTC
Farage, leader of Reform UK, has recently deepened his relationship with Stack BTC. In March, he disclosed a $286,000 equity investment in the company, acquiring a 6.31% stake in the company through his media vehicle Thorn In The Side.
Stack BTC, chaired by former UK Chancellor Kwasi Kwarteng, holds over 68 BTC purchased at an average cost of $72,400 per coin, according to its website.
Cooper’s letter also references the record 9 million British pounds (about $12 million) donation to Reform UK from early crypto investor Christopher Harborne and Farage’s push for crypto-friendly policies.
“Taken together, these facts beg the question whether Mr Farage is promoting cryptocurrencies through his political platform in order to inflate crypto values for his own financial benefit, as well as that of his party and his inner circle of donors,” she wrote.

Related: UK lawmakers seek moratorium on crypto donations to political parties
UK moves to ban crypto political donations
Last month, the Rycroft Review recommended a moratorium on cryptocurrency donations to political parties, warning they could open the door to foreign financial interference in UK elections. The UK government moved forward with the proposal, with Prime Minister Keir Starmer stating the government will impose a temporary ban on crypto donations until stronger safeguards are in place.
Several members of parliament, including the chair of the security committee, have been pushing for a full ban this year.
Magazine: How crypto laws changed in 2025 — and how they’ll change in 2026

Errol Musk, father of Tesla and SpaceX founder Elon Musk, says there is no doubt that crypto is the future of finance.
In an exclusive interview with BeInCrypto Editor-in-Chief Vladimir Arkhireysky, the South African engineer called the old model “finished.” His comments come alongside revelations about his sons’ Bitcoin (BTC) holdings and his own first-hand experience of crypto payments.
Elon Musk’s Father Backs Crypto
Errol Musk was unequivocal about where global finance is heading.
“I have no doubt that crypto will be the future of finance. The old model has run its course, it’s finished,” he said. “The new form of money management is clearly crypto.”
The 79-year-old engineer grounded his conviction in personal experience. He described how transferring money across countries through a bank is “practically impossible,” whereas crypto transfers happen instantly.
“It’s an amazing form of money movement. For example, if I’m in South Africa and I want to bring some money from America through a bank, it’s impossible. They make it so impossible through the bank. If I go to my friends in crypto, they do it immediately, no problem,” Errol told BeInCrypto.
He noted that he has met the founder of Binance, Changpeng “CZ” Zhao, and the founder of Bybit, and has personally received crypto that bypassed traditional banking channels entirely.
Despite his conviction, Errol admitted he does not personally own any digital assets. He described himself as “old-fashioned,” though he said he would like to learn more about crypto.
“What I know about it is small, but it’s a big thing. I am still old-fashioned. I have a bank card,” he remarked. “Altogether, I’m not an expert, but it’s clearly fascinating stuff.”
Follow us on X to get the latest news as it happens
Inside the Musk Family’s Crypto Exposure
Errol also offered a rare glimpse into the Musk family’s crypto positions.
“I know it sounds astronomical. Elon and Kimbal, my two sons, have 23,400 Bitcoins,” he said.
If accurate, the figure would be striking. Based on the latest data from BitsoinTreasuries, Elon Musk’s electric vehicle firm Tesla holds 11,509 BTC, ranking 12th among the largest publicly traded holders. In addition, SpaceX holds 8,285 Bitcoins.
The family has also dealt in other tokens. Errol revealed that they once received payment in Solana (SOL), an amount he described as “a little more than a million rubles.”
“It was strange for me to receive that payment in crypto. We received Solana back then, it was worth much more, and we got out at the peak,” he mentioned.
Errol Musk is a South African engineer, pilot, and businessman. Born in 1946. Father of Elon Musk, founder of Tesla and SpaceX, and Kimbal Musk, entrepreneur and philanthropist.
Early in his career, he worked in real estate and electrical engineering and was involved in various mining projects across Africa. He is known as a candid speaker who readily comments on his sons’ achievements and global trends.
The post Elon Musk’s Father Declares Crypto the Future of Finance appeared first on BeInCrypto.


The Digital Asset Market Clarity Act is gaining fresh momentum in the U.S. Senate as negotiators work to solidify a bipartisan compromise on stablecoin regulations.
Summary
- The White House has secured a bipartisan agreement on stablecoin yields to move the Digital Asset Market Clarity Act toward a Senate Banking Committee markup.
- Negotiators are finalizing additional provisions involving illicit finance rules for decentralized finance and ethics restrictions on senior government officials.
Patrick Witt, the executive director of the President’s Council of Advisors for Digital Assets, told CoinDesk TV on Monday that a crucial agreement regarding stablecoin yield appears to be holding firm.
This consensus was a prerequisite for addressing other sticking points in the bill, which had previously stalled due to concerns from the banking sector.
“We’re hopeful that the compromise that has been reached will be durable and will hold,” Witt said, noting that resolving the yield issue was a “must-have” before the administration could pivot to remaining hurdles.
CoinDesk TV reported that the legislation faced significant delays earlier this year after bank lobbyists argued that allowing stablecoins to offer interest-like returns could drain traditional bank deposits.
While White House economists recently released a report downplaying these risks, the American Bankers Association maintains that the government’s assessment is flawed.
Witt observed that the banking industry remains divided on the technology, stating, “They’re grappling with it. These are all important issues to their members. And, you know, some of them are going to view stablecoins more positively. Some are going to be a little bit more threatened by them.”
Legislators are also working through sensitive non-financial clauses behind the scenes. These include establishing illicit finance protections for the decentralized finance (DeFi) sector and addressing a demand from Democrats to prevent senior government officials, including President Donald Trump, from personally profiting from the crypto industry.
Witt declined to specify which of these secondary topics are now fully settled, but expressed optimism about the current pace of negotiations.
“All of these issues felt intractable and unsolvable at one point in time,” Witt said.
“So the fact that we’ve been able to close out a lot of them gives me confidence that we can close out these other ones, too.”
The bill must now pass a markup hearing in the Senate Banking Committee before it can be scheduled for a full floor vote.
Bitcoin analysts sounded bullish early this week and the market is proving them right. The cryptocurrency’s price has hit four-week highs above $74,000.
As the rally continues, several key levels are now in focus. Let’s take a look at those in detail.
$75,000 the ‘release point’
This may be the most important because of its implications for derivatives positioning and dealer hedging flows. Dealers, or market makers, are entities that keep markets liquid and ensure a seamless trading experience by stepping in to buy or sell assets, taking the opposite side of your trade.

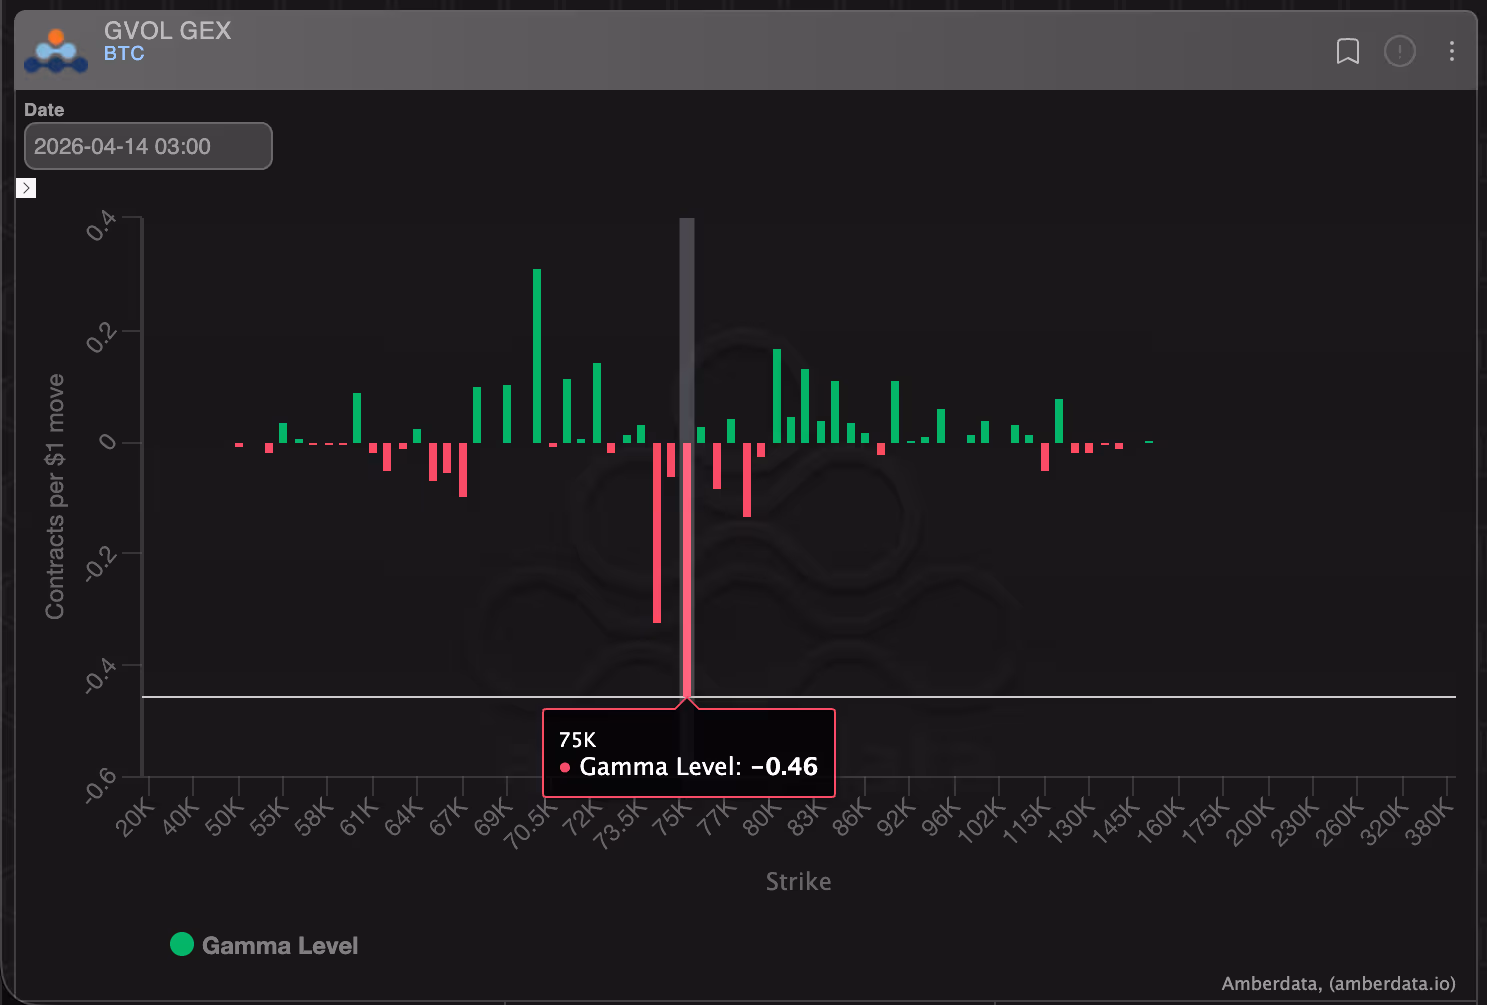
At $75,000, options market data from Deribit indicates that dealer and market maker exposure is tilted heavily toward so-called “negative gamma.”
Gamma refers to how quickly dealers must adjust their hedges as the underlying price moves.
When dealers are “long gamma,” they tend to buy the underlying asset in spot/futures when its price falls, and sell when its price rises, inadvertently curbing volatility. But when they are short or in negative gamma, as is the case at $75,000, their behavior flips – hedging becomes pro-cyclical, meaning they may be forced to buy into rallies and sell into declines. Other things being equal, this dealer hedging often amplifies price volatility.
So, as bitcoin approaches and trades near $75,000, even modest price swings can trigger hedging flows from dealers adjusting their options exposure. If prices move past $75,000, dealers may buy into the rising market, potentially accelerating upside momentum.
Conversely, if prices turn lower from around $75,000, dealers could short, accelerating the decline, meaning this point can act less like a traditional support or resistance level and more like a “volatility release point.”
Since 2020, as bitcoin’s options market has expanded significantly, negative gamma positioning has increasingly acted as an accelerant, intensifying both upswings and selloffs depending on the prevailing market’s direction.
Second, $75,000 also aligns with the 100-day moving average, a widely tracked technical indicator that often serves as support or resistance. It previously marked a key resistance zone in January, where sellers re-established their dominance, stopping the rally and paving the way for a deeper drop toward $60,000.

Above $80,000
The next key price range is $80,000–$80,600. This zone is characterized by positive dealer gamma exposure, which means they are likely to buy low and sell high in this range, potentially reducing the directional pressure. As a result, trading within this band could be relatively rangebound, with less tendency for sharp trend continuation in either direction.
Meanwhile, $80,525 also stands out as a historically important level, marking the point where the November sell-off lost momentum. From there, selling pressure faded and the market transitioned into a two-month recovery rally that carried bitcoin toward the $100,000 area.

Prior inflection points, such as $80,525, often represent potential areas where a bullish move may stall.
A final indicator to watch is the massively popular 200-day average of the price, tracked by traders and analysts as an indicator of long-term price trajectory. As of writing, the 200-day average is $87,519, indicating BTC is currently trading below its long-term valuation.

The initial rise in EUR/USD and GBP/USD was driven by reports of a temporary ceasefire between the United States and Iran, which reduced demand for the US dollar as a safe-haven asset. However, over the weekend, reports emerged that negotiations had stalled, leading to a bearish gap at the start of the new trading week. Subsequently, rumours of a possible resumption of dialogue once again shifted market sentiment, restoring interest in risk-sensitive assets.
This supported a swift recovery in the euro and the pound, while also increasing pressure on the US dollar. Additional downside pressure on the dollar comes from declining Treasury yields and a reassessment of expectations regarding the Federal Reserve’s monetary policy, which continues to limit the upside potential of the US currency.
Market attention today will focus on upcoming macroeconomic releases from the euro area and the United States, including producer inflation (PPI), business activity data, and speeches from Federal Reserve officials. These factors may adjust current interest rate expectations and influence the dollar’s short-term trajectory.
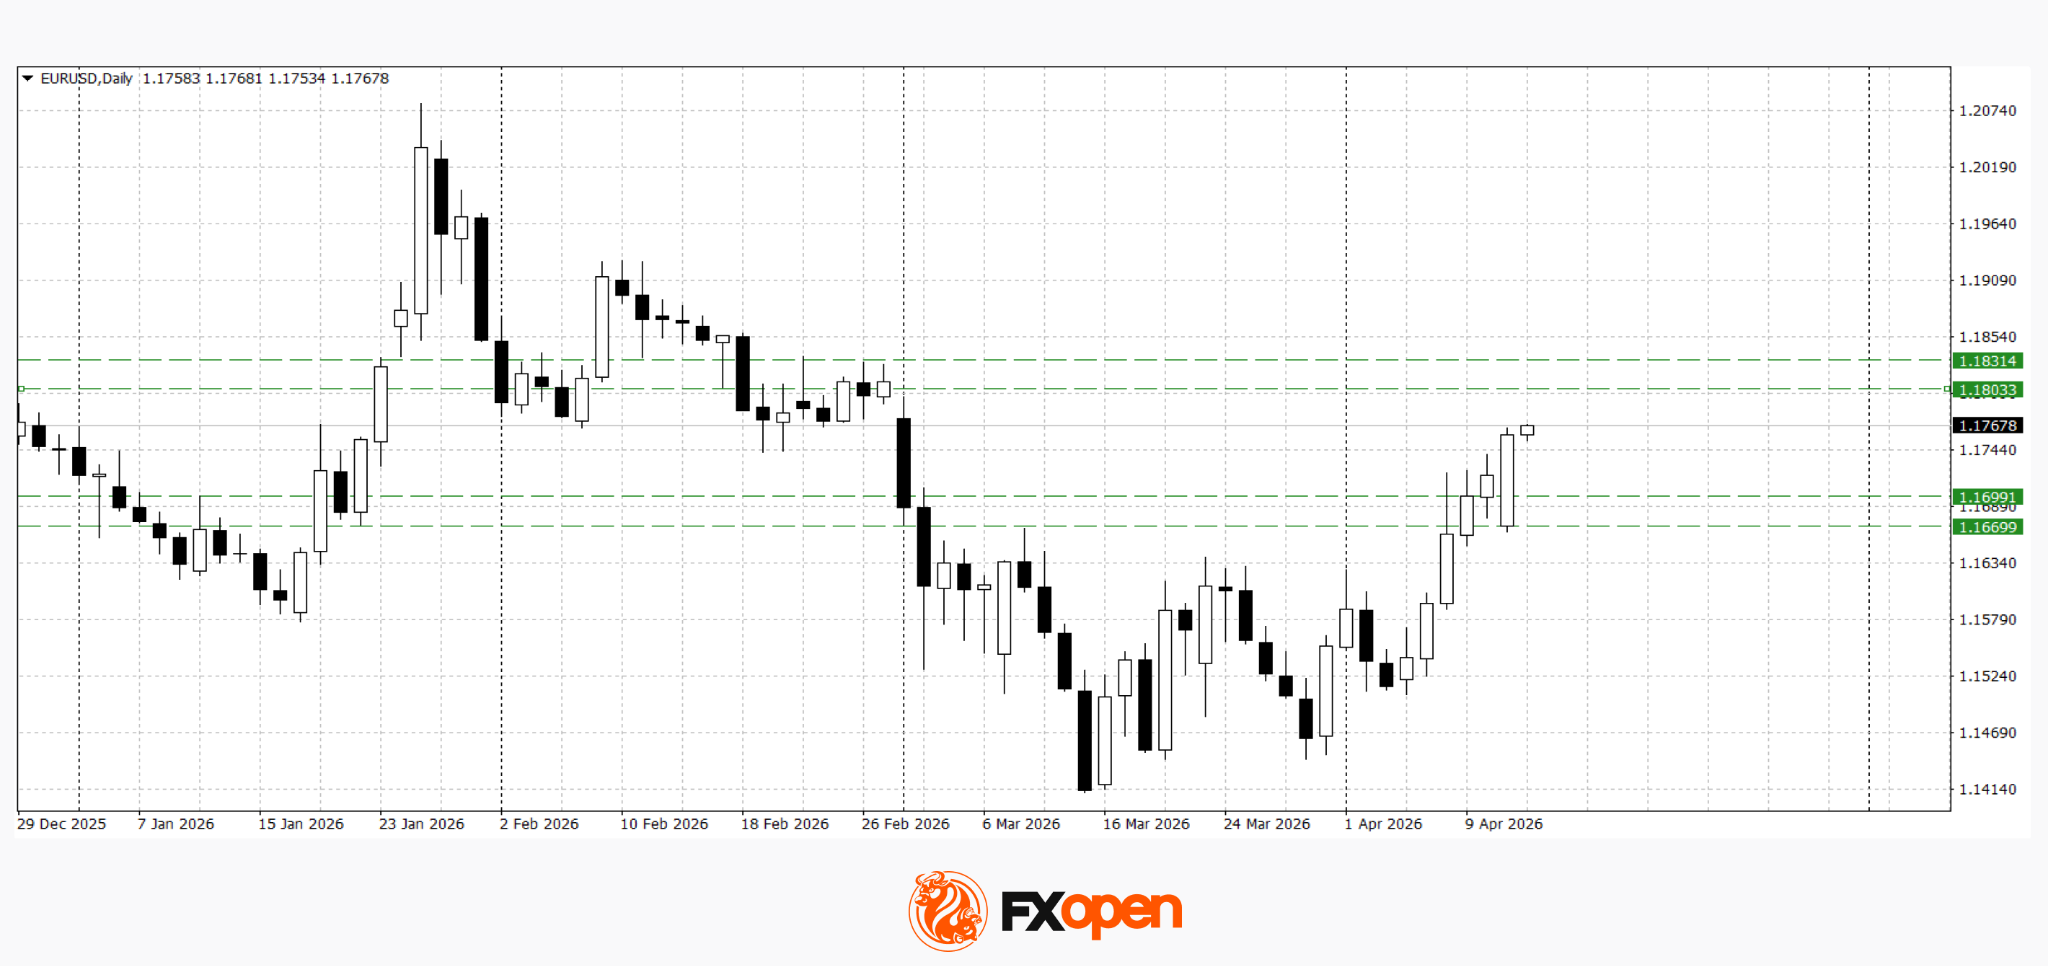
EUR/USD
The pair continues to move higher following a breakout from last week’s consolidation range. The week opened with a price gap, but after a retest of support at 1.1660, the pair quickly recovered above 1.1700. Technical analysis suggests the potential for further gains towards the 1.1800–1.1830 area. However, any negative developments in US–Iran negotiations could trigger a sharp pullback towards 1.1700–1.1660.
Key events for EUR/USD:
- today at 10:00 (GMT+3): Spain HICP
- today at 15:30 (GMT+3): US Producer Price Index (PPI)
- today at 20:00 (GMT+3): speech by Bundesbank representative Balz
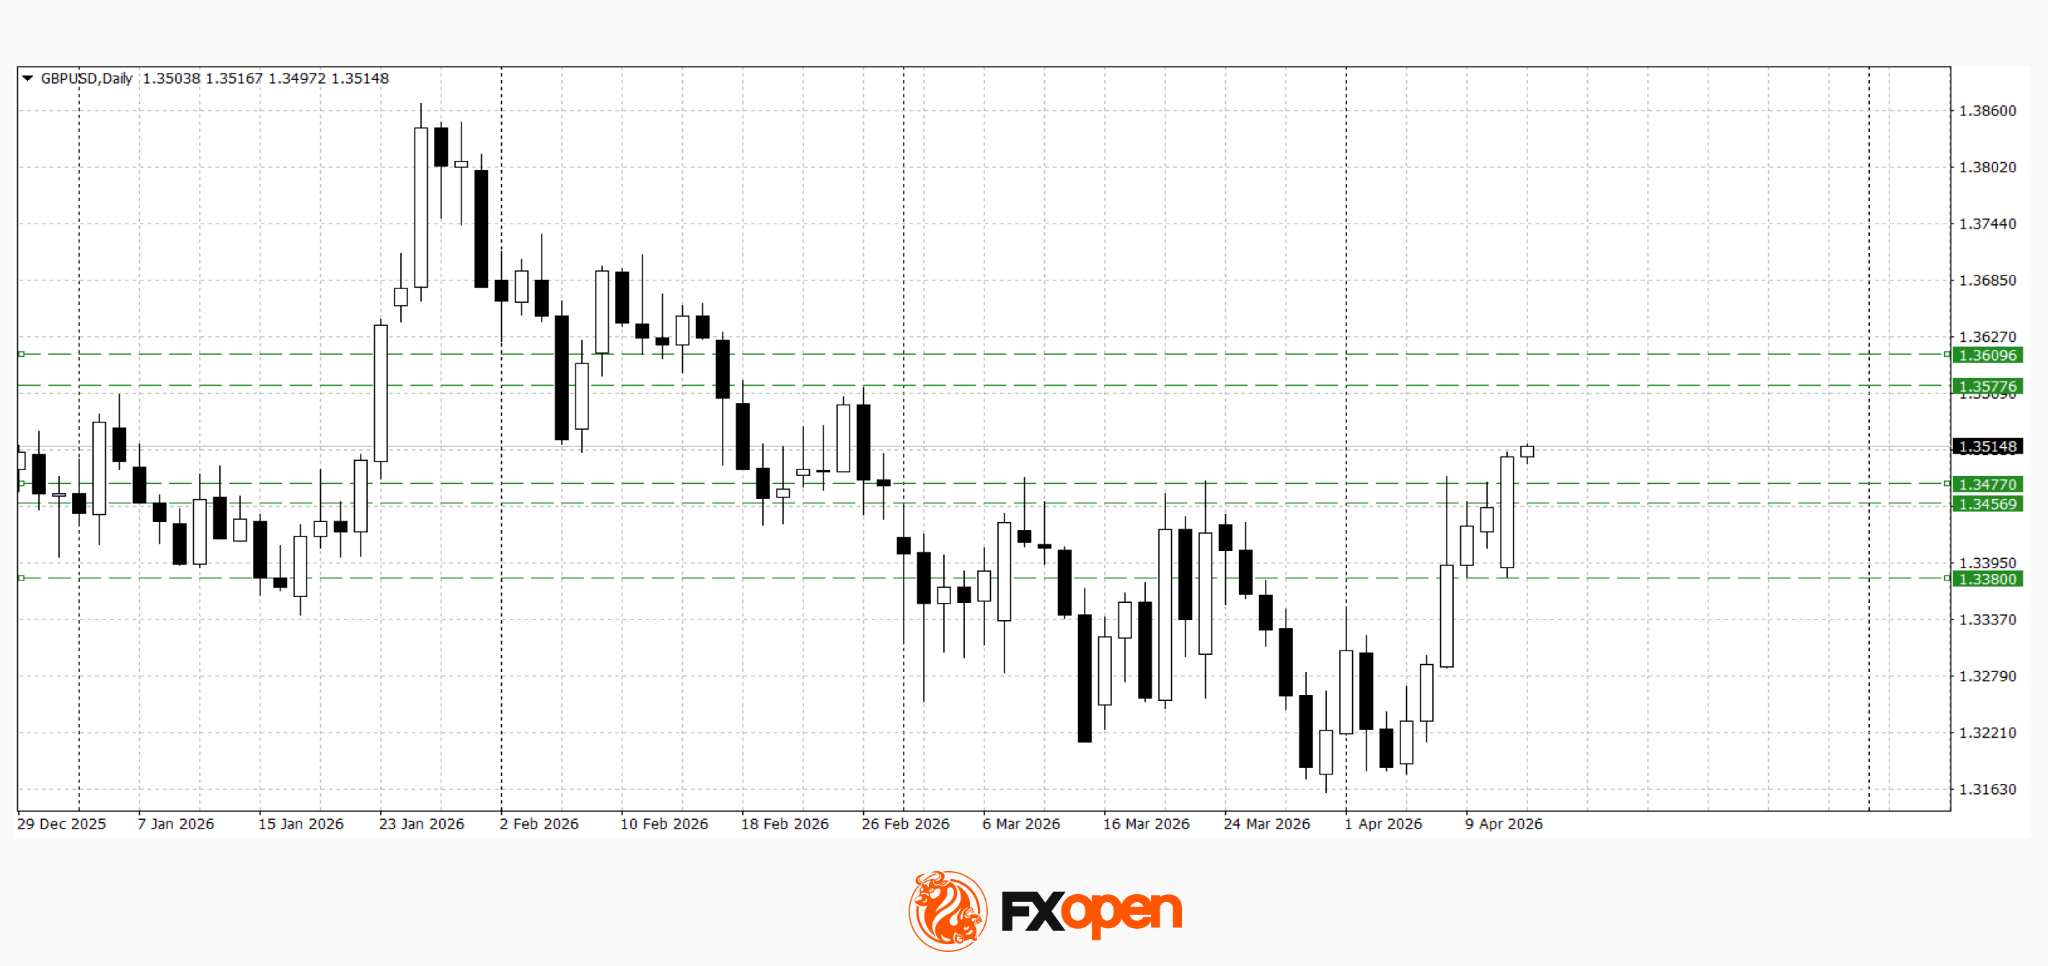
GBP/USD
The pair is showing a similar pattern, largely mirroring the euro’s dynamics. Following the overnight gap, the price managed to break above last week’s highs and test key resistance at 1.3500. Technical analysis points to a possible move towards 1.3570–1.3600. In case of a pullback, a retest of recent levels near 1.3450–1.3470 is possible.
Key events for GBP/USD:
- today at 11:50 (GMT+3): speech by Bank of England MPC member Mann
- today at 19:00 (GMT+3): speech by Bank of England Governor Bailey
- today at 19:45 (GMT+3): speech by Federal Reserve Vice Chair for Supervision Michael S. Barr
Overall, European currencies maintain an upward bias amid an unstable geopolitical environment and declining US yields. However, the current rally remains highly sensitive to developments in the negotiation process, increasing the likelihood of short-term volatility. The next directional move in EUR/USD and GBP/USD will depend on both geopolitical signals and incoming macroeconomic data.
Trade over 50 forex markets 24 hours a day with FXOpen. Take advantage of low commissions, deep liquidity, and spreads from 0.0 pips (additional fees may apply). Open your FXOpen account now or learn more about trading forex with FXOpen.
This article represents the opinion of the Companies operating under the FXOpen brand only. It is not to be construed as an offer, solicitation, or recommendation with respect to products and services provided by the Companies operating under the FXOpen brand, nor is it to be considered financial advice.
Bitcoin price edged closer to the $75,000 mark after news reports suggested a potential de-escalation of the U.S.-Iran war. Bitcoin is now close to breaking out of an ascending triangle that could push it higher this week.
Summary
- Bitcoin price climbed toward $75K on U.S.-Iran ceasefire hopes and easing inflation fears as oil prices dropped.
- A $225 million short squeeze across derivatives markets accelerated BTC’s rally and strengthened bullish momentum.
- BTC is approaching a breakout above $76K from an ascending triangle, with $80K as the next key resistance level.
According to data from crypto.news, Bitcoin (BTC) price rose nearly 6% to a 4-week high of $74,788 on Tuesday morning Asian time. Trading at $74,675 at press time, it stood nearly 9% higher over the past week.
Bitcoin price climbed higher amid renewed hopes of a potential ceasefire deal between the U.S. and Iran after the latter hinted that its officials are ready to abandon pursuing a nuclear enrichment program. This came just a day after U.S. naval forces began intercepting and blocking Iranian traffic at the Strait of Hormuz.
Following this, crude oil prices, which rose to nearly $120 yesterday, came crashing down under $100 at press time, reducing fears of global inflation and boosting risk assets such as Bitcoin.
Bitcoin price also benefited from anticipation surrounding the U.S. Producer Price Index (PPI) scheduled for release later today, as investors look for signs that wholesale inflation might come in lower than the 4.6% year-over-year forecast.
Risk assets, including Bitcoin, tend to thrive when PPI data shows cooling below expectations—currently estimated at a 1.2% monthly increase, as it suggests slowing inflation at the production level. This trend could encourage the central bank to pause its aggressive stance on interest rates or even begin cutting interest rates later this year.
Over $225 million in short positions from across derivatives markets also helped lift Bitcoin price as bears were forced to buy back their assets at a loss. This wave of forced buying created a short squeeze that provided the necessary fuel to accelerate the current market breakout.
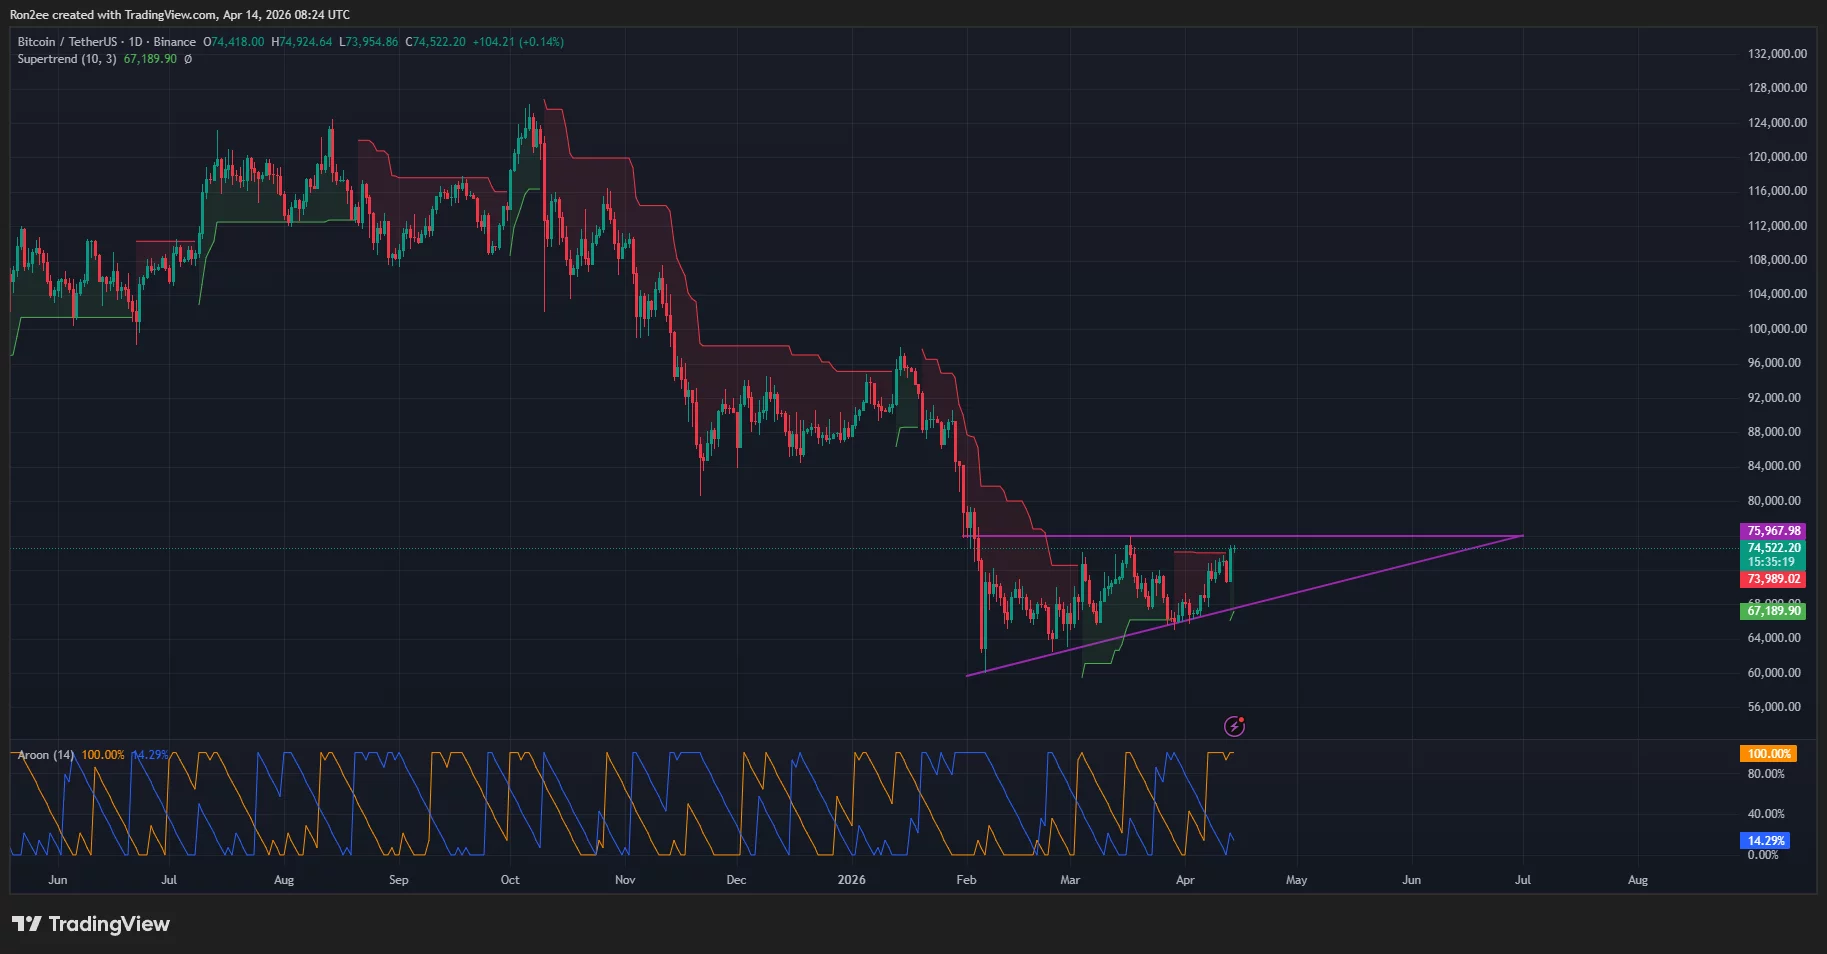
On the daily chart, Bitcoin has been forming an ascending triangle pattern that it has been developing since its drop in early February this year. Following the recent Bitcoin rebound, the bellwether asset is moving closer toward breaking out of the upper horizontal trend line of the pattern at around $76,000.

A look at technical indicators shows that bulls currently maintain control of the market. The Supertrend has flipped green for the first time this month, which means the short-term momentum has shifted from bearish to bullish.
The Aroon Up sits at 100% while a much lower Aroon Down reading also reinforced the bullish view by suggesting that new highs are being reached while selling pressure remains weak.
For now, $76,000 is acting as the key resistance level to watch. A decisive breakout above the current triangle could embolden bulls to reach for the next immediate psychological resistance level at $80,000.
On the contrary, a drop below $72,000 could invalidate the short-term bullish setup.
Disclosure: This article does not represent investment advice. The content and materials featured on this page are for educational purposes only.

Romania v Wales: Teams to play summer friendly at Bucharest’s Steaua Stadium

Inertia moves to commercialize one of the world’s most elaborate science experiments

How Trump Accidentally made Iran Financial Super power


-

 Politics4 days ago
US brings back mandatory military draft registration
-
 Sports4 days ago
Man United discover Nico Schlotterbeck transfer fee as defender reaches Dortmund agreement
-

 Fashion4 days ago
Weekend Open Thread: Veronica Beard
-

 Tech7 days ago
How Long Can You Drive With Expired Registration? What Florida Law Says
-

 Politics4 days ago
Malcolm In The Middle OG Turned Down ‘Buckets Of Money’ To Appear In Reboot
-

 Politics2 days ago
World Cup exit makes Italy enter crisis mode
-

 Crypto World5 days ago
Canary Capital Files SEC Registration for PEPE ETF
-

 Business4 days ago
Tesla Model Y Tops China Auto Sales in March 2026 With 39,827 Registrations, Beating Cheaper EVs and Gas Cars
-

 Fashion7 days ago
Let’s Discuss: DEI in 2026
-

 Crypto World6 days ago
Bitcoin recovers as US and Iran Agree a Ceasefire Deal
-

 Crypto World15 hours ago
The SEC Conditionalises DeFi Platforms to Be Avoided for Broker Registration
-
 NewsBeat1 day ago
Pep Guardiola and Gary Neville agree over Arsenal title problem that benefits Man City
-

 Crypto World12 hours ago
SEC Signals Exemption for Crypto Interfaces From Broker Registration
-

 Business4 days ago
OpenAI Halts Stargate UK Data Centre Project Over Energy Costs and Copyright Row
-

 Business3 days ago
Ireland Fuel Protests Enter Day 5 as Blockades Spark Shortages and Government Prepares Support Package
-

 Politics4 days ago
LBC Presenter Mocks Trump Over Iran War Failures
-

 Crypto World3 days ago
Federal judge blocks Arizona from bringing criminal charges against Kalshi
-

 Tech4 days ago
A version of Windows 10 released a decade ago is now eligible for additional security patches
-
 NewsBeat2 days ago
JD Vance announces ‘no agreement’ with Iran over nuclear weapons fear
-

 Business3 days ago
IMF retains floor for precautionary balances at SDR 20 billion
You must be logged in to post a comment Login