

Crypto World
TradingView unlocks Hyperliquid markets with round-the-clock data


TradingView has expanded its market coverage by adding real-time data for Hyperliquid and Trade[XYZ], giving users access to onchain perpetual and spot markets directly through its charting platform.
Summary
- TradingView has added real-time Hyperliquid and Trade[XYZ] market data to its charting platform.
- Users can now track crypto, equities, commodities, forex, and pre-IPO perpetual markets around the clock.
- The integration comes days after Singapore’s MAS placed Hyperliquid on its Investor Alert List.
According to TradingView, the new integration brings live pricing for Hyperliquid’s crypto perpetual and spot markets alongside Trade[XYZ] markets covering equities, commodities, foreign exchange, and pre-IPO companies.
The data is available through TradingView’s Supercharts, allowing traders to follow price movements throughout the day, including when traditional financial markets are closed.
The addition extends the range of assets available on TradingView without requiring users to leave the platform for onchain market data. Hyperliquid markets appear under the HYPERLIQUID symbol prefix, while Trade[XYZ] listings can be accessed using the HIP3XYZ prefix through the platform’s symbol search.
Hyperliquid expands beyond its core exchange
Built on its own layer-1 blockchain, Hyperliquid operates an onchain perpetual futures exchange that currently supports more than 300 perpetual and spot markets across cryptocurrencies, commodities, and indices.
The ecosystem has also grown through HIP-3, a protocol upgrade that allows third-party developers to launch perpetual markets using Hyperliquid’s infrastructure. Under that framework, Trade[XYZ] has become the first major deployment, offering perpetual markets tied to multiple asset classes, including cryptocurrencies, equities, as well as crypto spot trading.
By adding both Hyperliquid and Trade[XYZ] feeds, TradingView has made those markets available alongside its existing charting tools, enabling traders to monitor perpetual contracts and spot assets from a single interface.
Regulatory attention has continued alongside platform growth
The TradingView integration comes days after the Monetary Authority of Singapore added Hyperliquid to its Investor Alert List, as previously reported by crypto.news.
According to the regulator, the listing covers both the Hyper Foundation website and the Hyperliquid trading application. MAS said the Investor Alert List is intended as a consumer protection measure identifying entities that could be mistakenly viewed as licensed or regulated by the authority. The regulator also stated that inclusion on the list does not constitute a ban or an enforcement action.
Following the listing, Hyperliquid said it had never claimed to be licensed or authorized by MAS.
Despite the regulatory attention, the decentralized exchange has remained one of the largest trading platforms in the sector. According to CoinGecko, Hyperliquid ranks as the sixth-largest decentralized exchange by trading volume. Separately, DefiLlama estimates that the protocol currently secures about $5.76 billion in total value locked.
The latest TradingView integration gives market participants another way to follow activity across Hyperliquid’s expanding ecosystem, combining live data from crypto perpetuals, spot assets, and Trade[XYZ]’s cross-asset markets within a single charting environment.

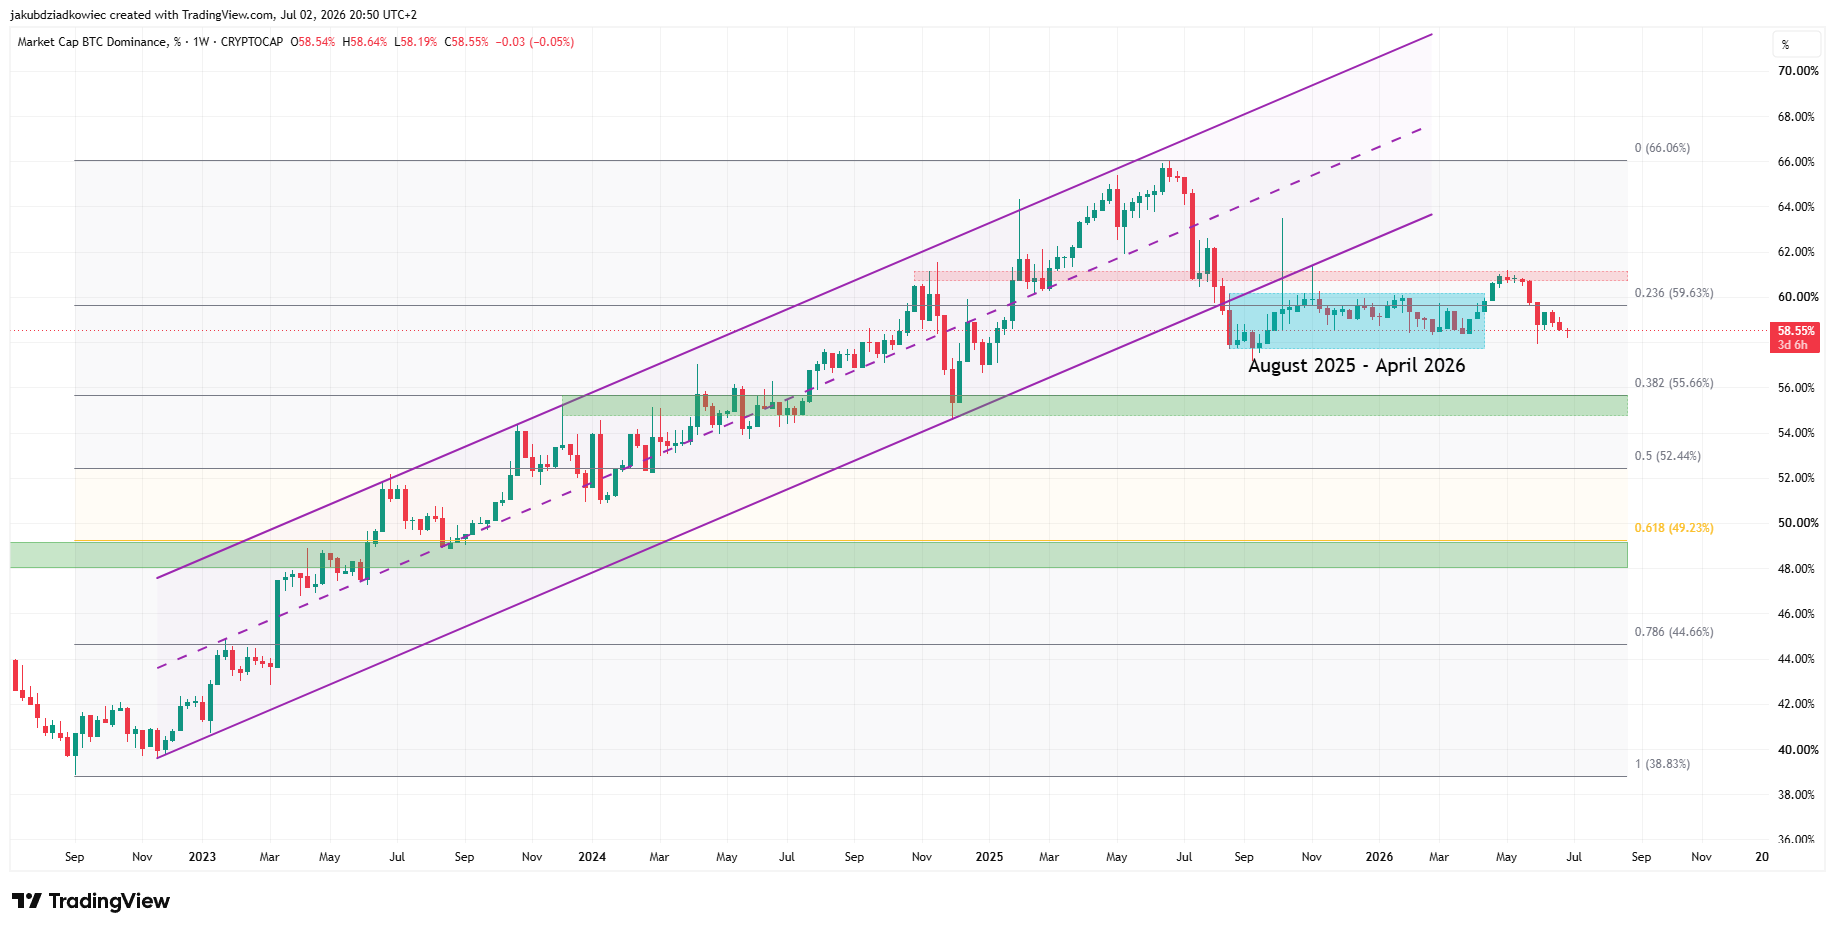
Bitcoin (BTC) dominance currently trades at 58.55% and tests the floor of a range that has held since August 2025. A confirmed breakdown would target 55.5%, the level many traders link to the start of a broad altcoin rotation.
The Crypto Fear and Greed Index sits predominantly in Extreme Fear recently, while the Altcoin Season Index remains neutral at 45. BeInCrypto reviews the weekly and daily BTC.D charts to assess whether the long-awaited altcoin season is finally near.
Bitcoin Dominance Breaks Its Multi-Year Uptrend
The weekly chart shows a long-term ascending parallel channel that dates back to late 2022. Bitcoin dominance broke down from this structure in August 2025, ending a multi-year uptrend. The breakdown initiated a sideways period that lasted until April 2026.
In May 2026, the metric rallied back to resistance near 61% and faced a firm rejection. BeInCrypto flagged this area when dominance first broke above 60% in April. BTC.D now trades back inside the former range, below the 0.236 Fibonacci retracement at 59.63%.

The Fibonacci ladder points to downside targets at 55.66%, 52.44%, and 49.23%. A popular trader on X shared a similar roadmap, calling 55% the trigger level for altcoin moves and 46.74% his final target. His last level sits lower because he anchors the retracement differently.
Daily Chart Points to a 55.5% Breakdown Target
Zooming in, the daily chart reveals a horizontal parallel channel between roughly 58% and 60.75% that also goes back to August 2025. Dominance now sits on the channel floor and tests a potential bearish breakdown.
Moreover, an ascending trendline from the September 2025 low broke down in June 2026. BTC.D retested the line as resistance in late June and turned lower. The failed retest adds a third bearish signal and pressures the relative position of altcoins, which have trailed Bitcoin since 2020.

If the channel gives way, the measured target sits near 55.5%. This projection converges with the weekly 0.382 Fibonacci support at 55.66%, creating a strong confluence zone. However, the daily Relative Strength Index (RSI) grinds higher near 40 and remains neutral, so the move still needs confirmation.
Extreme Fear Meets a Neutral Altcoin Season Index
Sentiment adds a contrarian layer to the technical picture. The Crypto Fear and Greed Index printed 19 while Bitcoin still hovered between $60,000 and $61,000, up from 11 July 1, and 12 last week. The gauge has spent a full month in Extreme Fear after June’s correction, driven by a hawkish Fed, geopolitical tensions, and record ETF outflows.
Historically, prolonged readings below 20 have clustered near market bottoms. The index hit a record low of five in February 2026.

Meanwhile, the Altcoin Season Index from BlockchainCenter stands at 45, almost exactly halfway between Bitcoin season and altcoin season. The index flags altseason only when 75% of the top 50 coins beat Bitcoin over 90 days.
No true altcoin season has arrived since the current dominance structure formed in late 2022. Some experts argue the rotation cannot start until global liquidity expands again.

Bitcoin trades near $61,616, up 2.4% in the last 24 hours, according to CoinGecko. For altcoin holders, the setup remains binary. A weekly close below 55.66% would validate the rotation thesis, while a reclaim of 59.63% would keep capital parked in Bitcoin.
The post Bitcoin Dominance Tests Key Support: Is the Long-Awaited Altcoin Season Finally Near? appeared first on BeInCrypto.

Ripple signed on to a dollar stablecoin backed by Visa, Mastercard, and BlackRock. It is not Ripple’s coin, and it does not launch on the XRP Ledger. So the question every XRP holder is asking is simple: does any of this actually help the token?
Summary
- On June 30, 2026, Ripple joined Open USD, or OUSD, a consortium dollar stablecoin backed by more than 140 companies including Visa, Mastercard, Stripe, BlackRock, BNY, Coinbase, and Google, as a day-one integration partner.
- OUSD is not a Ripple product. It is run by an independent organization called Open Standard, and it launches on Solana, Stellar, Base, and Polygon later in 2026, not on the XRP Ledger.
- Ripple kept its own stablecoin, RLUSD, and joined OUSD anyway, a hedge that puts the XRP Ledger forward as a possible rail while ensuring Ripple benefits from the traffic whichever stablecoin wins.
- The bull case for XRP is that a larger stablecoin market means more cross-currency flows for market makers to bridge, a role XRP can fill. The bear case is that OUSD competes directly with RLUSD, does not run on the XRP Ledger at launch, and a win for Ripple the company is not a win for the token.
- The deeper story is a challenge to Tether and Circle: OUSD shares its reserve income with partners instead of keeping it, inverting the economics that built the stablecoin giants.
Every so often, Ripple turns up somewhere that makes XRP holders pay attention, and the launch lineup for Open USD is the latest. On June 30, 2026, Ripple signed on as a day-one integration partner to a new dollar stablecoin backed by Mastercard, Visa, Stripe, BlackRock, and more than 140 other companies. The headline reads like a win for Ripple, and it may well be one for the company. Whether it does anything for XRP, the token, is a separate and much harder question, and the answer runs through two details most coverage skips: OUSD is not Ripple’s coin, and it does not launch on the XRP Ledger.
This piece works through what Open USD is, why Ripple joined a project that competes with its own stablecoin, and what the move means for both RLUSD and XRP. The same distinction keeps returning across Ripple’s 2026 story: a Ripple win is not an XRP win unless there is a clear transmission mechanism from the company’s progress to token demand. Open USD is one more test of that rule. It is a company-level strategy first, and only a token catalyst if the usage eventually reaches XRP.
What Open USD actually is
Start with the thing itself, because the branding invites confusion. Open USD is a dollar-backed stablecoin created by Open Standard, an independent organization set up to run and govern the coin, with a board drawn from its partners and Zach Abrams as founding chief executive. It is not issued or controlled by Ripple. Ripple is one name on a launch roster that reads like a directory of global finance and technology: Visa, Mastercard, Stripe, BlackRock, BNY, Coinbase, Google, IBM, OKX, Standard Chartered, Shopify, and more than 140 companies spanning banking, payments, technology, and crypto.
The coin is planned to go live later in 2026. The design is where OUSD gets interesting, because it goes straight at the business model that built the stablecoin giants. Businesses will be able to mint and redeem OUSD with no fees and no volume limits. More striking, most of the income thrown off by the coin’s reserves, the interest earned on the dollars backing it, goes to the participating businesses after a small management fee, instead of being kept by a single issuer.
That is close to the opposite of how Tether and Circle operate. Tether earned more than $10 billion in 2025 almost entirely from interest on its reserves, and Circle makes money the same way while handing about half of it to Coinbase for distribution. OUSD hands the float back to the network, which is a direct attack on the issuer-keeps-the-interest model. For readers new to the category, OUSD is still a dollar-backed stablecoin; what differs is who gets the economics.
The launch chains matter for the rest of this analysis, so note them precisely. OUSD is set to go live on Solana, with Stellar, Base, and Polygon in the mix, and Solana is being highlighted as a native day-one chain. The XRP Ledger is not among the launch networks. That single fact reshapes what Ripple’s participation can realistically mean for XRP, and we will return to it.
Why Ripple joined a rival to its own stablecoin
The obvious objection is that Ripple already has a stablecoin. RLUSD launched at the end of 2024 and has grown into a top-ten dollar token. So why would Ripple help build a competitor chasing the same institutional payments customers? The answer lies in how Ripple joined and in a strategy already visible across the industry.
By signing on as an integration partner rather than an issuer, Ripple keeps RLUSD and still positions the XRP Ledger as one of the rails OUSD could eventually run on. In that framing, Ripple wins traffic no matter which stablecoin comes out on top, because its ledger and its payment infrastructure can carry flows for the winner. This fits a pattern the big card networks set over the past year. Mastercard has spent that time settling payments across several blockchains and already handles Ripple’s own RLUSD alongside USDC, positioning itself as neutral infrastructure instead of the backer of any single issuer.
Ripple is doing the same thing: putting itself forward as neutral ground to claim a spot on as many rails as possible. Seen that way, joining OUSD is a hedge, not a contradiction. If OUSD becomes the dominant enterprise stablecoin, Ripple wants to be inside it. If RLUSD holds its ground, Ripple still has its own product. And if the market fragments across several coins, Ripple’s infrastructure can move value between them.
For Ripple the company, that is a sensible bet in every direction. The harder question is what any of it does for the token that XRP holders own. This is where RLUSD versus XRP becomes more than a pricing debate. Ripple can expand its stablecoin reach and its institutional relevance while XRP still waits for direct demand.
The catch: Open USD does not launch on the XRP Ledger
Here is the detail that undercuts the simplest bullish reading. OUSD is launching on Solana, Stellar, Base, and Polygon, not on the XRP Ledger. Ripple joined the consortium, but its own ledger is not among the chains carrying the coin at launch. The crypto analyst who goes by WrathofKahneman flagged this in a July 1 thread, noting that the absence left traders asking what Ripple actually gets from the deal and whether XRP benefits at all.
The gap matters because the standard XRP-benefits argument assumes the XRP Ledger carries the stablecoin’s traffic, generating activity and demand tied to the token. If OUSD does not run on the ledger, that direct channel does not exist at launch. Ripple’s integration-partner status keeps the door open to adding the XRP Ledger later, and Ripple can still route value between OUSD on other chains and RLUSD on the ledger, but the immediate, mechanical link many holders imagined is not there on day one.
This is the recurring problem with reading Ripple corporate news as XRP news. Ripple the company can join a landmark consortium, position its rails, and benefit commercially, all without the token capturing much of the value. The XRP Ledger not being a launch chain for OUSD is the clearest illustration yet that a Ripple win and an XRP win are not the same event. The market will need usage data, not a partner logo, before treating this as an XRP catalyst.
The bull case for XRP
There is still a credible, if indirect, argument that XRP benefits, and it runs through market structure instead of through the ledger carrying OUSD directly. Start with the size of the pie. If OUSD succeeds in bringing a wave of new institutional payment flows on-chain, the total volume of dollars moving across blockchains grows. Larger, more fragmented stablecoin markets create more price gaps between venues, chains, and currency pairs, and those gaps are filled by market makers who arbitrage them.
A fast, cheap bridge asset is useful in that role, and XRP was designed to be exactly that. The mechanism does not require any enterprise to touch XRP directly. An institution can use OUSD or RLUSD for settlement and never think about XRP, while market makers behind the scenes move value between OUSD, RLUSD, fiat pairs, and other assets, sometimes reaching for XRP because it is fast and cheap at the moment they need it. That activity tightens spreads and can lift volumes in XRP pairs tied to the growing stablecoin mesh.
Geography reinforces the point. RLUSD is now available in Japan after regulatory approval and is rolling out to institutions in Turkey through local partners, and those corridors are practical instead of speculative. If OUSD shows up as a settlement coin at global partners while RLUSD deepens in real corridors, the web of rails expands, and each new connection creates small arbitrage windows that a bridge asset can fill. The optimistic reading, then, is that Ripple has bought a seat at the table of the most heavily backed stablecoin ever launched, and that a bigger, busier stablecoin economy is good for an asset built to move liquidity between its pieces.
The bull does not need the XRP Ledger to carry OUSD at launch. The bull needs the overall market to grow and stay fragmented enough that bridging has value. That is the most credible XRP-positive version of the story. It is indirect, but it is not imaginary.
The bear case for XRP
The skeptical case is more concrete, and it starts with cannibalization. OUSD competes directly with RLUSD. Both target institutional payments and settlement, and both chase the same enterprise customers. Ripple joining a rival that goes after its own product’s market is a strange look, and at least one analyst noted the obvious tension: if OUSD competes with RLUSD, where does that leave RLUSD?
A consortium coin with Visa, Mastercard, and BlackRock behind it and a revenue-sharing model is a formidable competitor for a single-issuer stablecoin, even one with Ripple’s regulatory standing. Then there is the ledger problem already covered: OUSD does not launch on the XRP Ledger, so the direct on-chain benefit to XRP is absent at the start. Even if OUSD were added to the ledger later, XRP Ledger transaction fees are tiny, fractions of a cent, so a stablecoin moving across it would consume only a trickle of XRP through the network’s small transaction burn. The value of stablecoin traffic accrues mostly to the issuer, the rails operator, and the partners sharing reserve income, not to the ledger’s native token.
The track record hangs over all of it. Ripple has stacked up regulatory wins, ETF launches, acquisitions, and partnerships over the past year, and XRP has still fallen, trading near a multi-month low. Good news has repeatedly failed to move the token, which suggests the market already prices Ripple’s corporate progress separately from XRP demand. That is why institutional XRP demand matters more than institutional Ripple headlines. If the buyers are buying Ripple’s rails, RLUSD, or OUSD rather than XRP itself, the token’s price still lacks the direct bid holders need.
Finally, the consortium itself is unproven. Coinbase helped found the original USDC governance body, the Centre Consortium, with Circle in 2018, and that arrangement ended in acrimony and a nine-figure buyout by 2023. Whether a 140-member consortium governs any more durably than a two-member one did is an open question, and Ripple’s day-one hedge could look prescient or could look like a bet on a coin that never gains traction.
What it means for RLUSD
The most direct casualty of the OUSD launch may be RLUSD, and the timing is unkind. Ripple’s stablecoin has been contracting rather than growing, slipping from a peak near $1.7 billion in market value toward roughly $1.4 billion, even as Ripple expanded it into Japan through regulatory approval and into Turkey through local partners. Launching a consortium rival backed by the largest names in payments into that softness sharpens the competitive pressure on a coin already losing ground.
RLUSD is not without strengths. It is issued by a Ripple subsidiary under a New York trust charter, carries approvals in New York and Dubai, and has been built around regulatory standing and enterprise payments from the start. It runs on both the XRP Ledger and Ethereum, and Ripple-linked reporting has pointed to billions in RLUSD volume routed through XRP Ledger pairs since launch, which supports ledger activity even if it has not lifted the token’s price. Those are real assets in a market where regulatory clarity and compliance matter to institutions.
The strategic read is that Ripple is refusing to bet everything on RLUSD winning outright. By keeping RLUSD and joining OUSD, it hedges against its own stablecoin losing the institutional race, accepting more competition for RLUSD in exchange for a stake in whatever coin dominates. That is rational for the company and uncomfortable for RLUSD partisans, because it signals that Ripple itself is not certain its stablecoin wins. For the broader market, the more important shift is the revenue-sharing model OUSD introduces, which pressures every issuer, RLUSD included, to justify keeping the float that stablecoins have always quietly earned.
What would make it a real catalyst for XRP
Cutting through the announcements, the question for XRP holders is what evidence would turn OUSD from a headline into a genuine driver of token demand. The first thing to watch is listings and liquidity. If major exchanges roll out OUSD and RLUSD trading pairs widely, and market makers post tight two-sided quotes with XRP sitting in the settlement path, that is a more credible signal than any press release, because it shows XRP actually being used to bridge the new flows.
The second is whether the XRP Ledger gets added as an OUSD rail over time. Ripple’s integration-partner role leaves that possible, and if it happens, the ledger would carry some OUSD traffic directly, a more concrete link than the market-maker channel. The third is real usage rather than announced partnerships: circulating supply growth for OUSD, partner-led mint and redeem activity, merchant payment volume, and sustained peg stability, the metrics that separate a working stablecoin from a launch-day roster. Until those appear, OUSD is a promising structure with famous backers and little proven adoption.
The honest conclusion is that Ripple joining Open USD is a clear positive for Ripple the company and an ambiguous event for XRP the token. It expands Ripple’s footprint, hedges its stablecoin bet, and positions its rails inside the most heavily backed stablecoin project yet attempted. For XRP, the benefit is indirect, contingent on market-maker behavior and future ledger integration, and offset by direct competition with RLUSD and the plain fact that the coin does not launch on the XRP Ledger. As always with Ripple news, the safest move is to separate the company’s progress from the token’s, and to watch usage instead of announcements.
The stablecoin war Open USD just escalated
Zoom out from Ripple, and the launch is best read as a shot in a widening stablecoin war. The market reaction told the story within hours. Shares of Circle, the issuer of USDC that went public earlier in 2026, fell by double digits on the news, as traders priced Open USD as a direct threat to the two incumbents that dominate the market, Tether and Circle. Some analysts pushed back, with William Blair calling the selloff an overreaction and arguing that USDC’s proven liquidity and institutional footprint would be hard for any newcomer to replicate.
The disagreement is itself the point: a launch-day partner list, however impressive, is not the same as adoption, and the market is unsure how much of a threat the consortium really is. The competitive backdrop explains why the roster drew blood. Tether and Circle have built enormously profitable businesses on a simple model, taking in dollars, parking them in safe assets like Treasury bills, and keeping the interest while the coin circulates free to use. That float income runs into the billions of dollars a year for the largest issuer alone.
Open USD aims a revenue-sharing model straight at that economics, returning most of the reserve income to the businesses that drive adoption. If payment networks and platforms can earn a share of the float by supporting a coin, the incentive to promote it changes, and that is what makes a consortium of card networks, banks, and technology firms a different kind of competitor from a standalone issuer. There is a regulatory current underneath all of this. Stablecoin legislation in the U.S. has moved from uncertainty toward a defined framework, giving banks, payment networks, and large enterprises the confidence to enter a market many had watched from the sidelines.
Open USD, with its lineup of regulated financial institutions, is a product of that shift as much as a response to it. The same clarity that let Circle go public and let Ripple pursue trust charters for RLUSD is what makes a 140-member consortium coin plausible in the first place. For XRP, the widening war cuts both ways, and it sharpens the analysis already laid out. A world with more stablecoins, more issuers, and more chains is a world with more fragmentation, and fragmentation is where a bridge asset earns its keep, moving value between coins and currencies that do not settle directly against one another.
That is the structural case for XRP in a multi-stablecoin market. The offsetting risk is that the winners of the stablecoin war may build their own settlement mesh across the chains they favor, and if the XRP Ledger is not among those chains, as it is not for Open USD at launch, XRP could find the bridging work routed around it. The token’s relevance in this new landscape depends less on how many consortiums Ripple joins and more on whether market makers keep reaching for XRP when they move value across an increasingly crowded field of dollar tokens. The launch, then, is a marker of how fast the stablecoin market is maturing from a two-issuer contest into an infrastructure battle among the largest names in finance.
Ripple has positioned itself inside that battle on multiple sides at once. Whether XRP the token shares in the outcome is the question the next year of usage data, not the launch-day roster, will answer.
Frequently asked questions
Is Open USD a Ripple stablecoin?
No. Open USD, or OUSD, is issued and governed by an independent organization called Open Standard, with a board drawn from its partner companies. Ripple is one of more than 140 partners and joined as a day-one integration partner, not as the issuer. Ripple kept its own separate stablecoin, RLUSD, which it issues through a subsidiary under a New York trust charter.
Who is backing Open USD?
Open USD launched with a roster of more than 140 companies spanning payments, banking, technology, and crypto, including Visa, Mastercard, Stripe, BlackRock, BNY, Coinbase, Google, IBM, OKX, Standard Chartered, and Shopify, among others. The coin is run by the independent Open Standard organization and is planned to go live later in 2026 across several blockchains. The size and quality of the partner list are the main reason the launch drew market attention.
Does Open USD run on the XRP Ledger?
Not at launch. Open USD is set to go live on Solana, Stellar, Base, and Polygon, with Solana highlighted as a native day-one chain. The XRP Ledger is not among the launch networks. Ripple’s integration-partner status leaves open the possibility of adding the ledger later, but the direct on-chain link to XRP does not exist at launch.
Why did Ripple join a stablecoin that competes with RLUSD?
Ripple appears to be hedging. By keeping RLUSD and joining OUSD as an integration partner, it positions its infrastructure to benefit whichever stablecoin wins, and it can route value between OUSD on other chains and RLUSD on the XRP Ledger. It mirrors how card networks like Mastercard now settle across many chains and multiple stablecoins instead of backing a single issuer. That is sensible for Ripple the company, even if it complicates the RLUSD story.
Does Open USD help the XRP price?
The benefit is indirect and uncertain. A larger stablecoin market can create more cross-currency flows for market makers to bridge, a role XRP can fill, which could lift volumes in XRP pairs. But OUSD does not launch on the XRP Ledger, XRP Ledger fees are tiny, and Ripple’s past wins have not lifted the token. A win for Ripple the company is not automatically a win for XRP.
How is Open USD different from Tether and Circle?
Open USD inverts the core economics. Tether and Circle keep the interest earned on their reserves, which has made them enormously profitable. Open USD instead shares most of that reserve income with its participating businesses after a small management fee, and lets businesses mint and redeem without fees or volume limits. That model is a direct challenge to the issuer-keeps-the-float approach that built the stablecoin giants.
What does Open USD mean for RLUSD?
It intensifies competition. OUSD targets the same institutional payments and settlement market as RLUSD, and it arrives while RLUSD has been contracting, slipping from a peak near $1.7 billion toward roughly $1.4 billion, even as Ripple expanded it into Japan and Turkey. Ripple keeping RLUSD while joining OUSD signals it is not betting everything on its own stablecoin winning the institutional race outright. It also pressures RLUSD to prove adoption through real payment and settlement volume.
What should XRP holders watch to judge the impact?
Watch for real usage instead of announcements. Key signals include major exchanges listing OUSD and RLUSD pairs with market makers quoting XRP in the settlement path, the XRP Ledger being added as an OUSD rail over time, and adoption metrics such as circulating supply growth, mint and redeem activity, merchant volume, and sustained peg stability. Those separate a working stablecoin from a launch-day partner list. Until those signals appear, the XRP impact remains speculative.
Disclaimer: This article is for information purposes only and does not constitute financial, investment, or trading advice. Cryptocurrency prices are highly volatile, and the success of new stablecoins and consortium projects is uncertain and can change. Nothing here is a recommendation to buy or sell any asset. Always do your own research and verify current figures on reputable data platforms before making financial decisions. Information is accurate as of July 2, 2026, and may change.
Solana price has erased much of June’s decline by reclaiming the $80 level, with record transaction activity and a technical breakout driving fresh optimism.
Summary
- Solana price has reclaimed the $80 level after record network activity and governance upgrades boosted buying momentum.
- Technical indicators favor further gains, with the next major resistance and liquidation cluster sitting near $90.
- Analysts remain divided as bullish momentum strengthens, while some traders warn the rally still faces key resistance.
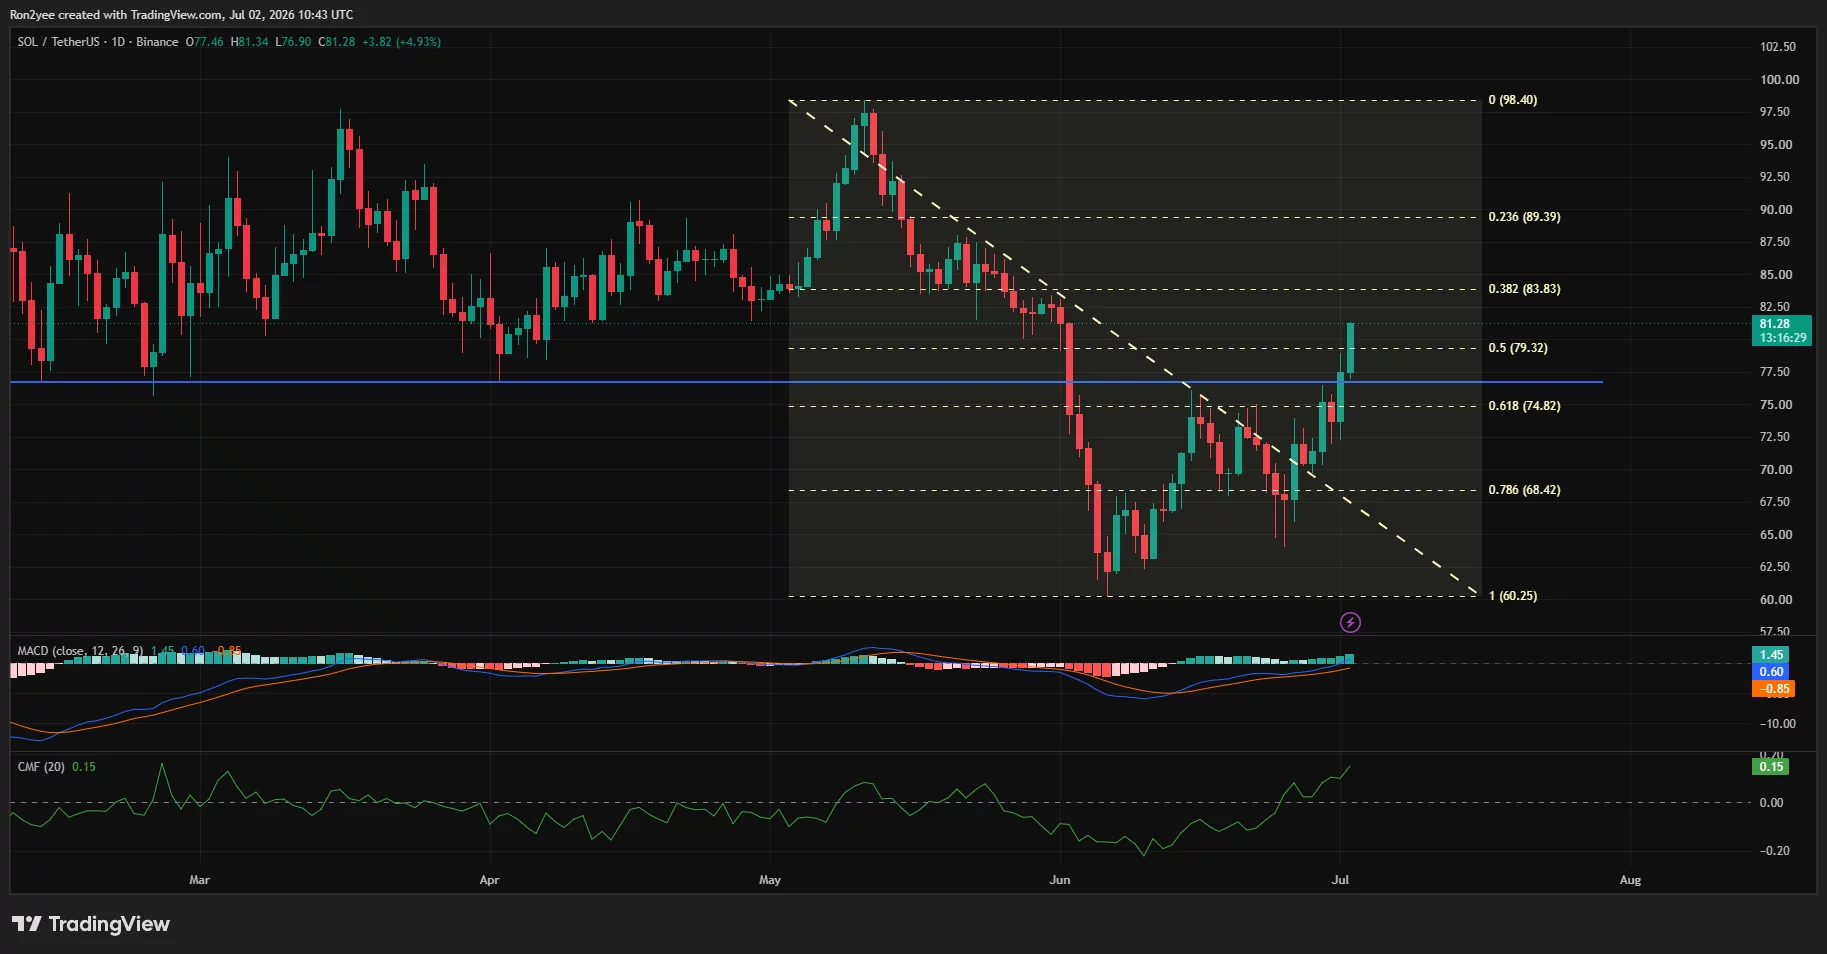
According to crypto.news data, Solana (SOL) price traded around $81.3 at the time of writing, up nearly 10% over the past 24 hours after breaking above the psychological $80 barrier for the first time in weeks. The recovery followed a series of network milestones that revived investor sentiment, while the broader crypto market also benefited from improving risk appetite after June’s steep correction.
Fresh on-chain data added fundamental support to the rally. Solana recently activated its Governance Proposal (SGP) framework, allowing validators and delegators to vote directly on network decisions. At the same time, the blockchain recorded an all-time monthly high of 3.77 billion non-vote transactions over the past 30 days.
Network activity also continued to dominate tokenized equities, with Solana processing more than $3.31 billion in decentralized stock trading and capturing roughly 95.6% of the sector’s volume. The network has now led all Layer-1 blockchains in decentralized application revenue for nine consecutive quarters.
Speculative demand has also remained elevated around Solana’s expanding ecosystem. Meme coin launchpads continue generating substantial protocol fees, while anticipation surrounding the Alpenglow consensus upgrade has encouraged traders to accumulate ahead of the expected third-quarter mainnet rollout. The upgrade is designed to reduce transaction finality to around 100 milliseconds, one of the fastest settlement targets among major public blockchains.
Technical breakout opens path toward the $89–$90 resistance zone
The daily chart shows Solana rebounding strongly after finding support near the 78.6% Fibonacci retracement around $68.4, where buyers defended the June selloff and formed a double-bottom structure. The latest advance has broken above a descending trendline that capped prices throughout the second half of June while also reclaiming the 61.8% Fibonacci level near $74.8.

Momentum indicators have strengthened alongside the breakout. The MACD has completed a bullish crossover with expanding positive histogram bars, while the Chaikin Money Flow has climbed above zero to 0.15, showing capital has returned to the asset after weeks of distribution.
The next technical hurdle sits near the 50% Fibonacci retracement around $79.3, which has already been reclaimed, leaving the 38.2% retracement near $83.8 and the 23.6% level around $89.4 as the next upside objectives before the late-May high near $98.
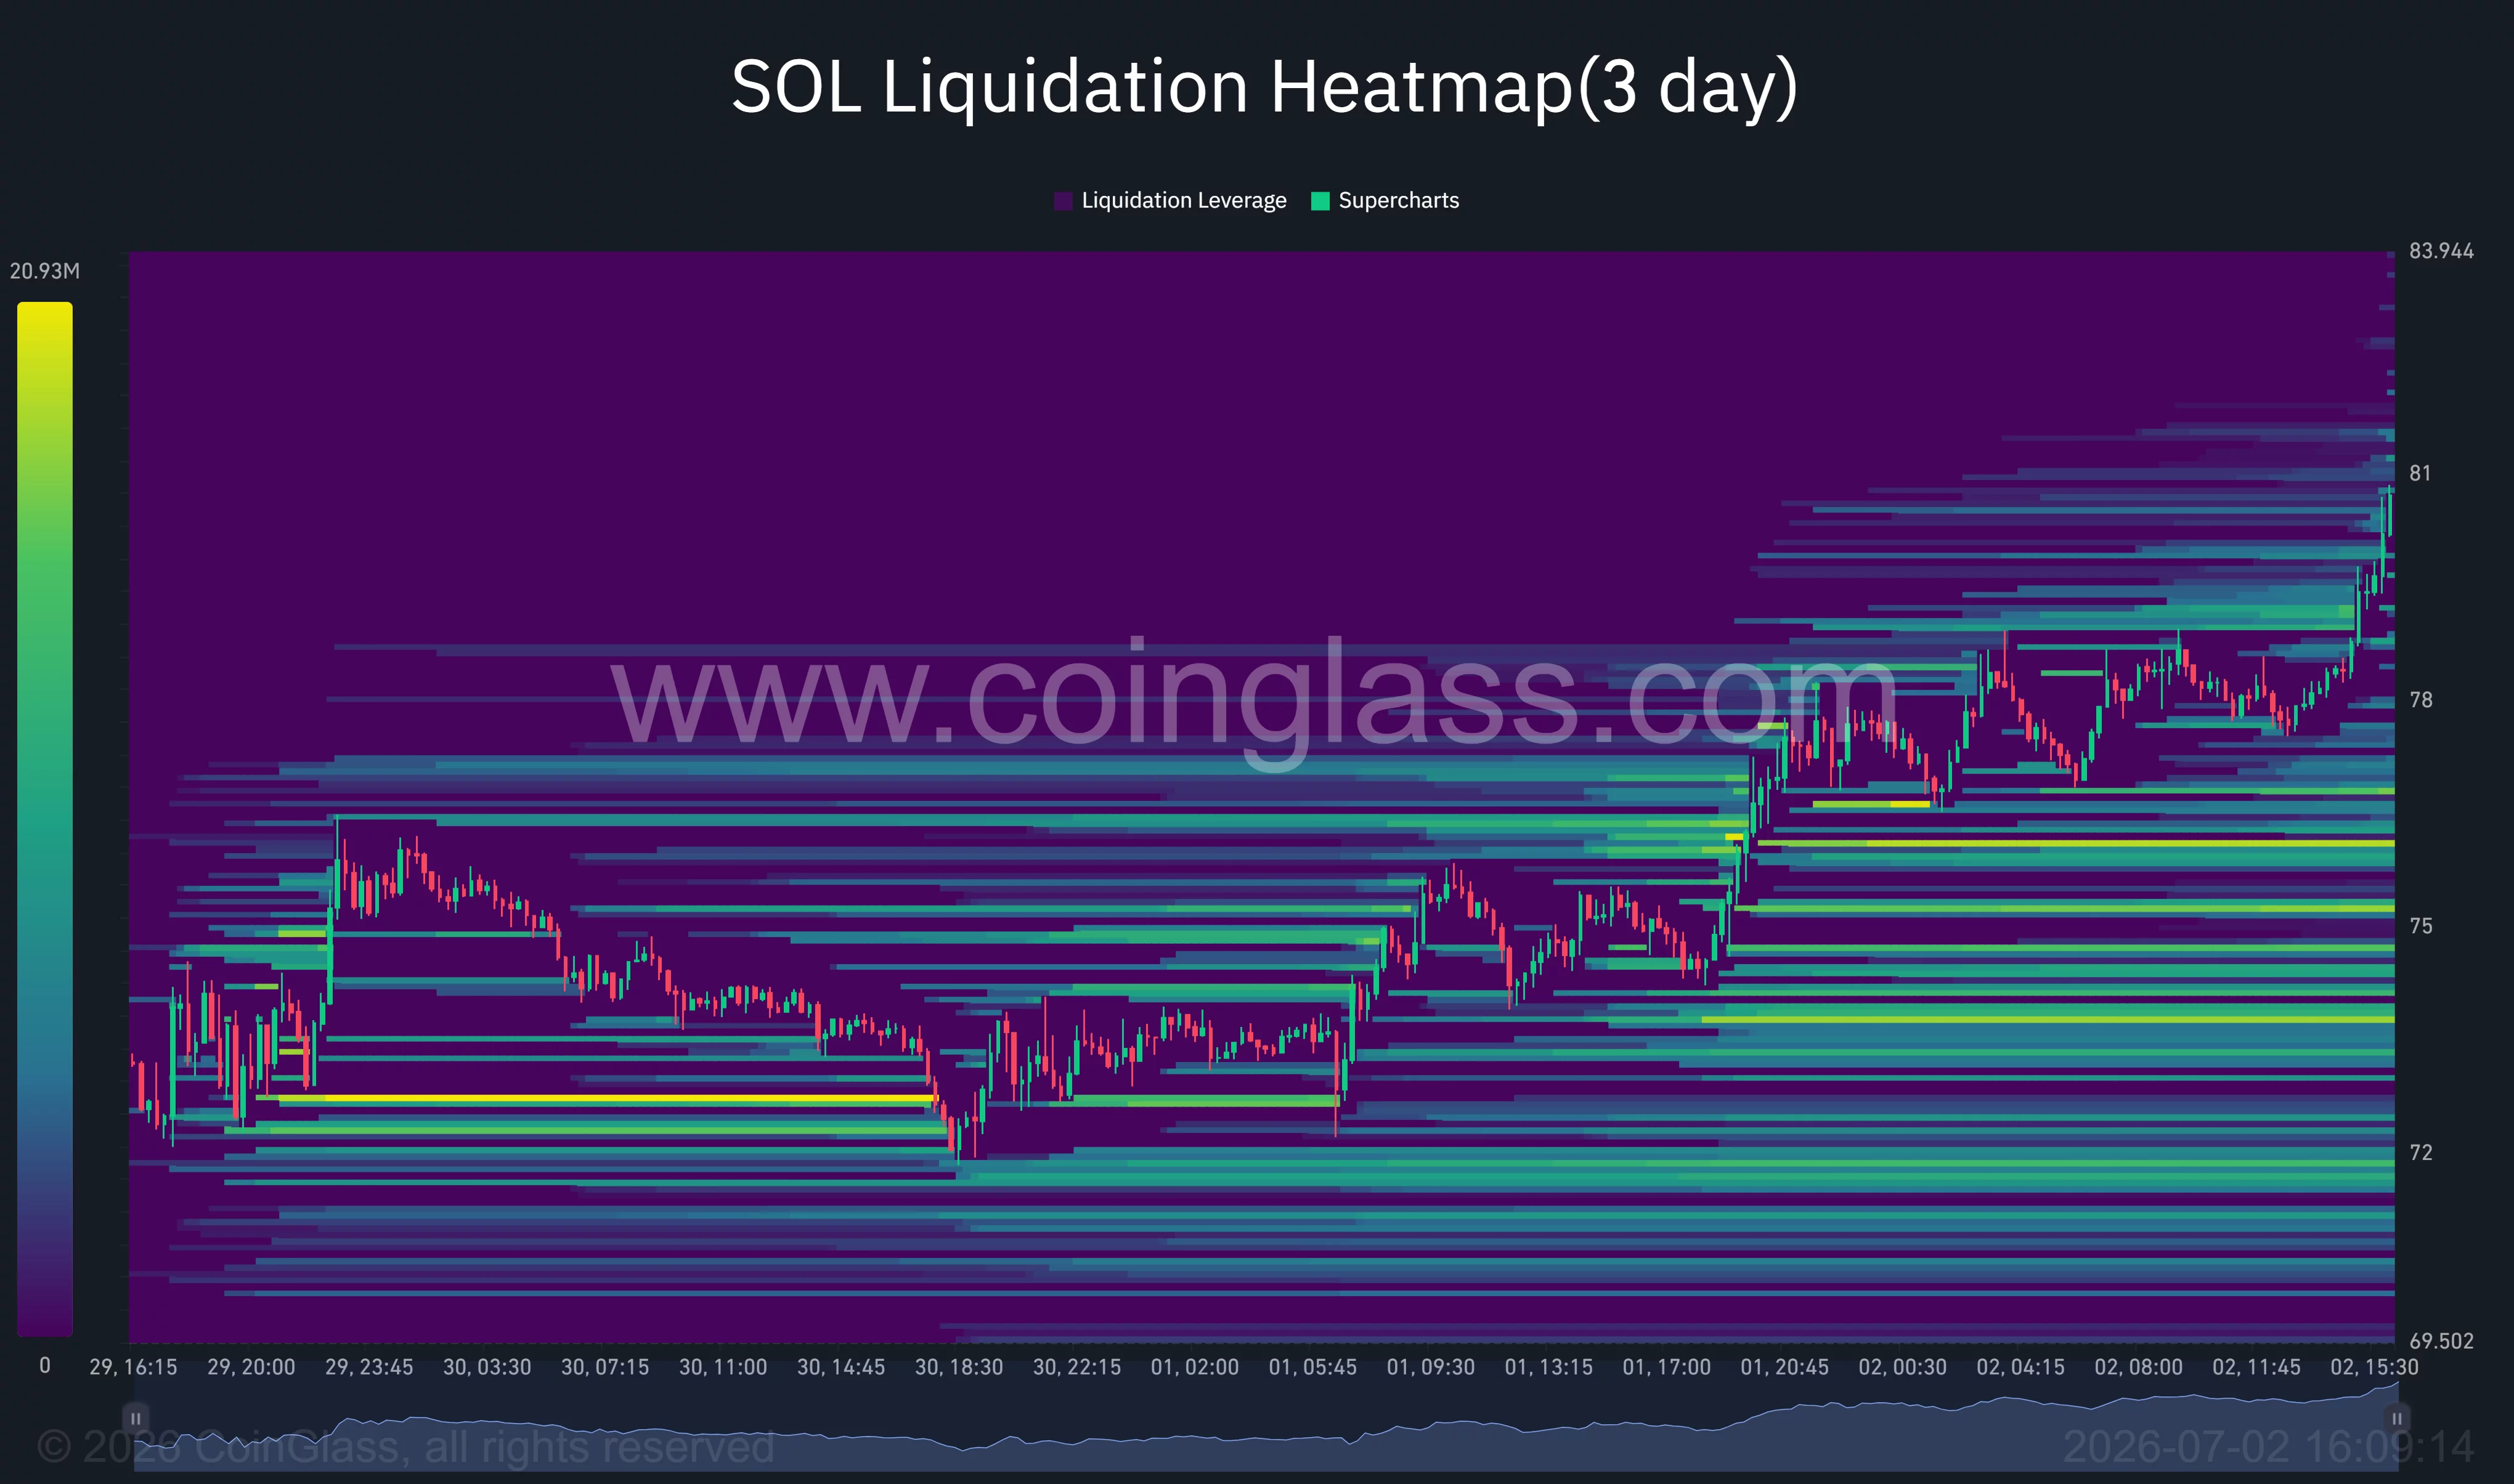
Derivatives positioning also supports higher volatility. CoinGlass liquidation heatmaps show a dense concentration of leveraged short positions clustered between $82 and $84, with another significant liquidity pocket extending toward $89. A continued push higher could trigger additional short liquidations, accelerating any move toward the $90 region.
Commenting on the market structure, analyst Michaël van de Poppe wrote, “SOL is in an uptrend against BTC… buy the dip territory on this one,” adding that he expects the trend to continue into August and September after Solana broke above key daily moving-average resistance against Bitcoin.
Failure to hold above $80 could revive bearish pressure
Not every analyst expects the recovery to continue uninterrupted. According to crypto analyst BATMAN, Solana is once again testing a major resistance area that has rejected price several times this year. He warned that a bearish divergence on the stochastic oscillator raises the possibility of another rejection if buyers fail to sustain momentum.
Macro conditions also remain a risk. Elevated U.S. interest rates continue to compete with speculative assets for institutional capital, while digital asset investment products have experienced intermittent ETF outflows in recent weeks. Any renewed deterioration in global risk appetite or delays to U.S. crypto legislation could reduce buying interest.
From a technical perspective, losing the reclaimed $79-$80 area would weaken the current breakout and expose support near $74.8, followed by the June demand zone around $68.4. Holding above those levels keeps the recovery structure intact, while a decisive break above $83.8 could open the way for an advance toward the $89-$90 resistance band.
Disclosure: This article does not represent investment advice. The content and materials featured on this page are for educational purposes only.
Tokenization platform Securitize began trading on the New York Stock Exchange on Thursday after completing a merger with a special-purpose acquisition company supported by Cantor Fitzgerald. The company’s public debut also came with an expansion of its on-chain offering: it launched tokenized versions of its own shares on both Avalanche and Solana for eligible US investors.
Securitize, backed by BlackRock and Morgan Stanley, started NYSE trading under the ticker SECZ. Alongside the NYSE listing, the firm said its tokenized shares will be issued on-chain and made available through its platform, positioning the launch as a test of how regulated equity tokenization can operate within existing US rules.
Key takeaways
- Securitize’s NYSE debut (SECZ) was paired with a first-day rollout of issuer-sponsored tokenized shares on Avalanche and Solana.
- The company is framing tokenization as compliant under existing US securities laws, with access gated by onboarding and eligibility checks.
- SEC guidance and later delays highlight that regulatory implementation details for tokenized equities remain an active area of focus.
- Institutional interest in tokenization is growing, supported by market estimates that place tokenized real-world assets at more than $43 billion.
From SPAC merger to on-chain stock access
Securitize’s path to public markets involved merging with an SPAC backed by Cantor Fitzgerald, enabling it to list on the NYSE. On Thursday, the company began trading under SECZ and concurrently announced the deployment of tokenized versions of its own shares on the Avalanche and Solana networks.
In its announcement, Securitize said these tokenized shares will be available to eligible investors in the US via its platform. The firm emphasized that this is not an experiment detached from traditional market structure, but rather an extension of its issuer-sponsored model—where the company’s shares are tokenized with the issuer positioned at the center of issuance and access.
The launch matters for investors and builders because it attempts to connect a mainstream equity listing to on-chain distribution in a way that regulators can audit. It also serves as a practical stress test for the operational requirements associated with KYC and AML controls that many tokenized asset proposals depend on.
What Securitize says about US regulatory compliance
Securitize’s core argument is that tokenized securities can be issued and accessed in the United States without rewriting the legal framework. According to the company, tokenizing its stock demonstrates that tokenized securities “can be issued and accessed in the US under existing securities laws and market structure.”
The company also stated that on-chain access will be subject to onboarding, eligibility screening, and customer identity and money-laundering checks. That emphasis on compliance gating is consistent with how issuer-sponsored structures typically seek to keep regulated investor protections intact while moving settlement and transfer mechanics onto blockchain infrastructure.
In comments shared by the company, Securitize co-founder and CEO Carlos Domingo said tokenizing SECZ on its first day as a public company functions as a form of validation for the firm’s broader thesis. He also stressed that SECZ would not be “a synthetic token or offshore wrapper,” describing it instead as issuer-sponsored tokenization of the same common stock trading on the NYSE, distributed through regulated infrastructure.
Separately, the article notes that the US Securities and Exchange Commission clarified in January that issuer-sponsored tokenized securities remain subject to US securities laws. Earlier coverage from Cointelegraph also reported that the SEC was reportedly moving toward an innovation-related exemption for tokenized stock trading, but the plan was later delayed after concerns from stock exchange officials over implementation.
For market participants, the takeaway is that regulatory acceptance is not only about whether tokenized stocks are possible, but also about the mechanics: how trading, access, and compliance are operationalized across venues and platforms.
Debut performance and the broader tokenized assets market
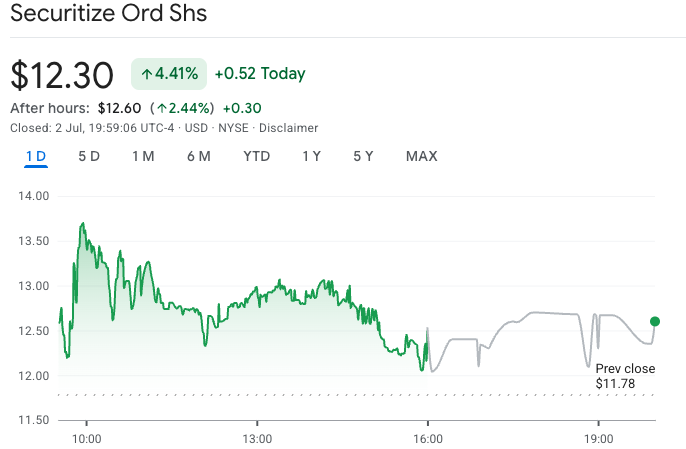
On Thursday, Securitize shares reached a high of $13.70 during the trading session, later ending the day at $12.30—a gain of 4.4%. The share price continued to rise after hours, climbing an additional 2.4% to $12.60.
The public-market milestone arrives after Securitize raised $400 million in its offering at a valuation of more than $1 billion. Beyond the company-specific story, the timing aligns with sustained institutional interest in tokenized real-world assets and the infrastructure needed to support them.
Token Terminal estimates that the tokenized real-world assets market exceeds $43 billion, with tokenized money market funds representing most of that figure. The same data suggests tokenized commodities are nearly $7 billion, and tokenized stocks are around $1.6 billion.
Looking ahead, Citigroup has predicted—per a report referenced in the coverage—that the tokenization market could expand to $5.5 trillion to $8.2 trillion by 2030. While those projections are forward-looking and depend on regulatory progress and adoption across financial institutions, they help explain why equity tokenization is drawing attention from traditional finance.
Why the Avalanche and Solana choice is part of the story
Securitize’s decision to issue tokenized versions of SECZ on both Avalanche and Solana signals that the company intends to reach investors through multiple blockchain ecosystems rather than a single network. While the exact technical and operational details are not spelled out in the provided coverage, the dual-launch approach reflects a broader industry pattern: tokenized securities providers often aim to reduce friction for users by supporting the networks where capital and liquidity are already active.
At the same time, the launch doesn’t remove uncertainty. The company’s announcements repeatedly tie tokenized access to eligibility, onboarding, and identity and AML checks, and recent SEC-related developments—such as the clarification that issuer-sponsored tokenized securities remain under securities laws—underscore that compliance obligations remain central.
Investors should watch how tokenized SECZ trading and access work in practice over the coming weeks—especially whether onboarding and eligibility requirements prove smooth for eligible participants, and how regulators and stock exchange operators continue to clarify the path for tokenized equities as the market moves from pilots toward scaling.


Public miners have dumped Bitcoin at a record pace, hashprice has collapsed to post-halving lows, and older machines are switching off. That is the textbook definition of capitulation. The harder question is whether it marks a bottom or the start of a deeper shakeout.
Summary
- Publicly traded Bitcoin miners sold more than 32,000 BTC in the first quarter of 2026, a single-quarter record that exceeded their combined sales for all of 2025 and topped the roughly 20,000 BTC sold during the Terra-Luna collapse in 2022.
- The pressure is economic: hashprice, the revenue a miner earns per unit of computing power, fell to post-halving lows in the high-$20s per petahash per day by mid-2026, well below the roughly $35 breakeven for older machines, putting a large share of the industry underwater.
- Network hashrate has started to fall as older hardware powers down, the classic signature of a miner capitulation, in which the least efficient operators stop mining at a loss.
- The bull reading is that capitulation has historically marked bottoms, because it clears weak capacity, lowers difficulty, and rewards the survivors. The bear reading is that this squeeze is structural, with heavy debt, record ETF outflows, and even Strategy turning seller removing the usual counterweight.
- Whether this is a bottom or a way station depends on whether Bitcoin can reclaim miner production cost, estimated by some near $80,000, against a price sitting closer to $58,000.
Bitcoin miners are supposed to be the market’s most committed holders, the operators who spend real money to produce coins and who have every incentive to keep them. So when miners start dumping Bitcoin at a record pace and switching off machines, the market pays attention, because it usually means something has broken in the economics of production. That is exactly what has happened through the first half of 2026. Public miners have sold more Bitcoin than in any prior quarter on record, hashprice has fallen to lows not seen since the last halving, and network hashrate has begun to slip as older rigs go dark.
This piece works through what is driving the selling, what capitulation actually means, and the real disagreement underneath it: whether a miner capitulation at these levels marks the bottom, as it often has, or whether this cycle is different. The signal matters because miners sit at the production edge of Bitcoin, where price, power costs, difficulty, debt, and treasury strategy meet. It also lands at a moment when Bitcoin sentiment is already washed out, making every capitulation signal easier to overread.
The record selling
The headline number is stark. Publicly traded mining companies, including MARA, CleanSpark, Riot Platforms, Cango, Core Scientific, and Bitdeer, collectively sold more than 32,000 Bitcoin in the first quarter of 2026, according to industry trackers. That figure set a single-quarter record. It exceeded what those same companies sold across all four quarters of 2025 combined, and it surpassed the roughly 20,000 Bitcoin they offloaded during the second quarter of 2022, the depths of the bear market that followed the Terra-Luna collapse.
When miners sell more in three months than they did in a full prior year, and more than during one of the worst crises in crypto history, the signal is hard to ignore. The individual disclosures fill in the picture. Riot Platforms sold 3,778 Bitcoin in the first quarter at an average price near $76,626, generating about $289.5 million, while producing only 1,473 coins in the same period, meaning it sold far more than it mined. Core Scientific liquidated roughly 1,900 Bitcoin worth about $175 million in January alone. Cango sold 2,000 Bitcoin in March for approximately $143 million, using the proceeds to retire Bitcoin-backed loans.
In a single week, MARA, Genius Group, and Nakamoto Holdings revealed combined sales of more than 15,000 coins, with the largest share from MARA. These were not routine sales of freshly mined coins to cover the power bill; they were drawdowns of treasury reserves the companies had previously chosen to hold. The trend shows up in the aggregate data too. The total Bitcoin held by miners, a metric some analysts call the miner reserve, has been declining since 2023, falling from more than 1.86 million coins at the end of that year toward roughly 1.8 million by mid-2026.
Selling that once looked like occasional balance-sheet management has become a sustained drawdown, and the pace accelerated as prices fell. The question is what forced it. The answer begins with mining economics, but it does not end there.
Why miners are selling
The answer is a profit squeeze that has been building since the last halving. The central metric is hashprice, which measures the daily revenue a miner earns per unit of computing power. Hashprice has been sliding since mid-2025, and by the first half of 2026 it had fallen to record post-halving lows, dropping into the high-$20s per petahash per day on some trackers, down roughly two-thirds from the October 2025 peak. The breakeven level for many miners running older equipment sits near $35 per petahash per day.
With hashprice well below that line, a large share of the industry, estimated at around a fifth at points earlier in the year, has been operating at a loss. Several forces compounded to produce that squeeze. The April 2024 halving cut the block reward in half, instantly halving the Bitcoin miners earn for the same work. Network difficulty has climbed relentlessly since, sitting roughly 10 times higher than in 2021, which means far more computing power now competes for that smaller reward.
Energy costs rose as Middle East conflict pushed oil higher and pressured power prices. Bitcoin itself fell, dropping toward a 21-month low near $58,000, so the coins miners produce are worth less at the moment they most need the cash. Taken together, mining profitability has compressed by close to an order of magnitude from its peak. Debt turned the squeeze into forced selling.
Aggregate miner debt surged over the past year, rising from around $2.1 billion to roughly $12.7 billion as companies borrowed to fund expansion, buy more efficient rigs, and diversify. Debt has to be serviced regardless of price, so when revenue collapses, miners with loan obligations have little choice but to sell coins or, in some cases, sell coins specifically to repay Bitcoin-backed loans. Some estimates put the all-in cost to produce a single Bitcoin near $80,000, well above the current price, which means the least efficient operators are now mining at a loss on every coin. That is the condition that forces capitulation.
What capitulation actually means
Capitulation is a loaded word, so it helps to define it precisely. In mining, capitulation is the point in a cycle where revenue falls below what a meaningful share of the network costs to run, and those operators power down their machines rather than keep mining at a loss. It is not a crash or a malfunction. It is the market clearing, the mechanism by which the least efficient capacity leaves the network when it can no longer pay for itself.
The signature of capitulation is a falling hashrate, and that is now visible. As unprofitable machines switch off, the total computing power securing the network declines. By mid-2026, a meaningful slice of older hardware had gone offline, and the 30-day average network hashrate had fallen by several % from its highs, after earlier swings in which difficulty dropped sharply and then rebounded as miners reconnected. When hashrate falls and stays down, Bitcoin’s built-in difficulty adjustment eventually lowers the bar, making it cheaper and more profitable to mine for the operators who remain.
That self-correcting loop is what distinguishes a mining capitulation from a permanent decline. Analysts track this through indicators built on hashrate momentum, which flag when short-term hashrate falls below its longer-term trend, historically a marker of miner stress and, often, of a market bottom forming. The pattern moves through recognizable stages: revenue falls below cost, weak operators power down, hashrate and difficulty drop, and the survivors, who sit on cheaper power and more efficient machines, absorb the share the leavers gave up and become more profitable. The shakeout is loud and it photographs like a collapse, but the underlying mechanism is orderly.
Whether that orderly clearing is bullish or bearish for the Bitcoin price is where the disagreement begins. For miners, capitulation is an industry sorting event. For traders, it is a possible bottom signal. Those are related, but not identical.
The bull case: capitulation marks bottoms
The optimistic reading rests on history. Miner capitulations have consistently preceded recoveries rather than endings. The logic is mechanical, not hopeful. When high-cost operators power down, network difficulty falls, which lowers the cost to mine for everyone still online.
The efficient survivors, running new machines on cheap power, then capture a larger share of a reward that has become cheaper to earn, so their margins expand even if the price does not move. The capitulation sorts the industry on a single variable, cost per hash, and consolidates it around its lowest-cost producers. For the price, the argument is that miner capitulation tends to coincide with peak seller exhaustion. Miners are a persistent source of supply, selling coins into the market to fund operations.
When the highest-cost miners give up and switch off, that stream of forced selling thins out, removing pressure that had been weighing on the price. Historically, the crossover in hashrate momentum indicators that signals capitulation has aligned with attractive long-term entry points, because it marks the moment the weakest hands, on the production side, have been washed out. The recovery mechanism has proven fast in the modern, industrialized mining sector. Earlier in 2026, a difficulty drop of around 11% was followed within two weeks by a record upward adjustment near 15% as miners reconnected the moment conditions eased.
That speed is the point: surviving operators are committed and well-capitalized enough to scale back up quickly when hashprice recovers. In this reading, the record selling and the falling hashrate are not a warning but a washout, the part of the cycle where the field clears before the next leg up. The bull case does not deny the pain. It argues that the pain is how the reset finishes.
The bear case: this squeeze may be structural
The skeptical reading argues that the usual capitulation-marks-a-bottom pattern assumes a market backdrop that no longer holds. The first difference is debt. The mining sector carries far more leverage than in past cycles, with aggregate debt having climbed toward $12.7 billion, which means capitulation now involves not just idle machines but the risk of defaults, forced liquidations, and distressed asset sales that can overhang the market longer than a simple hashrate reset would. The second and larger difference is who is buying.
In past capitulations, miner selling was absorbed by a mix of retail and, more recently, institutional demand. In 2026, the marginal buyer has turned into a seller. U.S. spot Bitcoin ETFs recorded their worst month on record in June, with roughly $4.5 billion in net outflows, removing the very demand channel that had absorbed supply on the way up. Even Bitcoin treasury companies, long the reliable counterweight to miner selling, have wobbled: the largest corporate holder made its first Bitcoin sale in years to fund a dividend and has come under pressure over its financing structure.
When miners sell into a market where ETFs are bleeding and the corporate bid is faltering, the supply has fewer places to go, and the price can keep falling even as capitulation runs its course. The third concern is duration. Capitulation clears quickly only if price recovers to pull survivors back and thin the selling. If Bitcoin remains stuck well below the estimated production cost for an extended period, held down by a hawkish Fed and tight liquidity, the squeeze can grind on, pushing even mid-cost operators toward the exit and turning a healthy shakeout into a prolonged contraction.
In this view, the capitulation signal is real, but the conditions that historically turned it into a bottom, rebounding demand and easing macro, are absent, so the pattern may not repeat on its usual schedule. This is also where Strategy’s balance sheet matters, because the market’s biggest corporate Bitcoin buyer is no longer treated as an unconditional bid. The bear case is not that miner capitulation does not exist. It is that capitulation may not be enough when the buyers are missing.
The AI pivot: capitulation or reinvention
There is a third storyline that complicates the simple capitulation frame, and it is specific to this cycle. Many miners are not simply powering down; they are repurposing. The same data centers, power contracts, and cooling infrastructure that mine Bitcoin can, with investment, host the computing demand of artificial intelligence and high-performance workloads, which command far higher and more stable revenue than mining at current hashprice. Several operators have pivoted hard in that direction, converting capacity or striking deals to serve AI customers instead of mining coins.
That pivot muddies the read on hashrate and selling. Some of the machines going dark are not distressed operators giving up but companies reallocating capacity to a more profitable use, and some of the Bitcoin being sold is funding that transition instead of covering losses. For those firms, selling coins and reducing mining is a strategic reallocation, not a capitulation in the traditional sense. It is a rational response to a world where a unit of power and compute is worth more pointed at AI than at a halved block reward.
The implication cuts both ways for Bitcoin. On one hand, the AI pivot means some hashrate decline reflects opportunity rather than distress, which is less bearish for the price and could permanently shrink the pool of forced sellers. On the other hand, it means the mining industry’s most valuable operators may increasingly treat Bitcoin as a secondary business, weakening the reflexive commitment that made miners such steadfast long-term holders. A sector that once mined and held because it believed in the asset is becoming a sector that mines, or computes, wherever the margin is best.
That shift also connects miners to the broader class of Bitcoin treasury companies, where balance-sheet Bitcoin is no longer always sacred. Coins can be collateral, reserves, working capital, or transition funding. In a tight market, that difference matters. It means miner selling is not always panic, but it is still supply.
The divergence that matters
Underneath all of it sits one divergence worth watching more than any single figure. On the supply side, miners are selling into weakness while their reserves shrink and their hashrate falls. On the demand side, the buyers who absorbed that supply on the way up have stepped back, with ETFs posting record outflows and the flagship corporate holder turning seller. In prior cycles, miner capitulation coincided with new demand stepping in at low prices, which is what turned the washout into a floor.
This time, the demand side is thinner precisely when the supply side is capitulating. That is why the capitulation signal, on its own, is not enough to call a bottom in 2026. The historical pattern is real, and the mechanics that clear weak capacity and reward survivors still function. But the pattern completed into a recovery in past cycles because demand returned to meet the reduced supply.
The open question now is whether a new source of demand, renewed ETF inflows, a macro shift toward easier policy, or a return of the corporate bid, arrives to meet the capitulating miners. Until it does, the cleaner read is that miners are doing exactly what they do at cycle lows, while the buyers who usually meet them there have not yet shown up. That makes this capitulation signal important, but incomplete. It is a setup, not a confirmation.
The same distinction applies to corporate Bitcoin holders. A company can hold Bitcoin and still create supply pressure if it sells, or demand if it accumulates. The market does not care which category a holder belongs to; it cares whether they are adding or removing coins from available supply. Right now, the supply-side pressure is visible, and the demand-side recovery has not yet proven itself.
What to watch
For anyone trying to judge whether this capitulation marks a turn, a handful of signals matter more than the daily price. The first is hashprice: a sustained recovery back above the roughly $35 per petahash breakeven would ease the forced selling at its source, while a further slide would deepen it. The second is hashrate and difficulty: a stabilization in network hashrate, followed by a downward difficulty adjustment, would confirm the clearing is working and would improve economics for the survivors. Momentum indicators built on hashrate crossing back above their longer-term trend have historically flagged the completion of a capitulation.
The third is the demand side, which this cycle makes decisive. A return of net inflows to spot Bitcoin ETFs would signal that the marginal buyer is back, and a resumption of corporate treasury accumulation would restore the counterweight to miner selling. The fourth is the price relative to production cost: Bitcoin reclaiming and holding above the estimated all-in cost to mine a coin would pull the economics back into profitability and remove the pressure driving the sales. Until those turn, the record miner selling and the falling hashrate tell a consistent story of an industry clearing its weakest capacity, with the crucial question, whether fresh demand arrives to complete the pattern, still unanswered.
That is the disciplined read. Miner capitulation can mark a bottom, but it does not create one by itself. It needs confirmation from price, hashprice, ETF flows, and corporate demand. Without that, capitulation remains evidence of stress, not proof of recovery.
Frequently asked questions
Why are Bitcoin miners selling so much Bitcoin?
Miners are selling because their economics have collapsed. Hashprice, the revenue earned per unit of computing power, fell to post-halving lows in the high-$20s per petahash per day by mid-2026, below the roughly $35 breakeven for older machines. The 2024 halving cut rewards, difficulty rose about 10 times from 2021, energy costs climbed, and Bitcoin fell toward a 21-month low, forcing miners with heavy debt to sell coins to cover costs.
How much Bitcoin did miners sell in 2026?
Publicly traded miners including MARA, CleanSpark, Riot, Cango, Core Scientific, and Bitdeer collectively sold more than 32,000 Bitcoin in the first quarter of 2026. That set a single-quarter record, exceeding their combined sales for all of 2025 and topping the roughly 20,000 Bitcoin sold during the 2022 Terra-Luna bear market. The total Bitcoin held by miners has fallen from about 1.86 million at the end of 2023 toward 1.8 million. The pace of selling shows miners treating reserves as working capital in a stressed market.
What is miner capitulation?
Miner capitulation is the point in a cycle where mining revenue falls below what a meaningful share of the network costs to run, so those operators power down instead of mining at a loss. Its signature is a falling network hashrate as unprofitable machines switch off. It is a market-clearing mechanism: weak capacity leaves, Bitcoin’s difficulty adjustment lowers the bar, and the efficient survivors become more profitable. It is painful for the sector but can improve economics for the miners that remain.
Does miner capitulation mean the price has bottomed?
Historically, miner capitulation has often preceded recoveries, because it clears weak capacity, lowers difficulty, and thins the forced selling that weighs on price. But that pattern completed into a bottom in past cycles because new demand stepped in at low prices. In 2026, ETFs have posted record outflows and even the largest corporate holder turned seller, so the usual demand counterweight is thinner, making the signal less reliable on its own. Capitulation is a bottoming condition, not a guaranteed bottom.
What is hashprice and why does it matter?
Hashprice is the daily revenue a miner earns per unit of computing power, typically quoted per petahash per second per day. It combines the Bitcoin price, network difficulty, and transaction fees into a single profitability measure. When hashprice falls below a miner’s cost to operate, roughly $35 per petahash for older machines, that operator loses money on every coin, which is what drives capitulation and forced selling. A recovery in hashprice would be one of the clearest signs the pressure is easing.
Are miners capitulating or pivoting to AI?
Both are happening, which complicates the read. Some miners are genuinely distressed and powering down, while others are repurposing their data centers, power contracts, and cooling infrastructure to serve artificial intelligence and high-performance computing, which pays more than mining at current hashprice. That means some hashrate decline reflects strategic reallocation instead of distress, and some coin sales fund the transition instead of covering losses. The result is a sector that is both stressed and reinventing itself.
How does this capitulation compare to past cycles?
The mechanics are familiar, but the backdrop differs in two ways. Miner debt is far higher, having climbed toward $12.7 billion, so capitulation now carries default and forced-liquidation risk. The demand side is weaker too, with spot ETFs recording their worst month on record in June and the flagship corporate buyer turning seller. Past capitulations resolved into bottoms partly because fresh demand met the reduced supply, which is less certain now.
What signals would show the capitulation is ending?
Watch four things: hashprice recovering back above the roughly $35 breakeven, network hashrate stabilizing followed by a downward difficulty adjustment, a return of net inflows to spot Bitcoin ETFs and corporate treasury buying, and Bitcoin reclaiming the estimated production cost near $80,000. Hashrate momentum indicators crossing back above their longer-term trend have historically marked the completion of a miner capitulation. In this cycle, ETF inflows may be the most important confirmation because they show the marginal buyer has returned.
Disclaimer: This article is for information and educational purposes only and does not constitute financial, investment, or trading advice. Cryptocurrency prices and mining economics are highly volatile, and historical patterns do not guarantee future outcomes. Nothing here is a recommendation to buy or sell any asset. Always do your own research and consider consulting a licensed professional before making financial decisions. Figures are accurate as of July 2, 2026, and will change.
US spot Bitcoin (BTC) exchange-traded funds (ETFs) recorded another $296 million in net outflows over the past 24 hours, equal to roughly 5,050 BTC. BlackRock led the redemptions, with Grayscale, Fidelity, and ARK Invest also posting losses.
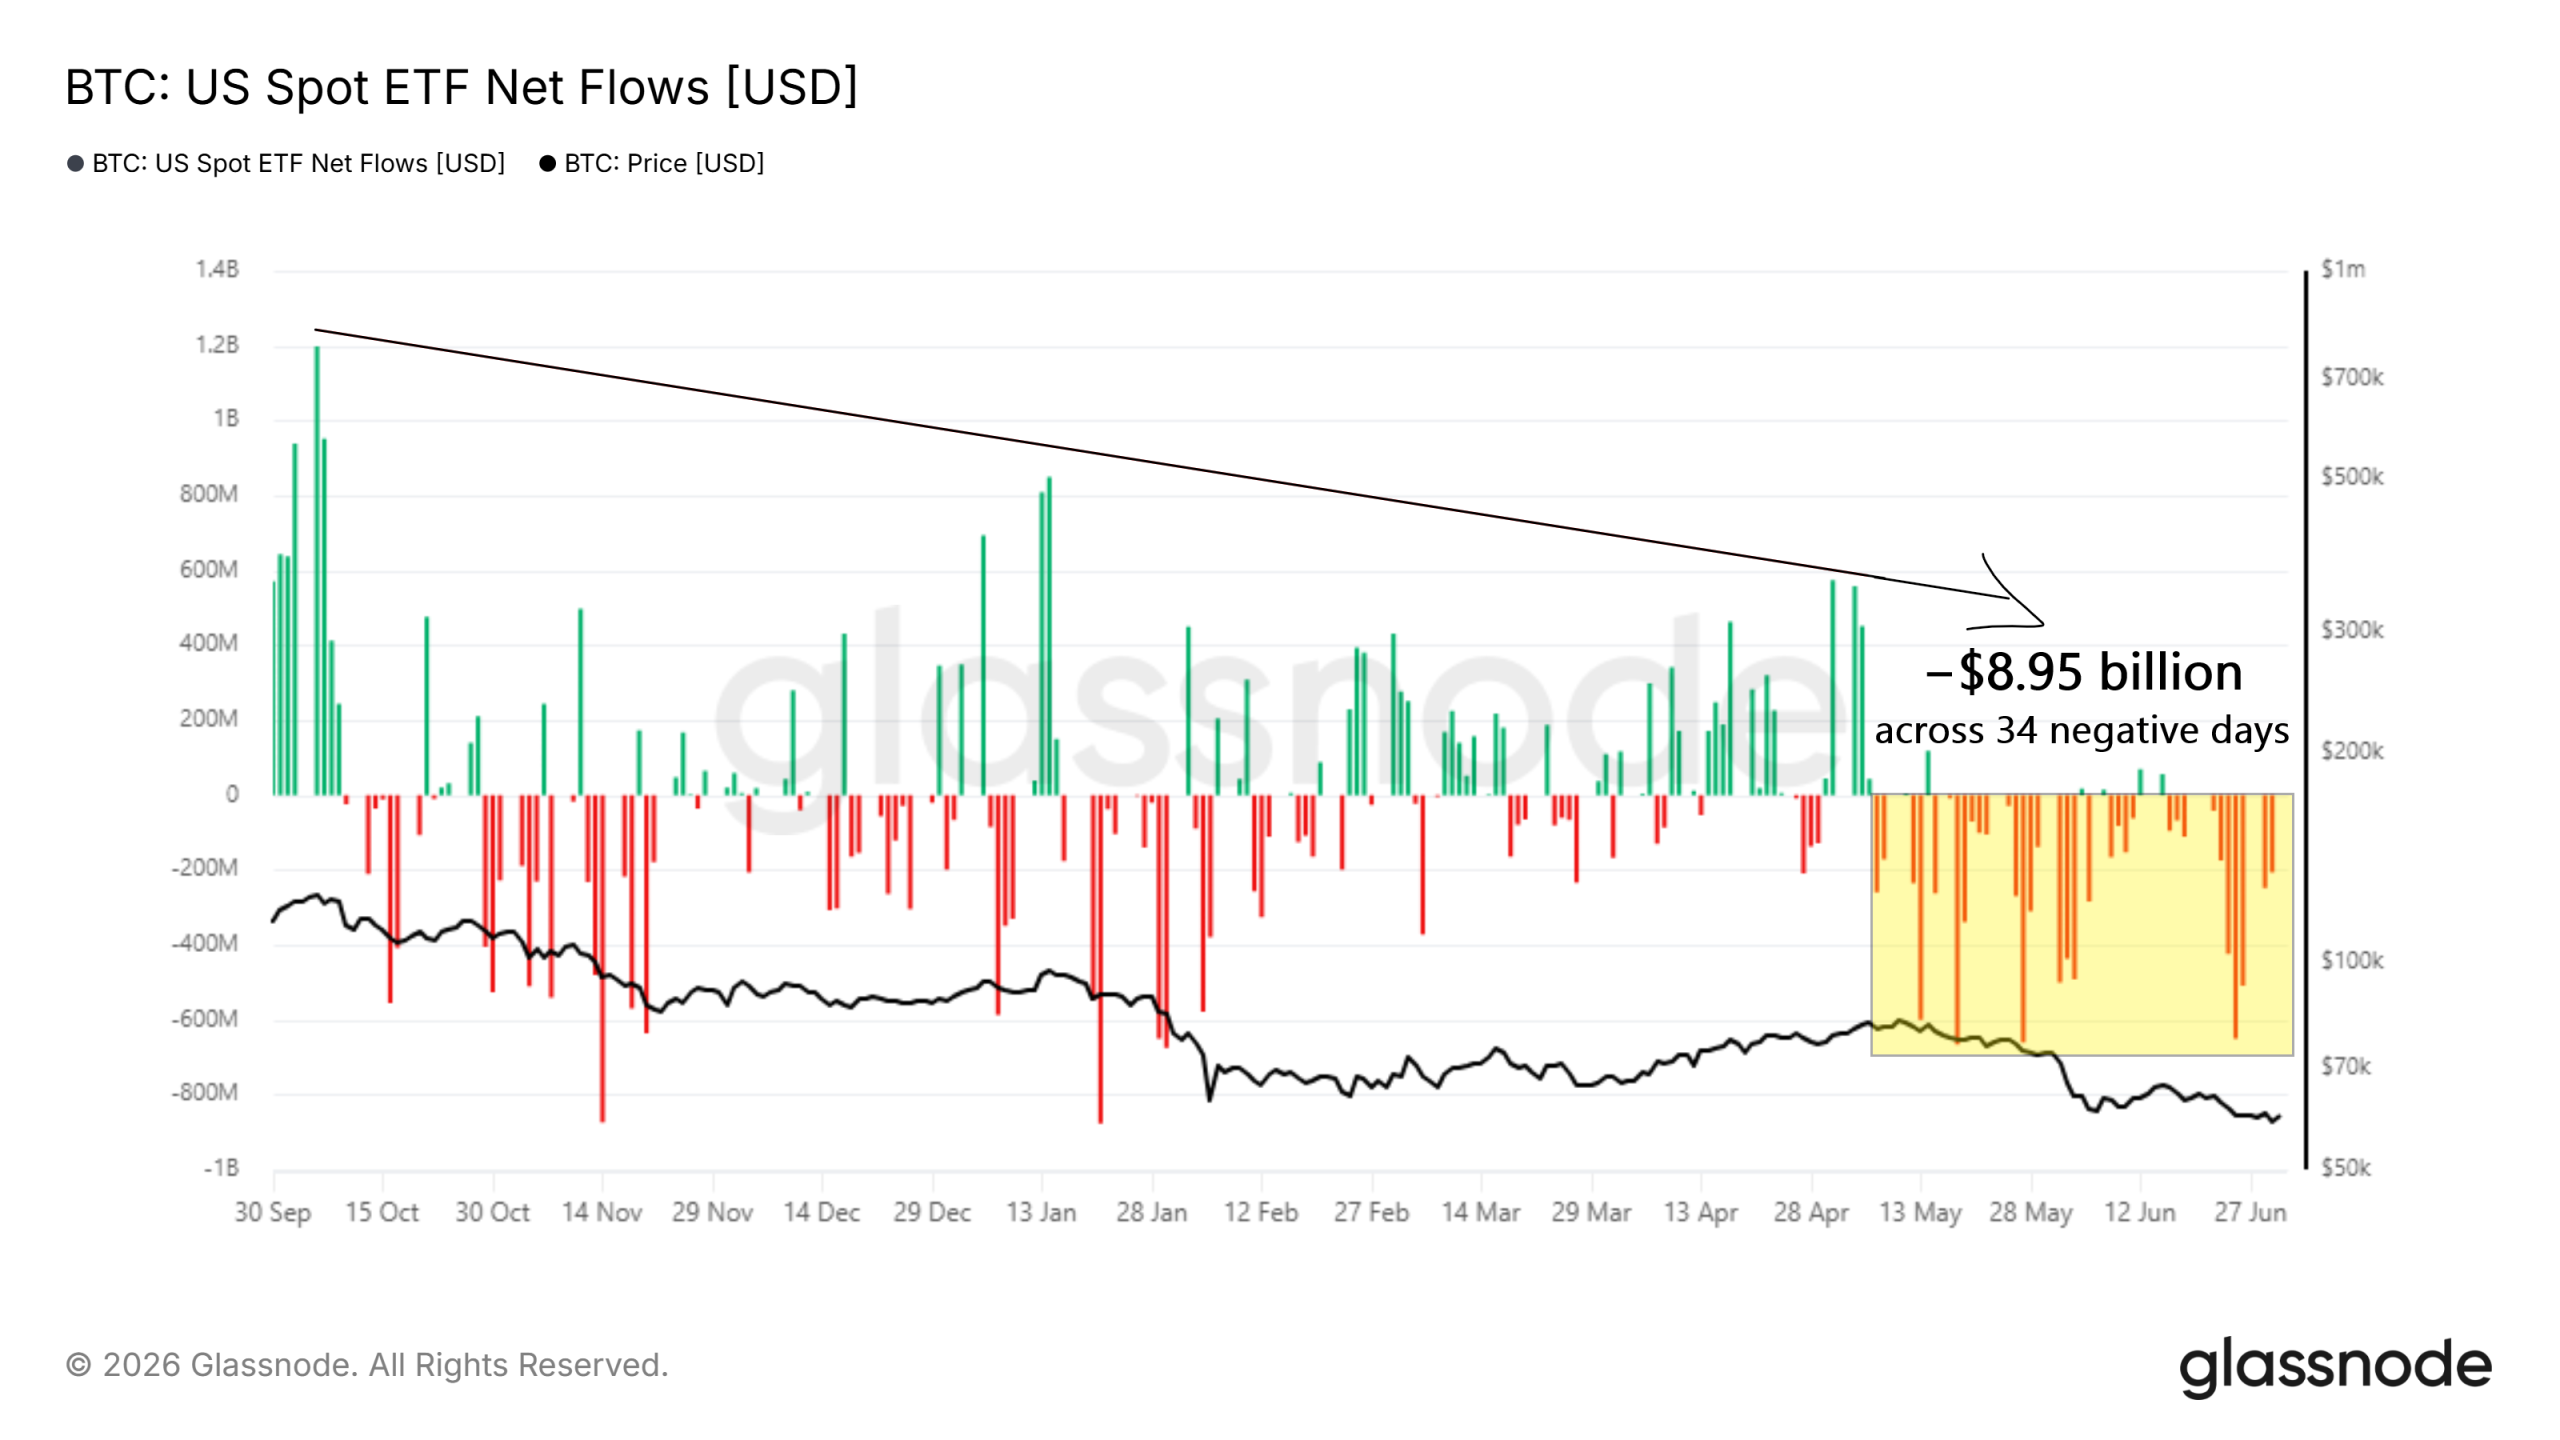
Glassnode data shows the sell-off has now reached $8.95 billion since May 7. Bitcoin trades near $61,600, up 2.4% in 24 hours, but flow data suggests the bounce rests on fragile ground.
ETF Outflows Total $8.95 Billion Across 34 Negative Days
Glassnode’s US spot ETF net flow data shows demand weakening since late September 2025. Daily inflows peaked above $1.2 billion back then. Since then, positive days have grown smaller and less frequent.
The decisive shift arrived on May 7. Since that date, the funds have posted only five positive sessions. The remaining 34 trading days were negative, draining $8.95 billion in total.

June alone accounted for $4.5 billion, the worst monthly outflow since the products launched in January 2024. Meanwhile, bitcoin fell 20.48% over the month, its steepest drop since June 2022.
In an X post, analyst That Martini Guy argued that the latest rebound changes little.
“Everyone got excited by yesterday’s bounce. But ETF selling hasn’t stopped. Funding is starting to shift, sentiment still looks fragile, and I don’t think the market structure has changed just yet.”
For the pressure to ease, the ETFs would need a sustained run of net inflows rather than isolated green days. So far, no such streak has appeared.
Coins Leave Exchanges, Yet Bitcoin Keeps Falling
Exchange balance data complicates the bearish picture. Glassnode’s net position change metric shows coins flowing out of exchanges since late May. Traders usually read such withdrawals as accumulation, because coins move into long-term storage.
However, history offers a warning. The current move is the third deep negative stretch since bitcoin’s all-time high in late 2025. The first ran from late October through December 2025. The second lasted from late January to early March 2026, when the metric dipped near minus $100 billion.

Each episode coincided with a continuation of the downtrend rather than a reversal (blue boxes). In contrast to the usual bullish reading, apparent accumulation has repeatedly failed to stop the decline. Deepening capitulation signals elsewhere on-chain tell a similar story.
Moreover, part of the withdrawal may reflect mechanics rather than fresh buying. Coins redeemed from ETFs can move between custody wallets and cold storage without touching order books. Weak US demand readings support that interpretation.
BTC Price Outlook Hinges on Slowing ETF Redemptions
The two datasets point to one conclusion. ETF flows, not exchange balances, currently set the marginal price of Bitcoin. Until redemptions slow, on-chain accumulation looks unable to absorb the selling.
BTC trades near $61,600 after a 2.4% daily gain. Nevertheless, the price has hovered just above $60,000 since mid-June. A decisive close below that area would confirm that redemption pressure still dominates the market.
Conversely, a sustained flip to net inflows could mark the first structural change since early May. Historically, flow reversals of that kind have preceded durable bottoms rather than followed them.
Until either signal appears, caution remains the sober reading of the data. The next leg depends on whether ETF holders stop selling before spot buyers give up.
The post Bitcoin ETFs Bleed $8.95 Billion in Two Months, and the Selling Isn’t Over appeared first on BeInCrypto.

Strategy’s era as the dominant Bitcoin buyer may have come to an end following last week’s STRC turmoil, which cast doubt on the company’s Bitcoin-buying strategy and sent the cryptocurrency to a nearly two-year low, according to Bitwise chief investment officer Matt Hougan.
“For years, Strategy has been the most dominant Bitcoin buyer in the world and a one-way source of Bitcoin demand. Those days are likely over,” Hougan said Thursday.
“I just expect it to be a less important figure in Bitcoin in the next cycle than it was in the last,” Hougan said, adding that investment banks, asset managers, pensions, endowments and sovereign wealth funds will likely replace Strategy as Bitcoin’s primary demand driver.
Confidence in Strategy’s Bitcoin-buying model weakened late last month when its main perpetual preferred stock offering — Stretch (STRC) — broke sharply from its $100 par value to below $75, raising fears that its dividend model was unsustainable.
The STRC incident coincided with Bitcoin (BTC) falling to a 21-month low of $58,190 on June 25, further rattling confidence across the crypto market.
Strategy responded by committing to sell Bitcoin where necessary to fund dividends and by expanding its US dollar reserve to $2.55 billion — easing immediate concerns but weakening its position as the industry’s most aggressive Bitcoin buyer, Hougan said.
Hougan said he still expects Strategy to be a “net buyer” in the next bull run, however.

Bitwise portfolio manager Gordon Grant (left) speaks with Hougan (right) about Strategy’s future outlook with STRC. Source: Bitwise
STRC example of “financial engineering” gone wrong
Hougan described the STRC incident as “classic end-of-cycle dynamics” and likened its collapse to a similar case of “financial engineering” in 2021, when Grayscale’s GBTC premium imploded.
“Money searching for high yields and low volatility was used to buy Bitcoin, which offers neither,” Hougan said. “This money never really fit Bitcoin. And so, it needs to be cleared out before we can find a bottom. That’s what’s happening today.”
Strategy’s issue with STRC overblown: Strive CEO
Strive CEO Matt Cole, however, said Strategy’s incident with STRC has drawn too much media attention and pushed down Bitcoin’s price more than it should have.
Related: Bitcoin doesn’t need Ethereum-style yield, says Strategy’s Michael Saylor
Speaking with NovaDius Wealth Management president Nate Geraci on Thursday, Cole noted that Strategy’s 847,363 Bitcoin represents just 4% of the total supply, and while Bitcoin isn’t a public company, by the US Securities and Exchange Commission’s standards, a 4% stake wouldn’t be considered material.
“If one person owned 4%, you don’t even have to report that publicly to the SEC because the SEC deems 4% to be immaterial. They start to view a position to be material at 5%.”
Strategy isn’t facing liquidity risk: Hougan
Despite concern over STRC, Hougan said Strategy has $52 billion worth of liquid assets marked against $7 billion of debt, and that Bitcoin would need to drop another 70% (about $18,500) for the company to be put at risk.
Hougan also noted that if Strategy were to start selling its Bitcoin today, it could cover dividends from STRC and its other perpetual preferred stock offerings for the next 28 years.
Magazine: Bitcoin decouples from tech stocks, Ether eyes ‘selling wave’: Market Moves
Tokenization platform Securitize rallied on its New York Stock Exchange debut on Thursday, as it brought tokenized versions of its shares to two blockchains.
The company, which is backed by BlackRock and Morgan Stanley, began trading on the NYSE under the ticker SECZ on Thursday after merging with a Cantor Fitzgerald-backed special-purpose acquisition company to take it public.
Securitize said Thursday that it simultaneously launched tokenized versions of its shares on the Avalanche and Solana blockchains, which will be available to eligible US investors on its platform.
It marks the first time a newly public company has also offered tokenized stocks, an area of crypto technology that has quickly gained attention among major institutions drawn to the idea that it can bring deeper liquidity and longer trading hours.
Securitize has carved out a lead in the tokenization space for institutions. It partnered with the NYSE in March to create tokenized assets for the exchange’s upcoming tokenized securities platform.
US laws allow for tokenized stocks, Securitize says
Securitize said that tokenizing its stock demonstrates that tokenized securities “can be issued and accessed in the US under existing securities laws and market structure,” adding that access will be subject to onboarding, eligibility, and customer ID and money-laundering checks.
“We have long said that public equities are moving on-chain, and there is no stronger validation of that belief than tokenizing our own public stock on Day 1,” said Securitize co-founder and CEO Carlos Domingo.
“SECZ is not a synthetic token or offshore wrapper. It is issuer-sponsored tokenization of the same common stock trading on the NYSE, made available through regulated infrastructure,” he added. “This is how tokenization should scale: with real ownership, regulatory clarity and the issuer at the center.”
The US Securities and Exchange Commission clarified in January that issuer-sponsored tokenized securities are still subject to US securities laws.
In mid-May, the SEC was reportedly ready to announce an exemption for the trading of tokenized stocks, but delayed the plan later that month after stock exchange officials raised concerns over how it would be implemented.
Securitize shares rise on debut
Shares in Securitize (SECZ) hit a high of $13.70 in trading Thursday but retracted slightly and ended the day at $12.30, a gain of 4.4%. The share price continued to climb 2.4% after-hours to $12.60.

Securitize ended its debut trading day on Thursday at a gain of nearly 4.5%. Source: Google Finance
Securitize raised $400 million from its public offering at a valuation of more than $1 billion.
The market for tokenized real-world assets currently exceeds $43 billion, the majority of which is tokenized money market funds, while tokenized commodities account for nearly $7 billion and tokenized stocks account for $1.6 billion, according to Token Terminal.
Analysts expect the tokenization market to grow quickly in the coming years, with Citigroup predicting last month that it could grow to between $5.5 trillion and $8.2 trillion by 2030.
Big Questions: Do we really only need 2–5 cryptocurrencies?
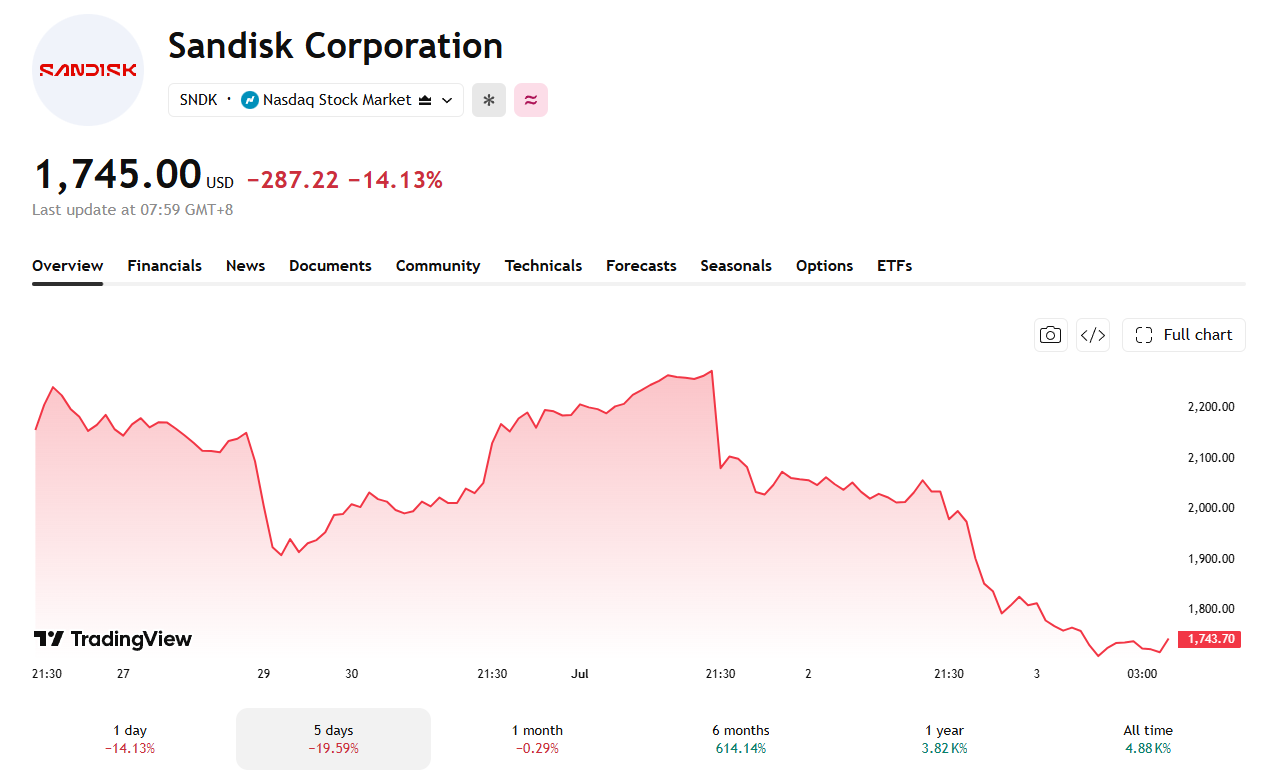
Over the last 24 hours, SanDisk shares sank 14.13%, Seagate dropped 10.38%, and Micron fell 5.49% as investors priced in a looming memory supply glut.
The three names have now lost 19.59%, 17.54%, and 14.36% over the past five sessions, respectively. That drop erases a chunk of 2026’s extraordinary rally.
A Glut Narrative Takes Hold
Morningstar’s director of research, Lorraine Tan, told Bloomberg TV that AI-linked stocks could fall 20% to 30% before becoming buyable again. She pointed to new supply coming from Samsung and SK Hynix and a potential plateau in AI capital spending.

Traders have turned that warning into this week’s working thesis. They are now questioning whether the pricing power behind the sector’s margin expansion can survive once fresh capacity lands.
A separate catalyst sharpened that realization. It was announced that Meta Platforms is building a cloud service to sell its own excess AI computing power. Investors took the plan as evidence that hyperscaler capex, and the chip demand tied to it, may be nearing a ceiling.

The news triggered a broad AI stock selloff that dragged memory and storage names down alongside chip equipment suppliers. A separate antitrust suit accusing Samsung, SK Hynix, and Micron of inflating DRAM prices has added to the scrutiny.

Bulls Push Back
Not every desk agrees with the glut thesis. Bank of America raised its SanDisk price target to $2,500 with a Buy rating. Citi made a similar call days earlier, lifting its own SanDisk target to the same level. Micron’s market capitalization surpassed Meta’s last month.
Micron reported fiscal third-quarter revenue of $41.46 billion, up 346% year over year, and guided fourth-quarter revenue to $50 billion. Micron stock still trades near seven times forward earnings even after the pullback.
Meta’s cloud ambitions could signal a genuine capex slowdown. They could also mark a new revenue stream layered onto continued AI spending. Either way, that question will likely shape the memory trade into next week.
The post AI Memory Supply Glut Fears Loom as SanDisk, Micron, Seagate All Plunge appeared first on BeInCrypto.


Bitcoin was sold as digital gold, an uncorrelated hedge that would hold up when markets broke. In 2026 it fell roughly 50% alongside the Nasdaq while gold hit record highs. So what is Bitcoin now, and did the hedge thesis ever survive contact with Wall Street?
Summary
- Bitcoin has spent 2026 moving with the Nasdaq rather than against it, with rolling correlations to U.S. tech indices reaching as high as 0.80 early in the year while its link to gold fell toward zero.
- The change traces to the spot ETF era: once institutions could hold Bitcoin inside the same portfolios as tech stocks, the same capital flows began driving both, tying Bitcoin to equity risk appetite.
- Analysts describe the current setup as the worst of both worlds, with Bitcoin taking the downside when stocks fall but not the full upside when they rally, behaving as a high-beta tail of macro risk instead of a standalone store of value.
- The counter-case is that Bitcoin is not a clean tech proxy either, since it fell on crypto-specific shocks even when tech rose, and that long-term holders kept accumulating, pointing toward an independent asset class instead of a tech clone.
- Whether the correlation is structural or a feature of the current tight-liquidity regime is the open question, and it decides whether the digital gold thesis is dead or merely dormant.
Bitcoin was supposed to be the asset that zigged when everything else zagged. For years it was sold as digital gold, an uncorrelated hedge that would protect a portfolio when stocks fell and uncertainty rose. In 2026, it has done close to the opposite. Bitcoin is down roughly 50% from its October 2025 record near $126,200, and it fell in near lockstep with technology stocks while gold climbed to record highs above $5,000 an ounce.
The asset marketed as a crisis hedge behaved like a leveraged bet on the same risk appetite that drives the Nasdaq. This piece works through the evidence that Bitcoin now trades like a tech stock, why that happened, and the serious counter-argument that the story is more complicated than a simple correlation chart suggests. The answer matters because it changes how investors should size Bitcoin, how they should compare it with gold, and whether the ETF era strengthened the asset or quietly rewired it into the same macro trade it was supposed to diversify away from.
The evidence: Bitcoin moves with the Nasdaq now
The correlation data is the starting point, and it is stark. Rolling 30-day correlations between Bitcoin and the Nasdaq 100 reached about 0.80 early in 2026, the highest level in close to four years, and Bitcoin’s longer-run five-year correlation with the tech-heavy index sits near 0.54. Standard Chartered analysts have pegged the Bitcoin-Nasdaq correlation around 0.5 with peaks near 0.8, while short-term readings against U.S. tech indices have ranged between roughly 0.55 and 0.68 through the year. However you measure it, Bitcoin and the Nasdaq have been moving together.
The relationship with gold has gone the other way. As Bitcoin’s tie to tech strengthened, its correlation with gold fell toward zero, at points reaching just 0.2. And the price paths made the divergence impossible to ignore. While Bitcoin dropped through 2026, gold surged to record highs above $5,000 and briefly toward $5,600 an ounce, outperforming Bitcoin by a wide margin over the same stretch.
The clearest test came under real stress. When conflict in the Middle East pushed oil higher and rattled markets, gold did what a safe haven does and climbed, while Bitcoin fell alongside risk assets. A hedge is supposed to prove itself precisely in those moments, and Bitcoin did not. The pattern that defined 2026 is simple to state: when the tech trade got hit, Bitcoin got hit, and when investors fled to safety, they chose gold.
Why the digital gold thesis mattered
To understand what has been lost, it helps to recall what the digital gold pitch actually claimed. Bitcoin’s founding appeal to institutions was not only its potential for gains but its supposed independence from everything else. It had a fixed supply capped at 21 million coins, no central issuer, and no cash flows tied to the economy, which in theory made it a store of value that would not move with stocks, bonds, or the business cycle. In its early years, Bitcoin was not just uncorrelated with equities; it was uncorrelated with nearly every major asset class, which made it look like the ultimate portfolio diversifier.
That property was the entire institutional case. A diversifier that zigs when the rest of a portfolio zags reduces overall risk, and that is worth paying for. Wall Street bought into the idea that Bitcoin could serve as a hedge against monetary debasement, market volatility, and economic uncertainty, a role gold has played for centuries. The digital gold narrative underpinned much of the adoption story, from corporate treasuries to the campaign for spot ETFs, because it promised something distinct from a simple speculative growth bet.
The trouble is that an asset’s identity depends not only on its design but on who owns it and how it is traded. Bitcoin’s code did not change in 2026. What changed is the profile of the people holding it and the machinery through which they buy and sell. That shift, more than anything about the protocol, is what turned the hedge into a high-beta risk asset.
What changed: the ETF made Bitcoin a portfolio asset
The pivotal event was the arrival of spot Bitcoin ETFs in January 2024, and the irony is sharp. The ETFs were celebrated as the moment Bitcoin was legitimized, folded into the regulated financial system at last. That same integration is what tied it to the equity market. Research published in late 2025 found robust evidence that ETF approval structurally altered Bitcoin’s role, marking a shift from an independent, idiosyncratic asset toward a conventional risk asset whose correlation with the S&P 500 rose sharply after the launch.
The mechanism is straightforward once you follow the money. Before ETFs, much of Bitcoin sat with crypto-native holders who traded it on its own logic. After ETFs, large institutions could hold Bitcoin exposure inside the same portfolios as their technology stocks, managed by the same risk desks using the same tools. When those desks adjust risk, they buy or sell Bitcoin and tech at the same time, for the same reasons, which welds the two together.
The marginal dollar in Bitcoin became, increasingly, the same dollar chasing artificial intelligence and growth equities, so when that dollar turned cautious, it sold both at once. This is the deeper story behind capital rotating into AI stocks that has drained crypto momentum all year. It is not only that money left Bitcoin for semiconductors; it is that the money still in Bitcoin now behaves like the money in tech, responding to the same Federal Reserve signals, the same liquidity conditions, and the same growth expectations. Bitcoin did not choose to become a tech stock. Its new owners made it one.
The worst of both worlds: downside without the upside
If Bitcoin simply tracked the Nasdaq one for one, that would be a clean story. The reality analysts have flagged is worse for holders. Trading firm Wintermute has argued that while Bitcoin’s directional correlation with the Nasdaq stayed high, the quality of that correlation deteriorated into what it called a bearish skew. In plain terms, Bitcoin has kept the downside beta, falling hard when equities fall, while losing much of the upside participation, failing to rally proportionally when equities recover.
Wintermute’s Jasper De Maere tied this to a shift in investor attention. As mindshare and risk-on capital crowded into mega-cap tech, Bitcoin remained correlated when global sentiment turned negative but stopped benefiting fully when optimism returned. He described Bitcoin as reacting like a high-beta tail of macro risk rather than a standalone narrative, keeping the downside beta while shedding the upside premium. The Kobeissi Letter put the same idea more bluntly, noting that Bitcoin was increasingly behaving like a leveraged technology stock.
That combination, all of the downside and only part of the upside, is the least attractive profile an asset can have. It means Bitcoin has been amplifying the pain of equity selloffs without delivering the diversification that justified holding it, and without matching the gains of the tech names it now mirrors. For a portfolio manager, an asset that adds volatility without adding either diversification or reliable upside is hard to defend, which is part of why some funds have re-labeled Bitcoin from a long-term hedge to a tactical growth position sized like any other speculative bet.
The counter-case: Bitcoin is decoupling, just not how bulls hoped
Here the story turns, because the simple tech-proxy narrative has a serious flaw. If Bitcoin were purely a leveraged Nasdaq, it would have risen when tech rose. Instead, for stretches since the October 2025 peak, Bitcoin fell while the Nasdaq strengthened, a divergence that some analysts said had rarely been so wide. Tech stocks climbed on strong earnings while Bitcoin dropped more than 30% from its high, driven by forces that had nothing to do with corporate profits.
Those forces were crypto-specific. The October 10 flash crash triggered a cascade of leveraged liquidations that hit Bitcoin while barely touching equities. Spot ETF outflows accelerated, pulling out the marginal buyer. The reflexive feedback loop around Bitcoin treasury companies like Strategy, most visibly Strategy, threatened to reverse from a buyer of last resort into a source of supply. And post-halving mining economics added their own pressure through miner selling pressure. None of that is in a Nasdaq chart.
So the honest reading is that Bitcoin is not a clean tech proxy: it takes the downside when tech falls, but it also falls on its own crypto-native shocks when tech rises. That is a worse outcome than pure correlation, but it also means Bitcoin is not simply a technology stock in disguise. The distinction matters for anyone trying to model the asset. A pure tech proxy would at least be predictable, rising and falling with the Nasdaq. What Bitcoin actually did in 2026 was absorb equity-market downside through the ETF-era ownership channel while simultaneously generating its own downside through leverage unwinds, ETF redemptions, treasury-company stress, and miner selling. It behaved less like gold, less like a clean tech stock, and more like a uniquely fragile hybrid during a bad year.
The maturation argument: a third asset class
There is a more optimistic frame that some analysts and long-term holders favor, which is that Bitcoin is becoming its own asset class instead of a copy of gold or tech. On this view, the correlation to equities is a phase driven by who happens to hold the marginal coin today, not a permanent identity. Bitcoin still has properties neither gold nor a tech stock shares: a hard-capped supply that cannot be expanded by decision, no cash flows or earnings to miss, and no management team or governance structure that can fail. Those features do not disappear because a correlation chart spikes.
The behavior of long-term holders supports the maturation read. During the same 2026 window when the ETF complex bled, the supply held by long-term holders moved in the opposite direction, with those flows running far larger in magnitude than ETF flows and skewing toward net accumulation. In other words, the traders treating Bitcoin as a high-beta risk asset were selling through ETFs, while conviction holders who treat it as a long-term store of value were buying. Two different populations, two different theses, playing out in the same asset at the same time.
Which group defines Bitcoin’s identity depends on which one is setting the marginal price, and that can change. Standard Chartered, for its part, has kept multiyear price targets well above current levels even while acknowledging the rotation into AI, framing the moment as a question of timing and competition for capital rather than a verdict on what Bitcoin fundamentally is. The maturation argument does not deny that Bitcoin trades like a risk asset right now. It argues that the current correlation is a snapshot of a particular ownership mix and liquidity regime, not the final word on an asset that is still only in its second decade.
Is this structural or cyclical?
The whole debate reduces to one question: is Bitcoin’s correlation with tech a permanent feature of the ETF era, or a temporary product of the current environment? The case for structural is that the ownership change is not reversing. ETFs are here to stay, institutions will keep managing Bitcoin alongside equities, and as long as they do, the flows that link the two assets will persist. If that is right, the digital gold thesis is effectively dead for as long as this ownership base dominates, and Bitcoin is a growth allocation that happens to be more volatile than most.
The case for cyclical rests on how correlations behave over time. Cross-asset correlations tend to spike during tight-liquidity, risk-off regimes and to loosen when liquidity returns and assets trade more on their own fundamentals. Bitcoin’s correlation with the Nasdaq has swung dramatically before, from deeply negative to strongly positive within weeks, which is not the signature of a fixed relationship. A shift in Federal Reserve policy, a change in the liquidity backdrop, or a rotation of capital away from the crowded AI trade could all loosen the tie and give Bitcoin room to trade on its own narrative again.
Some analysts even argue the correlation has already begun to break, though so far in the unhelpful direction of falling while tech rose. What would restore the digital gold thesis is a period where Bitcoin holds up while equities fall, proving the hedge in the only way that counts. That has not happened in 2026, which is why the thesis is on the ropes. But a single bad year in which a leverage-driven crypto drawdown collided with an AI-fueled equity rally is not a controlled experiment, and reading a permanent identity change off it may be as premature as the original digital gold claim was.
What it means for how to hold Bitcoin
For anyone actually holding Bitcoin, the practical takeaway is to match the thesis to the timeframe. Over the horizon that matters in 2026, Bitcoin has behaved as a high-beta risk asset, so treating it as a crisis hedge or a portfolio insulator has not worked and is not supported by the data. An allocation sized as if Bitcoin will hold up when stocks crash is mis-sized, because this year it fell harder than the stocks it was meant to hedge. The more defensible approach in the current regime is to treat Bitcoin as a volatile growth position, size it to risk tolerance, and watch the Nasdaq and AI-stock sentiment as closely as the crypto charts, because that is where much of the near-term direction is being set.
Over a longer horizon, the store-of-value case does not depend on short-term correlation. The fixed supply, the absence of governance and cash-flow risk, and the accumulation behavior of long-term holders are the pillars of that argument, and they survive a year of trading like a tech stock. The honest conclusion is that Bitcoin is currently being priced as a leveraged expression of risk appetite, not as digital gold, and that this reflects who owns it in the ETF era more than any change in what it is. Whether it grows into the independent, hedge-like asset its supporters imagine, or stays a high-beta satellite of the tech trade, will be settled by the next regime, not this one.
For now, the market has given its answer, and it is not gold. The strongest near-term read is not ideological; it is practical. In a world of a hawkish Fed and tight liquidity, Bitcoin behaves like a risk asset, and risk-off market sentiment matters as much as on-chain conviction. The digital gold thesis is not dead by definition, but in 2026 it has not been the trade.
Frequently asked questions
Is Bitcoin still considered digital gold?
Less and less in practice. Through 2026, Bitcoin behaved like a high-beta risk asset instead of a safe haven, falling alongside technology stocks while gold climbed to record highs. Its correlation with the Nasdaq reached as high as 0.80 while its link to gold fell toward zero. The digital gold label describes Bitcoin’s design and long-term thesis, but its 2026 trading behavior did not match it.
Why does Bitcoin move with tech stocks now?
The main driver is the spot ETF era that began in January 2024. Once institutions could hold Bitcoin inside the same portfolios as technology stocks, managed by the same risk desks, the same capital flows started moving both. When those desks adjust risk exposure, they buy or sell Bitcoin and tech together, which ties Bitcoin to equity market sentiment and Federal Reserve policy the same way growth stocks are.
How correlated is Bitcoin with the Nasdaq?
Correlation varies with the time window, but it has been high in 2026. Rolling 30-day correlations with the Nasdaq 100 reached about 0.80 early in the year, the highest in nearly four years, and the five-year correlation sits near 0.54. Short-term readings against U.S. tech indices have ranged roughly between 0.55 and 0.68. Correlations shift over time and have swung from negative to strongly positive within weeks.
Did the Bitcoin ETFs cause this?
They appear to be the central cause. Research from late 2025 found that spot ETF approval structurally raised Bitcoin’s correlation with the S&P 500, marking a shift from an independent asset to a conventional risk asset. The ETFs legitimized Bitcoin by integrating it into traditional finance, and that same integration tied its price to equity flows and institutional risk management.
What is the bearish skew analysts mention?
It refers to Bitcoin keeping the downside of its tech correlation while losing much of the upside. Trading firm Wintermute described Bitcoin as falling hard when equities fall but failing to rally proportionally when they recover, behaving as a high-beta tail of macro risk. That combination, full downside and partial upside, is a poor profile because it adds volatility without reliable gains or diversification.
Is Bitcoin just a leveraged tech stock then?
Not cleanly. If Bitcoin were purely a leveraged Nasdaq, it would have risen when tech rose, but for stretches in 2026 it fell while tech strengthened, driven by crypto-specific shocks: the October flash crash, ETF outflows, treasury-company stress, and miner selling. So Bitcoin took equity downside while also generating its own downside, which is a fragile hybrid instead of a simple tech proxy.
Could Bitcoin become a hedge again?
It is possible, and it hinges on whether the correlation is structural or cyclical. Cross-asset correlations tend to spike in tight-liquidity, risk-off regimes and loosen when liquidity returns. A shift in Federal Reserve policy or a rotation away from the crowded AI trade could let Bitcoin trade on its own narrative again. Restoring the hedge thesis would require Bitcoin to hold up while equities fall, which has not happened in 2026.
How should investors treat Bitcoin given this?
Match the thesis to the timeframe. In the current regime, Bitcoin trades as a volatile growth asset, so sizing it as a crisis hedge is not supported by the data, and investors may watch the Nasdaq and AI sentiment as closely as crypto charts. Over a longer horizon, the store-of-value case rests on fixed supply, no governance risk, and long-term holder accumulation, which do not depend on short-term correlation.
Disclaimer: This article is for information and educational purposes only and does not constitute financial, investment, or trading advice. Cryptocurrency prices are highly volatile, and correlations between assets change over time and may not persist. Nothing here is a recommendation to buy or sell any asset. Always do your own research and consider consulting a licensed financial professional before making investment decisions. Information is accurate as of July 2, 2026, and may change.

Toronto Stadium makes memorable impression in last of its six World Cup matches

Raoul Pal – It’s Boring, But It Will Make Crypto Investors Rich
Man, 25, who began ‘seeing double’ and told he has a year to live says ‘I won’t let this beat me’


-

 Fashion6 days ago
Weekend Open Thread: Staud – Corporette.com
-

 Politics7 days ago
The House | Manchesterism won’t survive the painful trade-offs unless it gets citizens on board
-

 Crypto World3 days ago
Strategy authorizes up to $1.25B in Bitcoin sales under new capital plan
-

 Business7 days ago
Asia stock markets slide as tech shares slump
-

 News Videos4 days ago
MAJOR BITCOIN & MARKET UPDATE!!!! (MUST WATCH ASAP!!!)
-

 Tech3 days ago
Anonymous researcher drops 0-day ‘exploitarium’ repo
-

 Crypto World5 days ago
Coinbase, Circle Deepen Crypto Stock Losses Despite Resilient S&P 500
-

 Business3 days ago
Australia treasurer says alleged access of prime minister’s bank data ’incredibly concerning’
-

 Crypto World6 days ago
Kraken's xStocks Opens Bending Spoons IPO Registration to EEA Retail
-

 Sports6 days ago
FIH Pro League: India defeat Pakistan 7-1, register biggest win of campaign | Other Sports News
-

 Tech5 days ago
Bluekit phishing kit adopts browser-in-the-middle for login theft
-
 Crypto World7 days ago
Tether (USDT) Passes Ether in Market Cap as ETH Drops Toward $1.5K
-
 Crypto World7 days ago
Hyperliquid Named on Singapore MAS Investor Alert Register
-

 Tech6 days ago
Russian hackers now target Signal backup recovery keys
-

 Crypto World6 days ago
RTX holders must register wallets before token distribution begins
-

 Sports2 days ago
Broncos roster: OL Ben Powers (No. 74) entering final year of contract
-
 Business3 days ago
The AI boom won’t burst all at once. It will pop in ‘rolling bubbles’: Macquarie
-

 Tech5 days ago
Claude Code turned every engineer into three. Now companies need more product thinkers
-
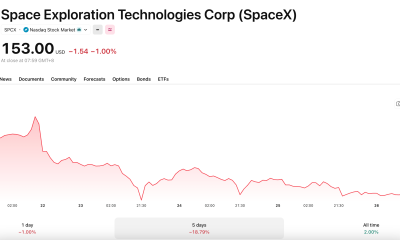
 Crypto World7 days ago
SpaceX Called a Market Top Signal Just 2 Weeks After Its $86 Billion IPO
-

 Tech5 days ago
Silicon Valley paid to kill AI regulation, now it wants the rules back
You must be logged in to post a comment Login