

Crypto World
XRP selling pressure fades, but $1.50 still blocks bulls
XRP is trading near $1.37 as exchange-flow data shows cooling deposit pressure, while ETF inflows remain positive and traders wait for a breakout.
Summary
- XRP trades near $1.37 as Bybit deposit pressure cools after a month-long exchange-flow wave today.
- Binance and Coinbase now show withdrawal-led transactions, suggesting exchange selling pressure may be easing slightly.
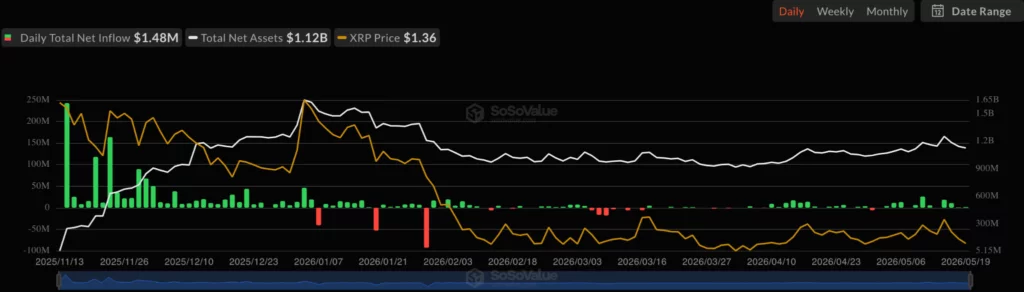
- Spot XRP ETFs posted positive daily inflows, but total assets fell from recent levels again.
Ripple’s native token traded near $1.37 on May 20, down about 1.37% over 24 hours, according to crypto.news price data. The token moved between $1.35 and $1.39 during the same period, with 24-hour trading volume above $1.8 billion. XRP held the fifth spot by market cap, valued near $84.6 billion.
Longer-term performance remains weak. XRP was down about 5.88% over seven days and stayed below recent resistance after several failed moves higher. The price action keeps traders focused on the same narrow zone: support near $1.29 to $1.35 and resistance near $1.50.
That range matters because XRP has not yet shown a confirmed trend change. Buyers continue to defend the lower area, but sellers have limited each move toward the upper band. A clean break may now decide whether XRP extends toward $1.80 or returns toward the $1.00 zone.
Recent coverage also showed XRP spot ETFs had drawn strong flows in April, with $17.11 million in net inflows on April 15 and four straight days of positive flows. Combined XRP ETF assets had moved above $1.25 billion at that time, while XRP traded near $1.42.
Bybit deposits cool after month-long wave
According to CryptoQuant analyst Amr Taha, XRP exchange-flow behavior has changed after weeks of strong deposit activity on Bybit. The XRP Multi-Exchange Daily Depositing/Withdrawing Transactions Delta showed Bybit’s transaction delta moving close to zero around May 16.
That marked a clear change from the strong positive readings seen between mid-April and mid-May. In exchange-flow terms, deposit-heavy activity can point to potential selling pressure because tokens moved to exchanges can be sold or traded more easily.
The latest data suggests that Bybit’s earlier deposit imbalance has faded on a transaction-count basis. It does not show the exact XRP volume moving in or out. Still, the change in direction shows that the previous deposit wave has slowed.
Binance and Coinbase have also moved back into negative territory, according to the same CryptoQuant update. That means withdrawal transactions are now higher than deposit transactions on those exchanges. This creates a different setup from the earlier phase, when Bybit-led deposits shaped the market signal.
ETF inflows stay positive despite lower assets
SoSoValue data shows that XRP spot ETFs recorded another positive daily inflow on May 19. Daily total net inflow stood at $1.48 million, while cumulative net inflow remained near $1.39 billion.

Moreover, XRP spot ETFs recorded $750,440 in inflows on May 18, $10.87 million on May 15, and $18.52 million on May 14. That means daily ETF flows stayed positive across the listed sessions, even as total net assets fell from $1.25 billion on May 14 to $1.12 billion on May 19.
Notably, fresh money continued to enter XRP spot funds, but the total asset base still declined. That can happen when the token price weakens or when market value drops faster than new inflows can offset it.
For XRP traders, the ETF data matters because it shows that institutional demand has not fully disappeared. However, positive ETF inflows alone have not pushed the token above resistance. Price still needs stronger spot demand or a technical breakout to shift the short-term structure.
Traders watch $1.50 and $1.29
Analyst Ali Martinez said XRP is showing the tightest Bollinger Band squeeze on its 3-day chart in more than a year. He described the current range between $1.50 and $1.29 as a “no-trade zone.”
“I’m waiting for a clean 3-day candlestick close outside of this range ($1.50-$1.29) to confirm the next major trend direction,” said Martinez.
He added that a close above $1.50 could target $1.80, while a close below $1.29 could open a move toward $1.00.
EGRAG CRYPTO also warned traders to watch candle behavior inside a key macro zone. He asked whether the current candles show accumulation or hidden distribution, placing focus on structure rather than price alone.
Arab Chain’s CryptoQuant update adds caution. The analyst said XRP institutional accumulation on Binance declined in May, with the indicator moving to about -0.0059 as price fell near $1.38. The reading remains close to neutral, meaning the data does not show heavy distribution.
For now, XRP remains in a tight setup. Exchange deposit pressure has cooled, ETF inflows remain positive, and volatility has compressed. A close above $1.50 would strengthen the bullish case, while a close below $1.29 would weaken the current range.
Disclosure: This article does not represent investment advice. The content and materials featured on this page are for educational purposes only.


Key Takeaways
- Shares of Intel began Monday’s session at $120.35, helping drive a semiconductor sector recovery following two weeks of declines in the SOX benchmark.
- Information technology earnings projections have jumped 10% throughout Q2; Intel and Sandisk show the strongest estimate growth.
- Wall Street now forecasts Intel’s Q2 earnings per share at $0.21, a significant increase from the $0.08 projection on March 31.
- Several institutional players expanded their INTC holdings during Q2, with institutions and hedge funds controlling 64.53% of shares outstanding.
- HSBC maintains a Buy rating with a $200 price target, while Goldman Sachs assigned a neutral stance with a $150 objective.
Intel shares opened Monday’s trading at $120.35 as semiconductor stocks recovered from back-to-back weekly declines that pressured the PHLX Semiconductor Index (SOX).
Sandisk (SNDK) and Western Digital (WDC) also experienced approximately 4% gains after suffering significant losses during Thursday’s selloff.
The semiconductor recovery materialized as market participants shifted focus toward the approaching earnings reporting period, where technology sector expectations have been strengthening.
FactSet data reveals that information technology sector earnings forecasts have advanced 10% since the second quarter’s April 1 start date. This positions IT just behind the energy sector, which has witnessed a dramatic 50% surge in estimates during the identical timeframe.
Intel and Sandisk are spearheading the technology sector’s earnings-per-share estimate improvements on a percentage basis since the end of March. Sandisk also appears near the top when measured in absolute dollar terms, alongside Micron (MU), Nvidia (NVDA), and Apple.
Regarding Intel’s specific outlook, Wall Street analysts currently project Q2 EPS of $0.21, representing a substantial increase from the $0.08 forecast that existed at the quarter’s beginning. Intel’s management has issued Q2 guidance calling for $0.20 EPS.
Institutional Ownership Continues Growing
Numerous institutional investment firms expanded their Intel holdings during the second quarter. Walkner Condon Financial Advisors established a fresh position valued at approximately $224,000 through the purchase of 5,068 shares. Sivia Capital Partners expanded its Intel stake by 271.7%, bringing its total to 34,201 shares valued at $766,000. NewEdge Advisors increased its position by 29.6%, now holding 158,277 shares.
In total, hedge funds and institutional investors maintain ownership of 64.53% of Intel stock.
On the insider transaction front, Executive Vice President April Miller divested 40,256 shares on May 1 at an average price of $99.53 per share, generating proceeds exceeding $4 million. This transaction decreased her ownership percentage by 27.7%.
Street Price Targets Show Wide Dispersion
Analyst price objectives for Intel demonstrate considerable variance across Wall Street. HSBC elevated its target to $200 while maintaining a Buy recommendation, citing advancement in Intel’s foundry operations and possible collaborations with Apple, Nvidia, and Amazon.
Goldman Sachs launched coverage on June 25 with a neutral assessment and a $150 price objective. Mizuho established a $135 target on June 21. TD Cowen maintains a Hold rating with a $75 price goal. Rosenblatt carries a Sell rating alongside a $50 target.
The aggregate consensus among 49 Wall Street analysts establishes a “Hold” rating with an average price target of $96.69.
Intel’s latest quarterly results, disclosed on April 23, revealed Q1 EPS of $0.29, surpassing the $0.01 consensus estimate by $0.28. Revenue totaled $13.58 billion, exceeding the $12.32 billion projection and representing a 7.4% year-over-year increase.
The stock’s 52-week trading range spans from $18.97 to $142.35. Its 200-day moving average stands at $71.20, considerably below current trading levels. Intel maintains a market capitalization of $604.88 billion with a beta coefficient of 2.18.


Strategy (MSTR) sold 3,588 bitcoin for approximately $216 million last week, reducing its total holdings to 843,775 BTC, according to a Monday SEC filing.
The company said proceeds from the bitcoin sales will be used to fund distributions on its preferred stock and replenish the portion of its U.S. dollar reserve used for those payments. As of July 5, the USD reserve totaled $2.55 billion.
The latest sales were executed at an average price of roughly $60,000 per bitcoin and are dramatically higher than the 32 bitcoin sold by the company about one month ago, which sent crypto prices plunging. Strategy currently holds 843,775 BTC acquired for approximately $63.69 billion, or an average purchase price of $75,476 per bitcoin.
Strategy also said it did not sell any shares under its at-the-market equity program during the week ended July, and did not repurchase any shares under its buyback programs. The company added that the full $1.25 billion capacity under its recently announced BTC Monetization Program remains available.
Strategy shares are down 2% in pre-market trading and bitcoin has given up much of its weekend gain, trading down to $61,900 from $62,900 prior to the announcement.

TLDR
- Solana added 1.60 million new addresses in two weeks, showing stronger network participation.
- SOL held its short-term uptrend as buyers defended key support levels.
- Analysts identified $85.81, $88.79, and $93.95 as the next upside targets.
- The $86 to $94 zone remains the main resistance area for Solana’s breakout setup.
Solana price prediction remains positive after on-chain activity strengthened and technical support stayed intact. Network data showed 1.60 million new addresses joined within two weeks. Meanwhile, SOL continued holding higher lows while resistance near $94 remained the next focus.
Network activity strengthens Solana’s market outlook
Solana price prediction gained attention after fresh on-chain data highlighted steady network expansion. Ali Charts reported 1.60 million new addresses during the past two weeks. The figures reflected stronger participation across the broader Solana ecosystem.
The total address count increased from about 6.8 million to 8.6 million during the measured period. That increase suggested rising activity beyond short-term market movements. Consequently, stronger network participation supported improving market conditions.
Solana price prediction also received support because expanding addresses often reflect growing ecosystem usage. However, address growth alone cannot confirm a sustained price breakout. Even so, consistent participation strengthened the broader bullish structure.
Price structure keeps the bullish trend intact
Solana price prediction remained constructive because SOL preserved its short-term upward trend. More Crypto Online said, “there is still no clear sign that a local top has formed.” The Elliott Wave structure continued pointing toward higher resistance levels.
The analyst identified immediate support near $80.38 for the ongoing structure. Additional support rested near $78.22 and $76.52. Therefore, holding those levels would preserve the current higher-low pattern.
Solana price prediction continued favoring upside targets while buyers defended key support levels. The chart highlighted resistance near $85.81, $88.79, and $93.95. Those levels represented the next technical objectives if momentum continued.
Resistance near $94 remains the next target
Solana price prediction focused on the $86-$94 resistance area as buying pressure persisted. Market structure remained positive because price respected higher lows. Consequently, traders monitored resistance without disrupting the prevailing trend.
A deeper decline could return the $71.17-$64.68 region into focus. That move would weaken the current short-term technical picture. However, it would still fit a broader corrective structure.
Solana price prediction continued to rely on network growth and stable price action together. Strong address creation supported the technical outlook during recent sessions. Therefore, sustained participation and higher lows kept the $94 breakout scenario active.
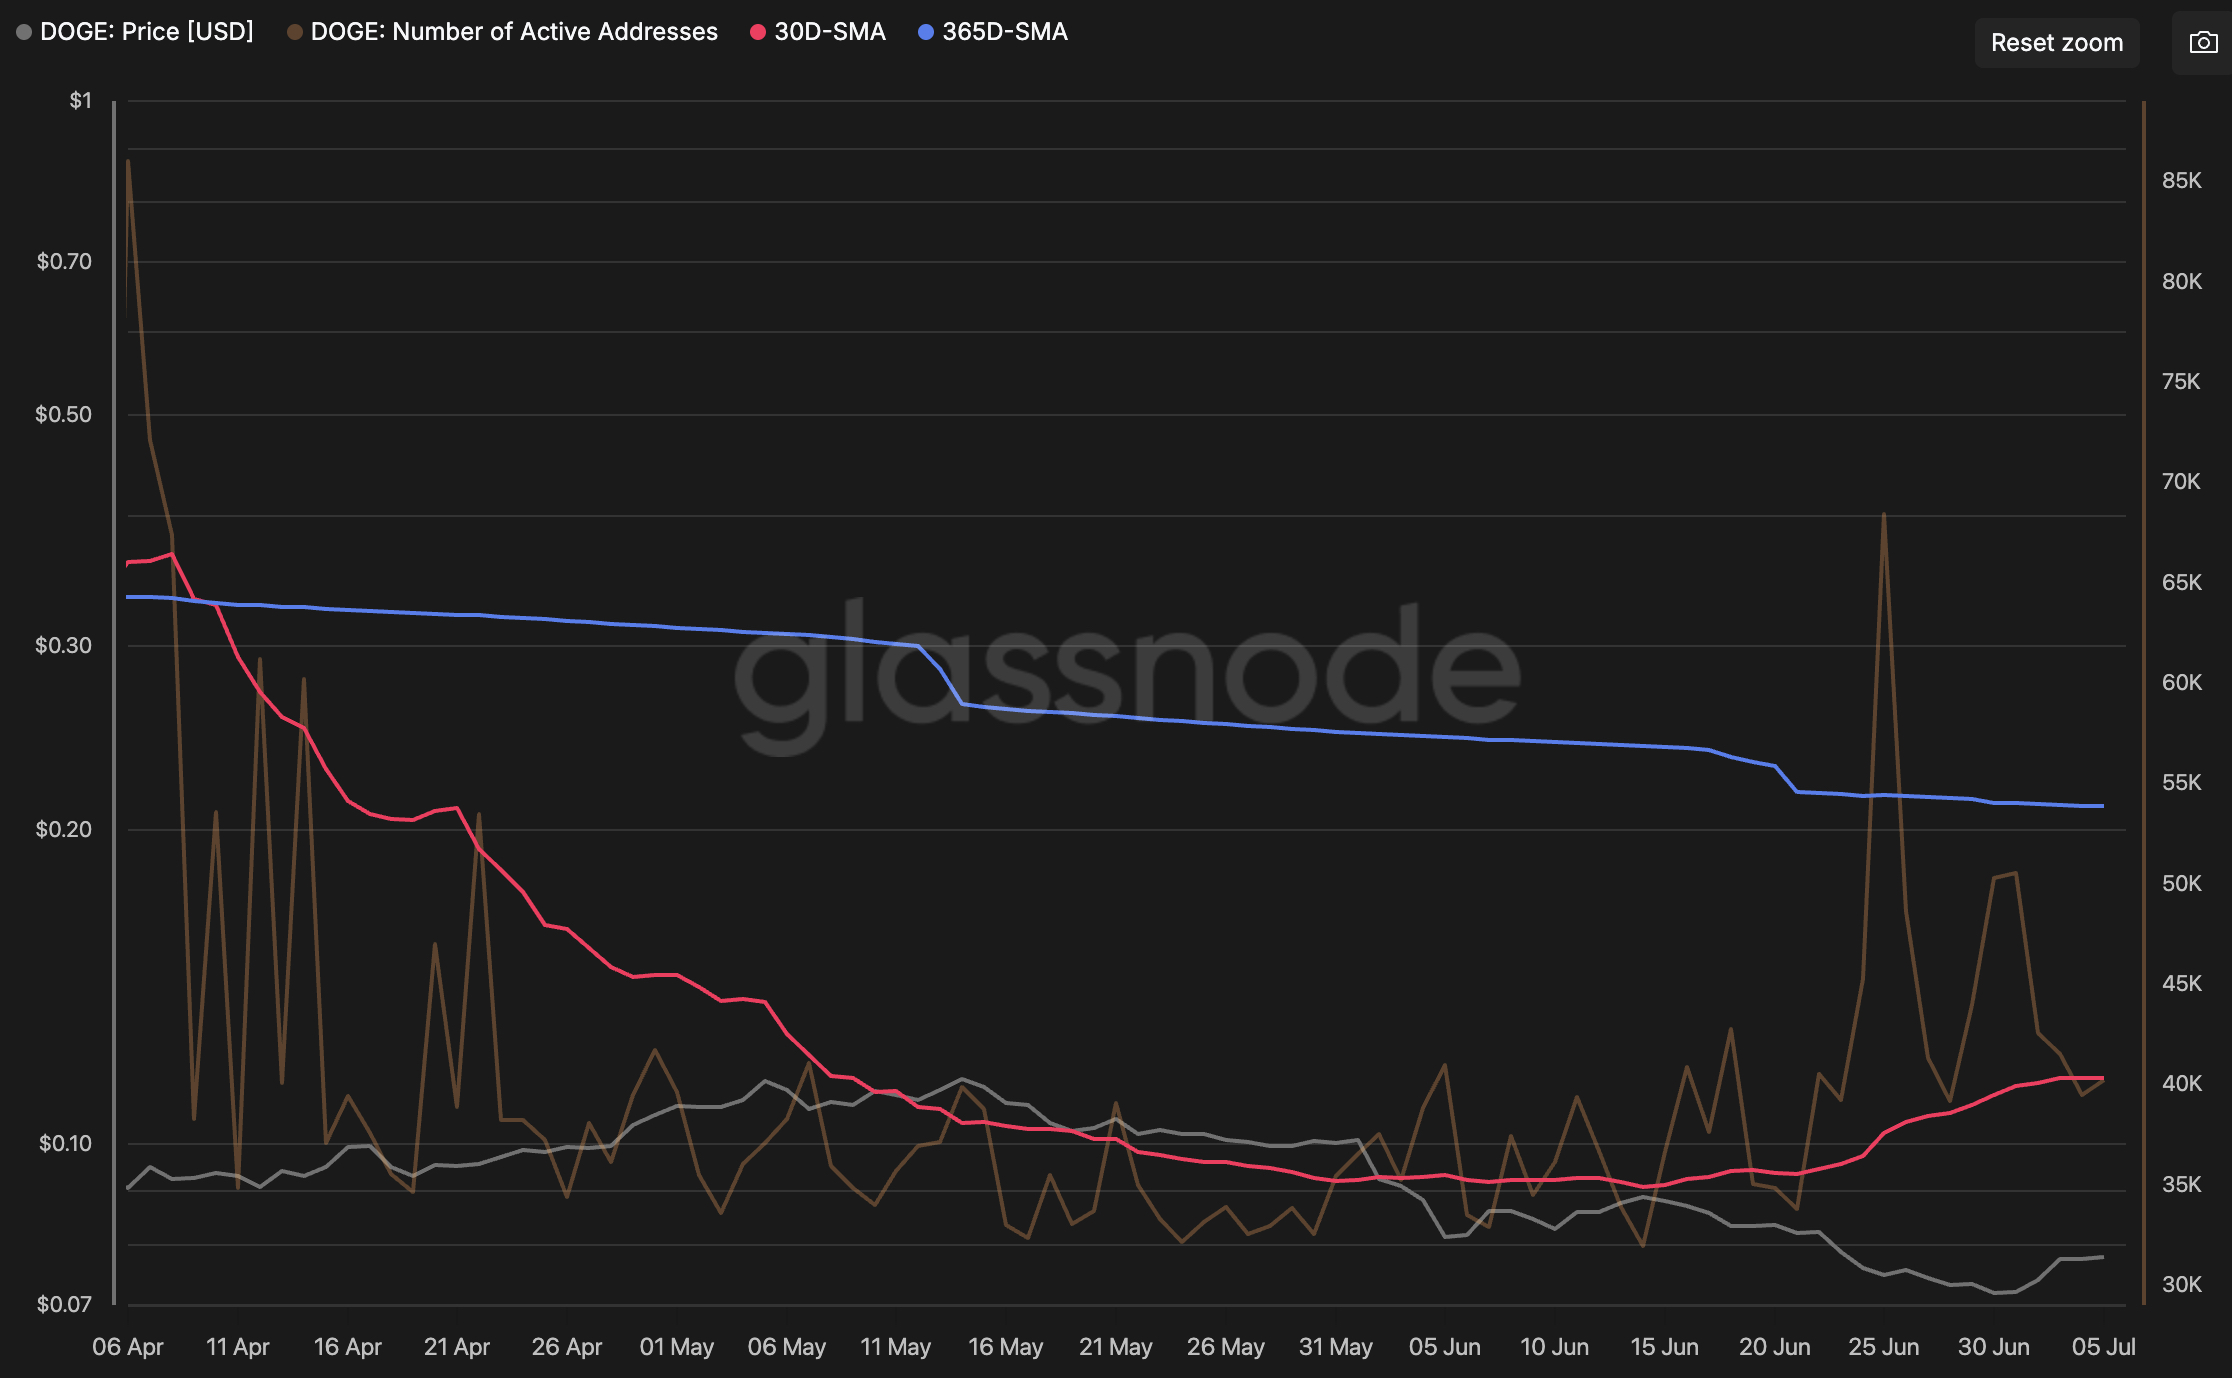
Dogecoin network is suddenly buzzing again. Active addresses have surged to nearly 50,000 since early July, fueling speculation that a bigger move could be around the corner despite muted price action.
Ali Martinez pointed to the jump on X, citing Glassnode data that showed active addresses reaching a multi-month high. His verdict was simple: “Something is brewing.” A day earlier, he also spotted a TD Sequential buy signal, suggesting momentum could be shifting.

Meanwhile, technical indicators are starting to lean bullish. TradingView’s summary shows the MACD flashing a Buy signal, adding weight to the growing optimism. Still, charts only tell half the story. Buyers now need to show up with real volume, or this setup could fizzle out as quickly as it appeared.
Dogecoin is also following Bitcoin’s lead, just as it often does. If Bitcoin keeps pushing higher, DOGE could finally break out of its recent range. However, if Bitcoin loses steam, Dogecoin may stay stuck despite the spike in network activity. Sometimes the chain speaks first, while the price takes its sweet time catching up.
Discover: The Best Token Presales
Can Dogecoin Price Reach $0.12 Before the Breakout Stalls?
DOGE is trading near $0.076, keeping the $0.075-$0.077 area in focus after several sessions of choppy action. Buyers are still defending this zone, but they have not shown much urgency. It feels more like a waiting game than a tug-of-war.
Volume remains light compared with previous rallies, which explains why upside momentum has struggled. Futures open interest is also relatively muted, showing traders are not rushing into leveraged bets. Sometimes the quietest charts make the loudest moves, but that part still needs proof.

The first hurdle sits around $0.081, followed by stronger resistance near $0.09. If DOGE clears those levels with stronger volume, the next area to watch comes in around $0.10. Until then, long-term holders appear patient while short-term traders continue swapping seats.
If support around $0.075 holds, buyers could slowly regain control and push toward $0.081-$0.09. Otherwise, DOGE may stay stuck in its current range for a while longer. A decisive break below $0.075 could open the door to the $0.070-$0.072 area, giving bulls another headache they did not order.
Discover: The Best Crypto to Diversify Your Portfolio
Maxi Doge Eyes Early Mover Upside as DOGE Tests Key Levels
DOGE’s setup is compelling, but at an entry above $0.07, even a run to $0.135 is less than 2X on an asset with a multi-billion dollar market cap and significant overhead supply to absorb. Early-stage exposure to the meme coin narrative carries a structurally different risk-reward profile. That gap is where presales draw attention.
Maxi Doge ($MAXI) is a meme token built on Ethereum that leans hard into gym-culture trading energy, the 240-lb canine juggernaut framing is exactly as absurd as it sounds, and that is precisely the point for viral meme mechanics.
The project has raised somewhere close to $5 million at a current presale price of $0.0002827, with dynamic staking APY active for holders. Standout features include holder-only trading competitions with leaderboard rewards and a Maxi Fund treasury earmarked for liquidity and partnerships.
Research Maxi Doge before the presale ends.
Don’t Miss Out on Our $1,000 USDT Airdrop on ByBit
The post Dogecoin Price Prediction: Analyst Flags DOGE Exploding Network Activity appeared first on Cryptonews.

Bitcoin (BTC) starts the second week of June near two-week highs with traders keen to see bullish continuation.
Key points:
- BTC price action targets nearby liquidity as a trader names the “most important” support zone to hold next.
- US stock-market performance gives analysis reason to believe that the good times will continue amid “record” retail risk appetite.
- A stock-market correction is not out of the question, new warnings conclude, but Bitcoin should have already priced in the fallout.
- Exchange inflow data reveals cooling panic among both retail and whale investors.
- Crypto market sentiment is at monthly highs, on the cusp of exiting “extreme fear.”
Bitcoin key support emerges as bulls eye $64,000
Bitcoin kept up pressure on short positions into the weekly close, hitting $63,960 — its highest levels since June 23, per data from TradingView.
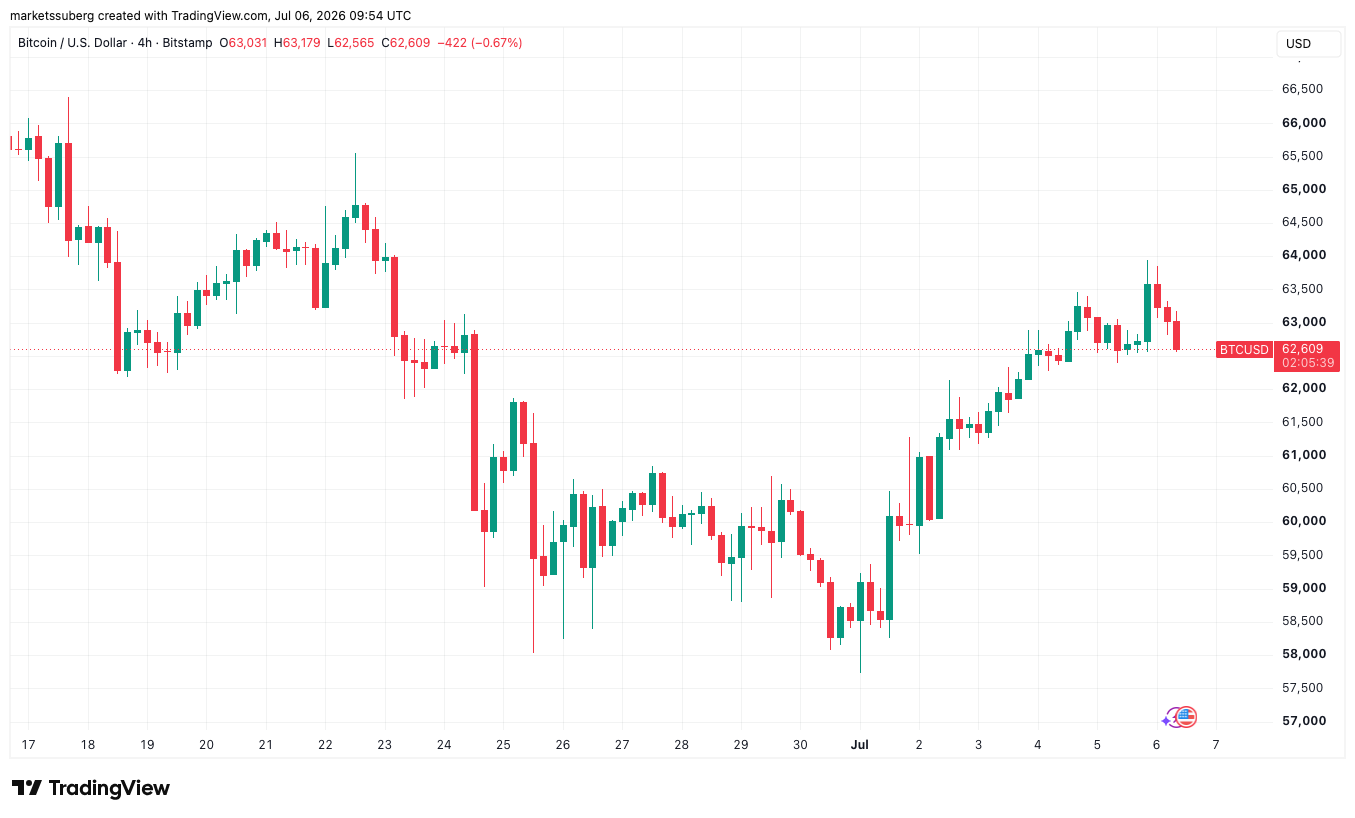
BTC/USD four-hour chart. Source: Cointelegraph/TradingView
Total crypto short liquidations for the 24 hours to the time of writing were just over $100 million, CoinGlass reports.
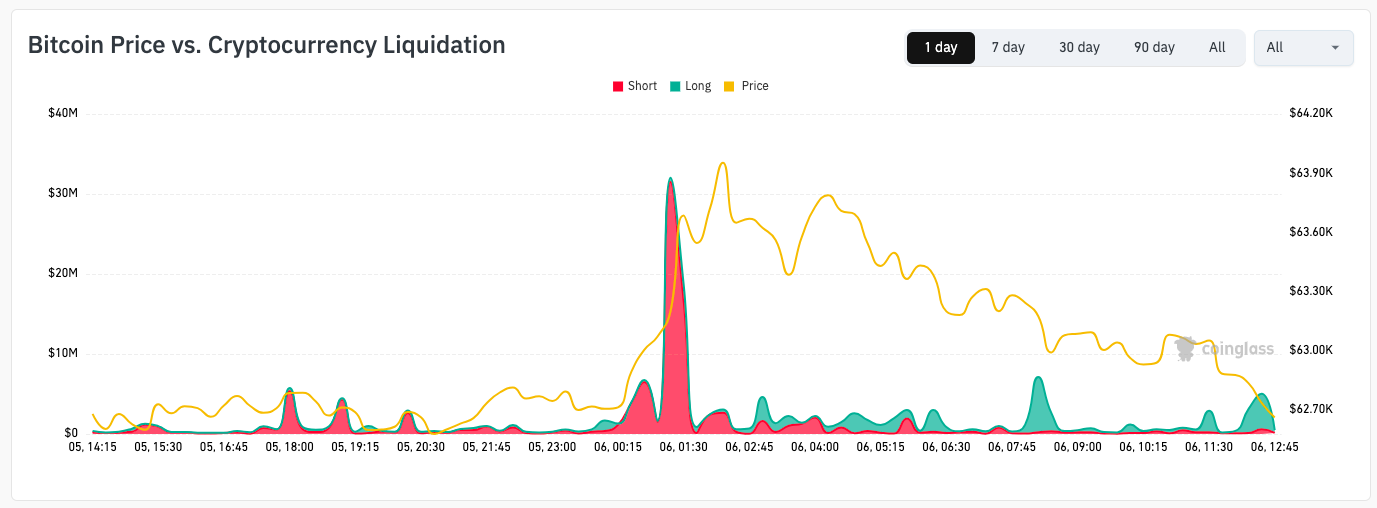
BTC/USD vs. crypto liquidation history (screenshot). Source: CoinGlass
Commenting on low time frames, X account Exitpump was among those attributing the moves to liquidity hunts.
“Seeing aggressive selling from spot markets, spot CVD (yellow) trending down while perps CVD (blue) is flat,” they reported on Monday, referring to cumulative volume delta on exchange order books.
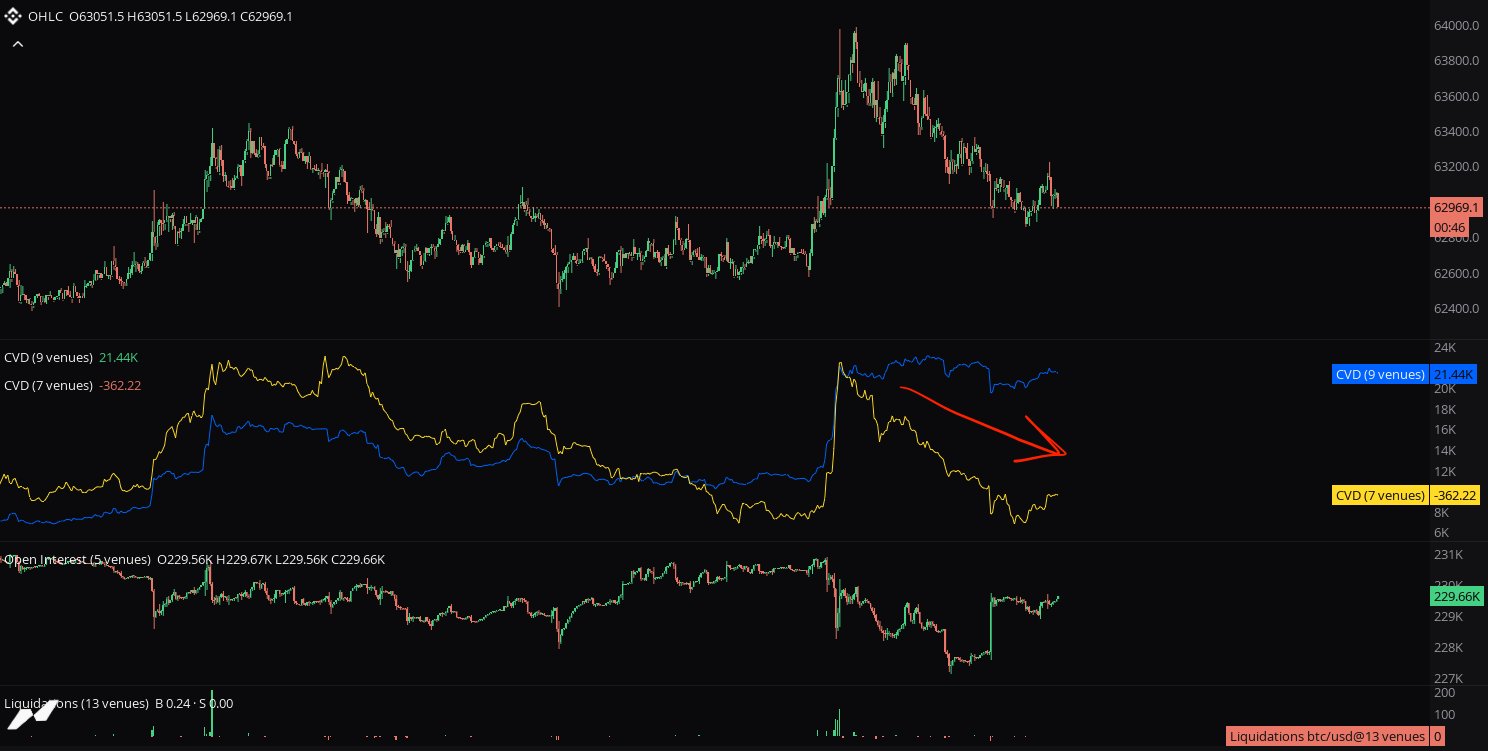
BTC/USD chart with order-book data. Source: Exitpump/X
In the event of a reversal downward, trader Killa called the zone between $60,400 and $60,900 Bitcoin’s “most important.”
“If we cannot hold this price region on a revisit, I’m afraid we are going to trend directly to the lows again. Something to watch out for next week,” the analyst told X followers.
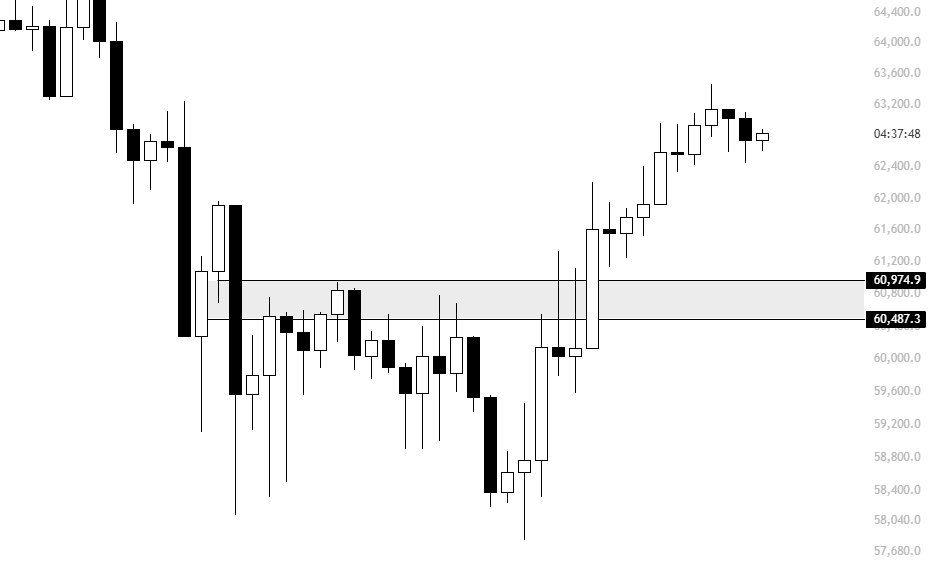
BTC/USD chart. Source: Killa/X
As Cointelegraph continues to report, market participants still see Bitcoin’s bear-market low as yet to come — despite a growing number of bullish trend reversal signals.
Trader Roman, who was long bearish on BTC/USD, stayed optimistic on longer time frames this week.
“Still looking excellent to continue our reversal to see higher prices in the interim,” an X post read.
“I still have a feeling we put in one more macro low before the bottom is officially in, but there are dozens of macro reversal signs all over HTF.”
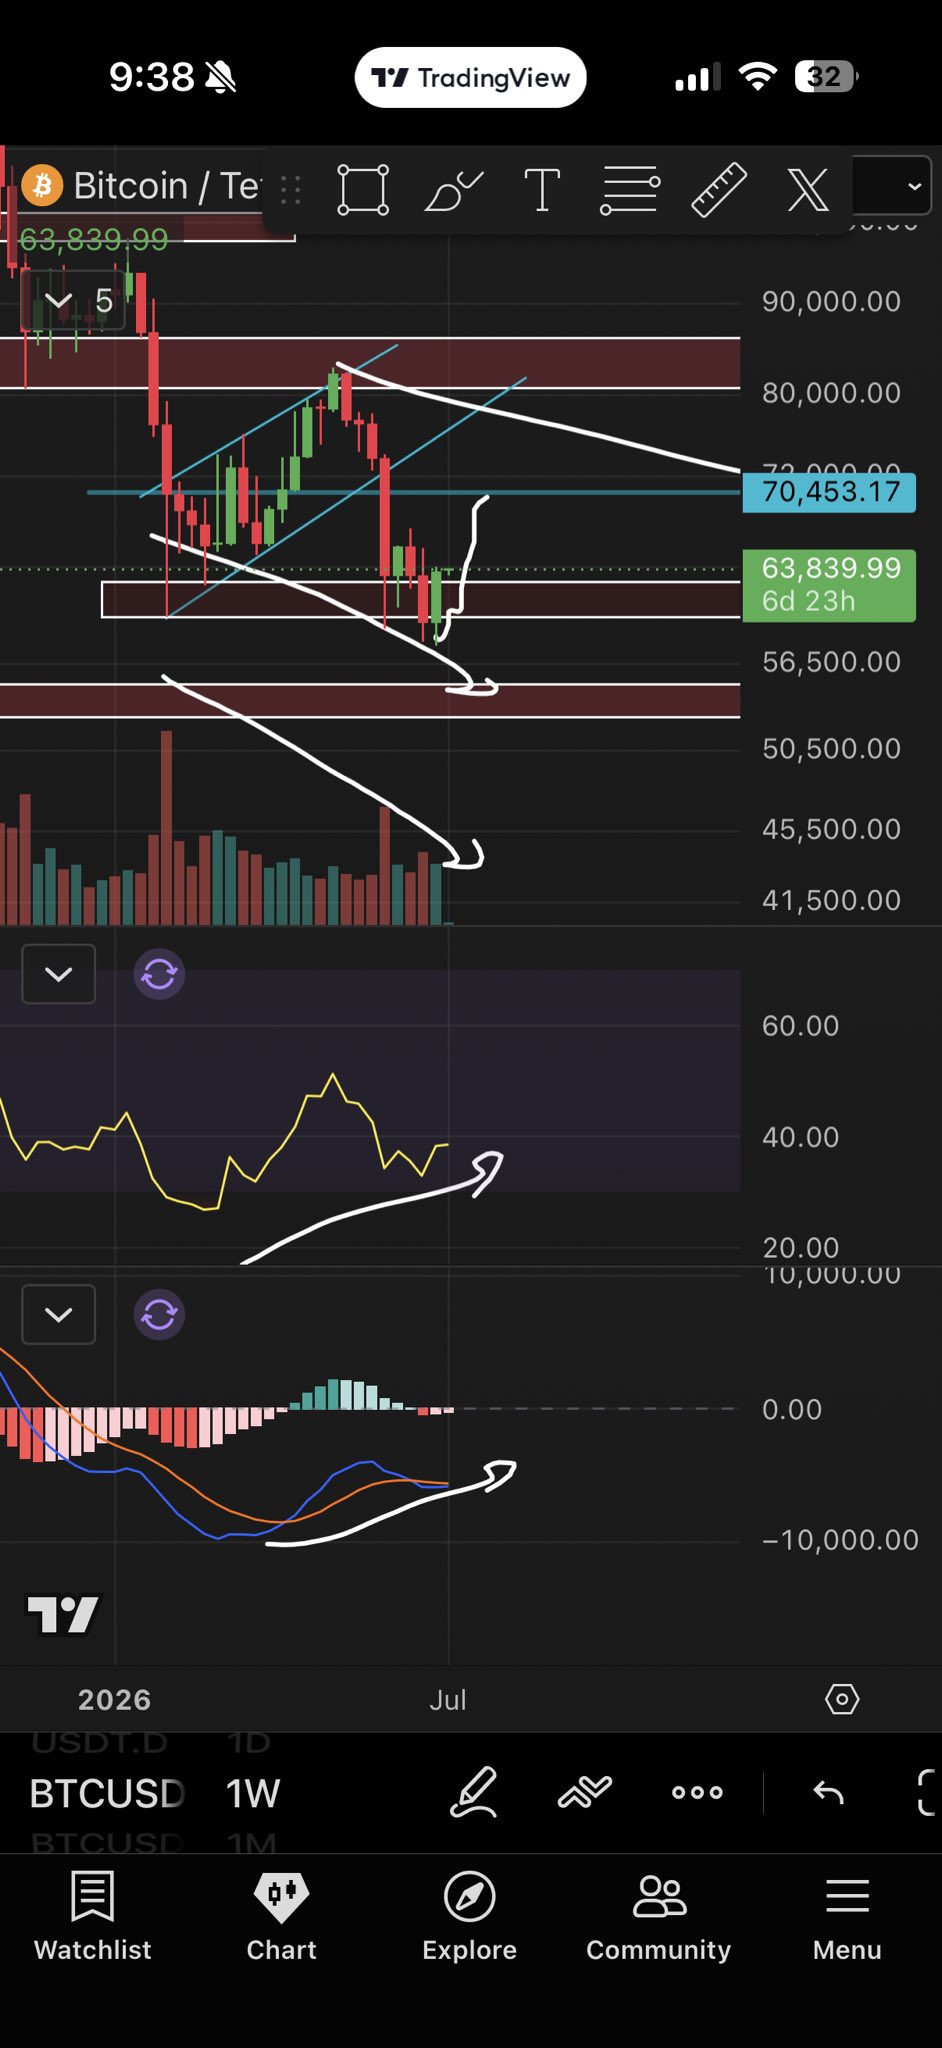
BTC/USDT one-week chart. Source: Roman/X
Retail risk appetite hits record levels
Bitcoin’s waning ability to copy equities is under the microscope this week as US stock futures start higher after the holiday weekend.
While BTC/USD managed a trip to near two-week highs, Nasdaq 100 futures added 1% as analysts remain bullish on the broader US outlook.
“Although the S&P 500 is coming off a hot second quarter with a 15% gain, the index topped in early June and has yet to make a new high,” trading resource Mosaic Asset Company wrote in the latest edition of its regular newsletter, The Market Mosaic.
“But the S&P 500 trading within a bullish continuation pattern and has been finding support at a key level.”
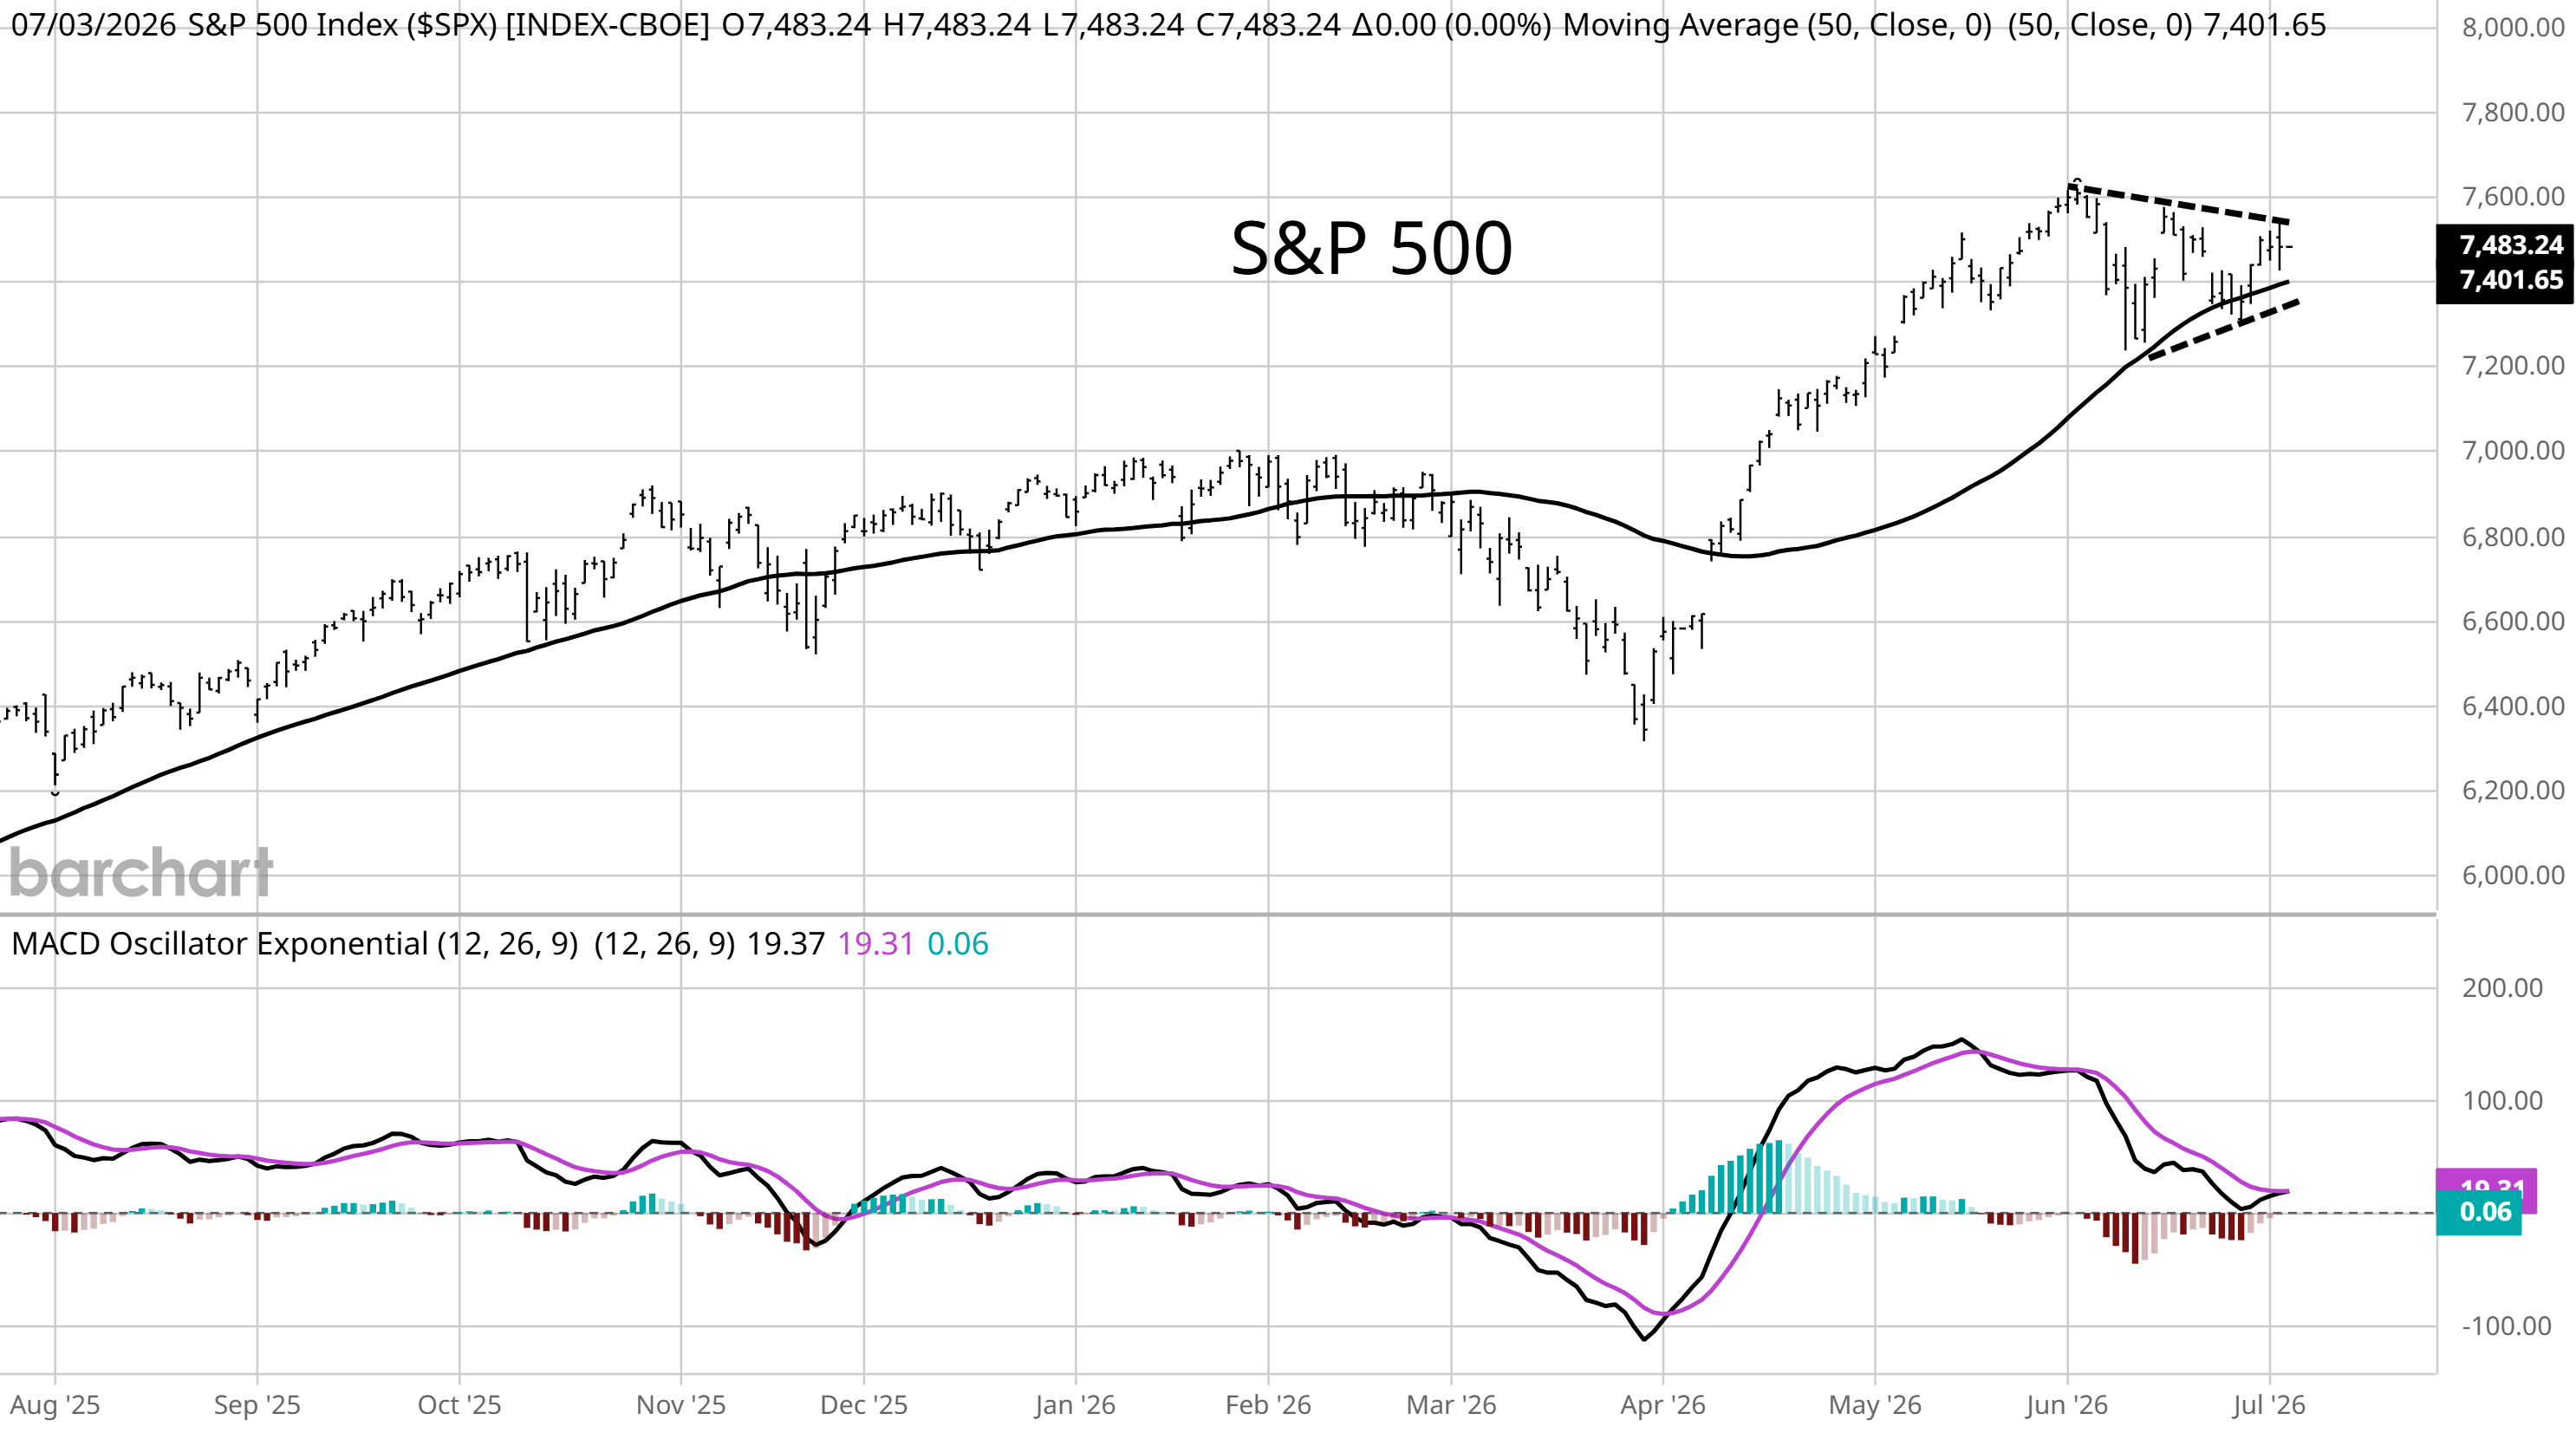
S&P 500 market data. Source: Mosaic Asset Company
Mosaic added that the average stock “has been rallying to new record highs.”
“That includes the equal-weight S&P 500, small-cap stocks with the Russell 2000 Index, and the NYSE advance/decline line. New highs minus new lows across major exchanges are jumping higher as well,” it noted.
As Cointelegraph reported, recent US inflation and labor-market data helped soften markets’ hawkish expectations for Federal Reserve policy last week.
The latest data from CME Group’s FedWatch Tool sees the Fed holding interest rates at current levels in both July and September.
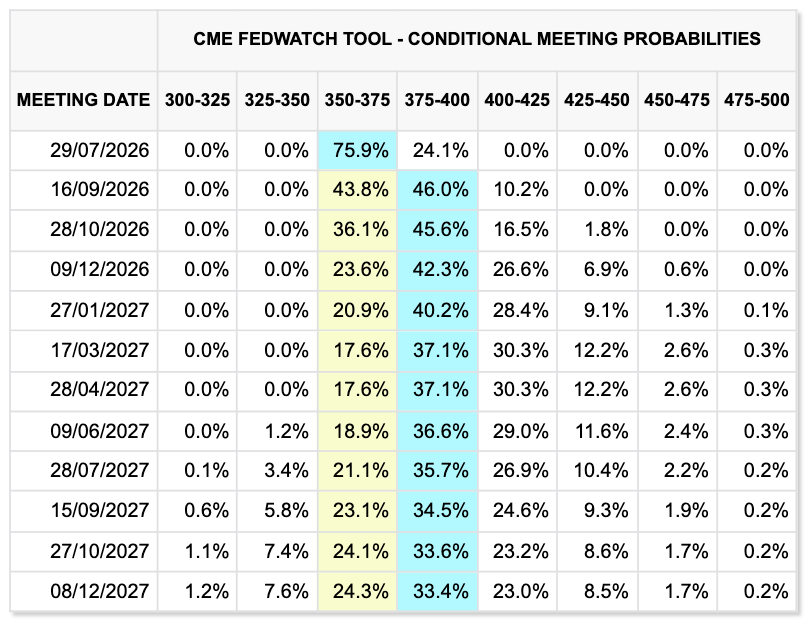
Fed target rate probabilities (screenshot). Source: CME Group
Another potential macro tailwind for Bitcoin comes in the form of retail investor demand for risk — despite the cohort’s crypto exodus this year. Analyzing options data, trading resource The Kobeissi Letter described retail risk appetite as being “at record levels.”
“Retail demand for short-term options has never been higher,” it reported on X.
This week, the Fed will release the minutes of its June meeting, where it likewise kept rates steady. Markets will also react to Purchasing Managers Index (PMI) numbers, along with more employment data releases.
“We expect another volatile week ahead as markets brace for earnings season,” Kobeissi added.
Warning over pre-midterm stock market correction
Looking ahead, not all market participants are convinced that the persistent stocks bull market will last. Among them is Andre Dragosch, European head of research at crypto asset manager Bitwise.
“What if there is a bigger stock market correction right before the Midterms?” he queried in X posts on Monday, referring to upcoming US elections.
Dragosch flagged the latest data from the MacroQuant Equity Risk Model by macro analytics company BCA Research. This, he warned, was “flashing a bear market warning signal.”
An accompanying chart likened current readings to those last seen in late 2021, when Bitcoin saw the top of its previous bull market.
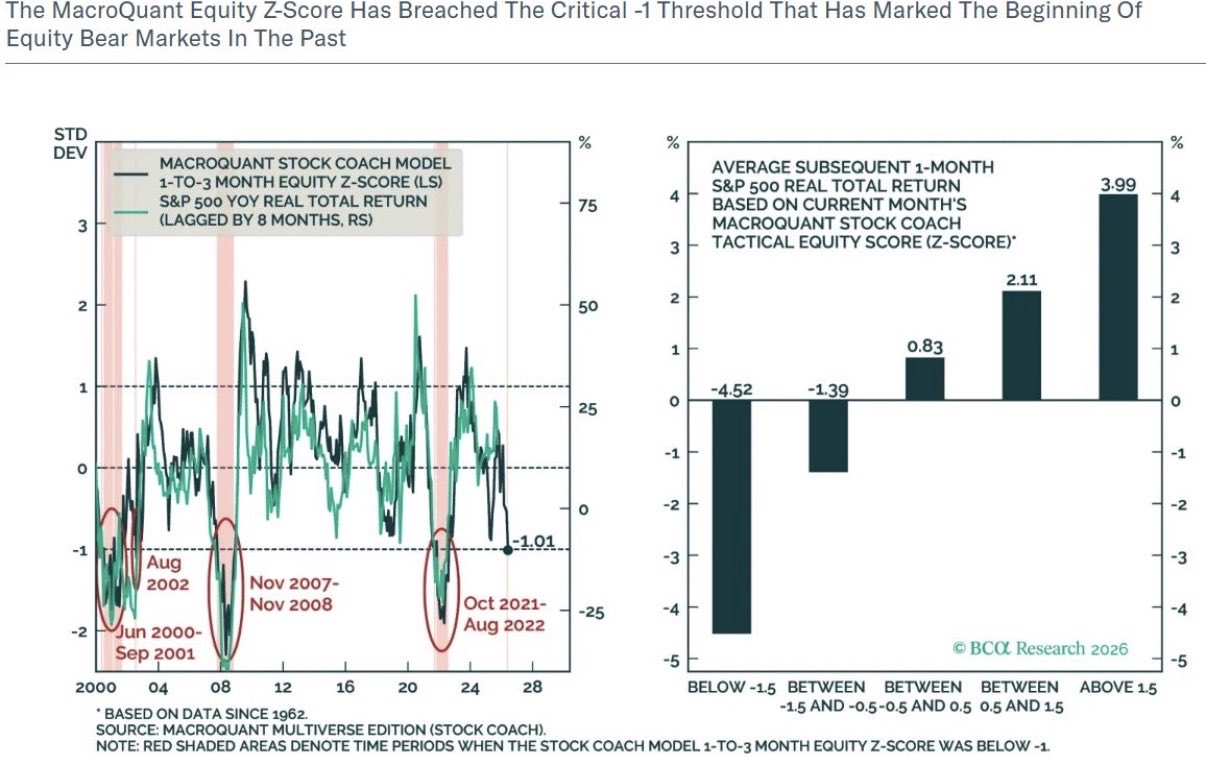
Source: Andre Dragosch/X
In an extended X post last week, Dragosch nonetheless reasoned that crypto markets had already priced in much of the worst-case scenario that could hit macro in the future: a stock market comedown and a US recession.
“In other words, even if a AI crash and a subsequent US recession materialized, much of that pain appears to be already reflected in Bitcoin prices, which points to reduced downside from here,” he summarized.
Dragosch gave Bitcoin a “decent chance” of outperforming the Nasdaq “on a relative basis over the coming months.”
Whales lead exchange inflow drop
New data reveals that Bitcoin investors cooled selling significantly in the second half of June — even as price set new multi-year lows.
In a QuickTake blog post, onchain analytics platform CryptoQuant confirmed that inflows to exchanges had decreased from both retail and whale investors alike.
“Bitcoin whale activity on Binance has cooled sharply since mid-June, with the rolling 30-day value of whale inflows falling by nearly $2.4 billion,” contributor Amr Taha confirmed.
Retail investor inflows displayed a shallower rate of decline, falling from $10.02 billion on June 12 to $8.2 billion on July 6.
“Whale inflows fell at nearly twice the rate of retail inflows, reducing the relative role of large holders in exchange-bound Bitcoin supply. Meanwhile, the gap between retail and whale inflows widened from about $2.98 billion to $3.55 billion,” Taha continued.
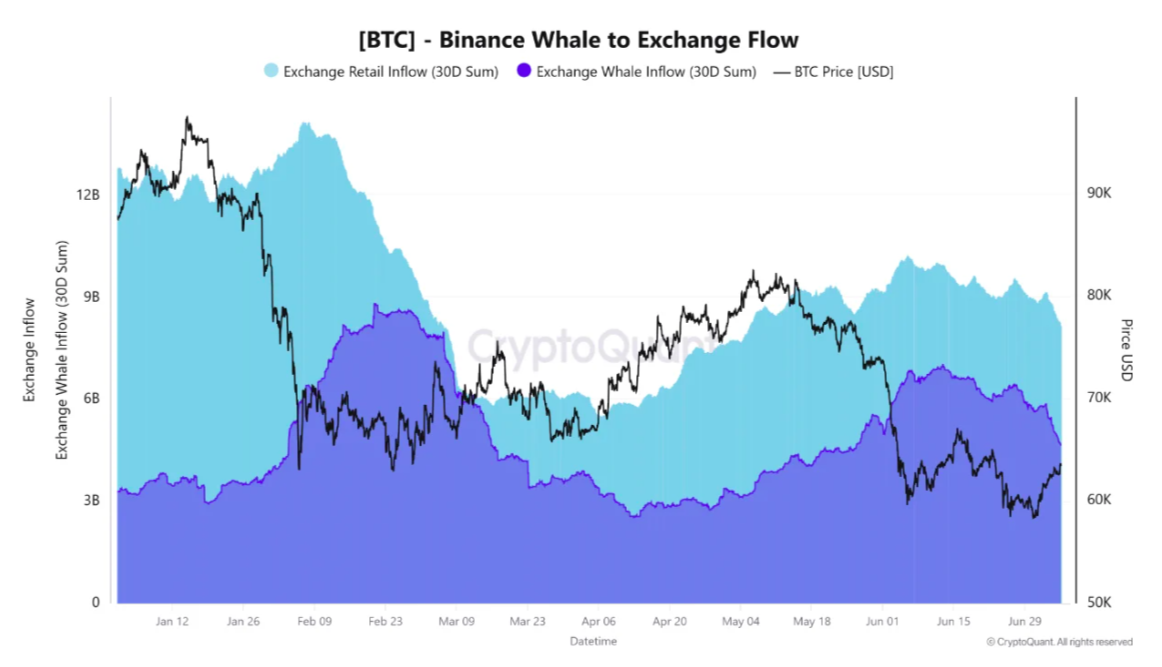
Bitcoin whale exchange flows to Binance (screenshot). Source: CryptoQuant
Earlier, Cointelegraph reported on whales’ overall market conviction improving around the lows.
CryptoQuant notes that exchange inflows are not an infallible signal of investors’ intent to sell.
“The key question now is whether Binance whale inflows stabilize around the current $4.65 billion level or continue moving lower,” Taha concluded.
“A further decline would reinforce the view that large Bitcoin holders are becoming less active on the exchange compared with the retail cohort.”
Crypto market fear “easing, not gone”
Bitcoin’s modest recovery was enough to boost crypto market sentiment considerably this week.
Related: Bollinger Bands creator eyes Bitcoin bear-market end, ‘W’-shaped reversal
The latest readings from the Crypto Fear & Greed Index show that aggregate sentiment is on the verge of exiting “extreme fear” for the first time in over a month.
Fear & Greed measured 24/100 on Monday, more than double its score at the start of July.
“That’s a clear improvement from recent lows. But the market is still in Extreme Fear,” trader Master of Crypto responded on X.
“Fear is easing, not gone.”
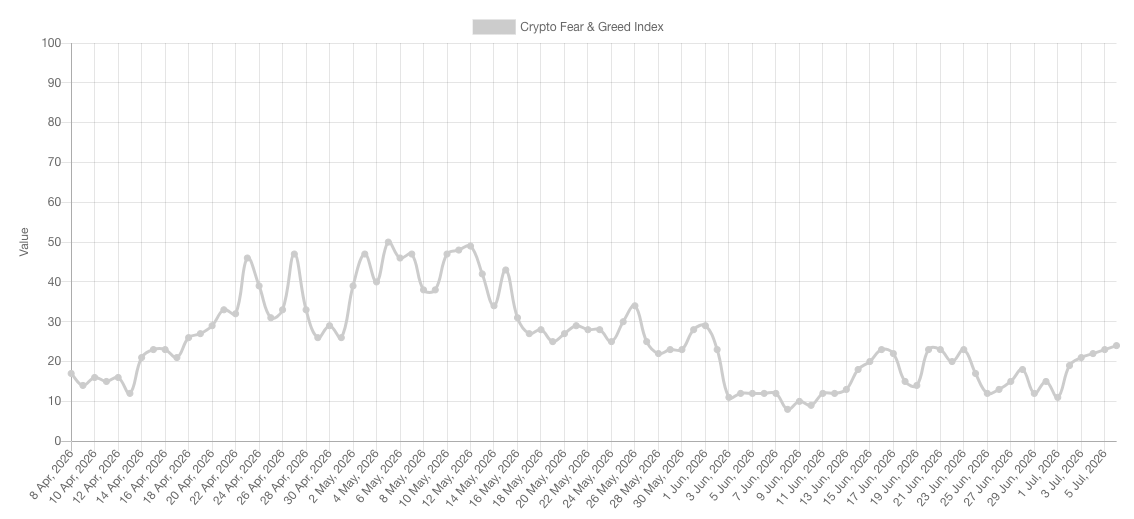
Crypto Fear & Greed Index (screenshot). Source: Alternative.me
As a lagging indicator, Fear & Greed tends to mirror existing shifts in market behavior post factum. While the Index is calculated based on a basket of factors, it lacks the ability to predict future trend continuation.
In his latest analysis published this week, commentator and blockchain advisor Anndy Lian argued that Bitcoin bulls needed to back up their optimism with tangible price moves.
“A successful breakout above that US$65,000 threshold would open the door to a broader test of the 100-day moving average, which currently hovers near US$69,500,” he wrote.
“Conversely, failing to sustain the current momentum carries severe downside risks.”
The German government has placed crypto taxation on its savings list for the 2027 federal budget. The move could end the crypto tax exemption that investors currently earn after a one-year holding period.
The Federal Ministry of Finance detailed the plan in its monthly report. An adjustment of cryptocurrency taxation for 2027 appears among the consolidation measures agreed by the governing coalition.
Crypto Taxes Join Germany’s Budget Consolidation List
The cabinet approved the key figures for the 2027 budget. The Ministry set a spending frame of €543.3 billion, with net borrowing of €110.8 billion.
Consolidation carries much of the load. The coalition agreed on structural savings of roughly €4 billion per year, alongside a package of revenue measures. That package includes new plastic and sugar levies, higher alcohol and tobacco taxes, a tougher fight against tax crime, and a change to how cryptocurrencies are taxed.

Why the Crypto Tax Exemption Is Under Pressure
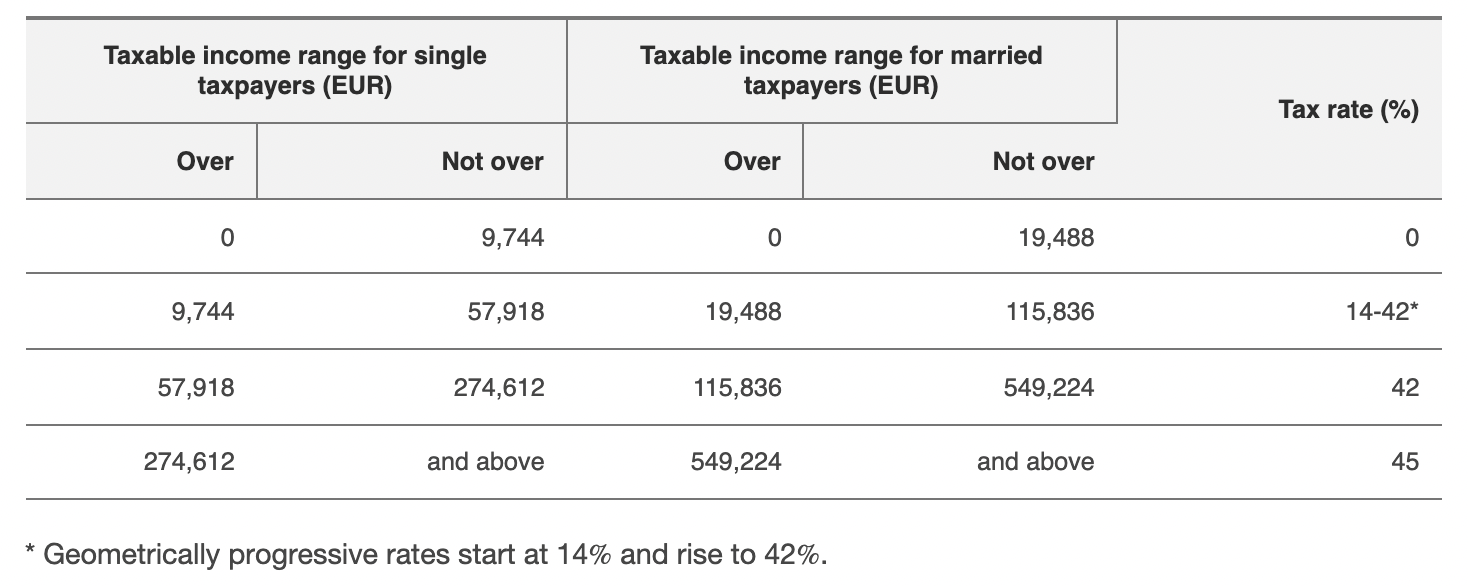
German law treats crypto as a private asset under Section 23 of the Income Tax Act. Gains become tax-free once coins have been held for more than 12 months. Sales within a year face personal income tax rates of up to 45%, while total annual gains below €1,000 stay untaxed.
Calls to scrap the rule have grown louder since late 2025.
“in future, capital gains should be taxed uniformly regardless of the holding period,” The SPD’s Seeheimer Kreis demanded in a position paper, cited by the Bitcoin Bundesverband.
Industry voices pushed back hard. Bundesverband board member Matthias Steger warned that taxing every disposal would turn each everyday payment into a tax event and push firms to friendlier countries such as Portugal.
Parliament has resisted similar moves before. In May 2026, the Bundestag Finance Committee rejected a comparable bid by the Green Party to abolish the exemption.
A Signal for the Rest of the EU
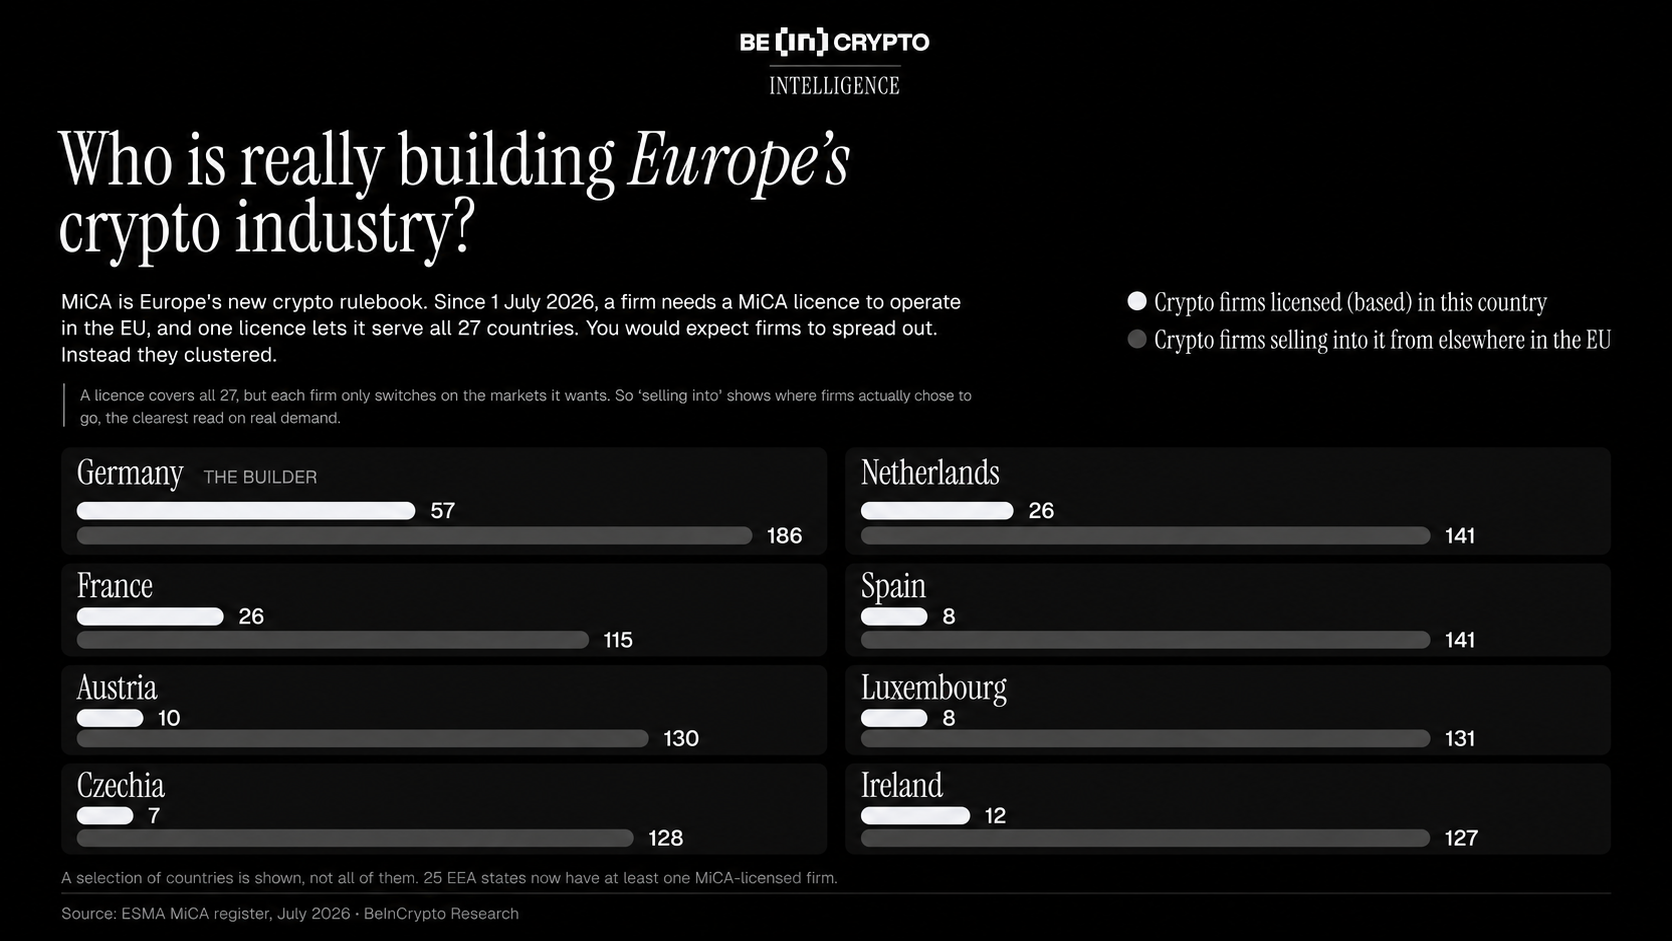
Germany is not the only EU country with such a rule, but it is close. Portugal is the sole other member state that fully exempts crypto gains after a one-year holding period. Austria, by contrast, scrapped its holding period in 2022 and now taxes new holdings at a flat 27.5%.
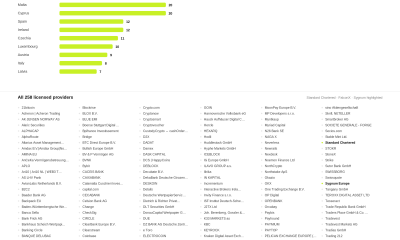
The stakes reach beyond national borders. As the EU’s largest economy and its leader in MiCA license approvals, Germany often sets the template that other member states follow.
That influence matters now more than ever. Because one in four European investors has invested in cryptocurrency, and new tax reporting rules under CARF and DAC8 are already in force. If Germany exits the exemption, it could reshape the debate in Brussels and beyond.
Whether the rule survives should become clearer once the Bundestag takes over the draft. A regime that made Germany one of Europe’s friendliest places to hold Bitcoin (BTC) long term now depends on how much revenue lawmakers believe they can raise from it.
The post Germany’s 2027 Budget Targets the Crypto Tax Exemption appeared first on BeInCrypto.


Coinbase sent a push notification about Norway beating Brazil in their World Cup match yesterday hours before the result of the match was actually decided.
The company’s AI hallucinated the “news” and, because Coinbase employees have permitted non-fact-checked push notifications in the first place, the computer blasted it onto the phones of countless customers.
Despite Coinbase’s 3-2 score turning out to be wrong, Norway did actually emerge victorious, winning 2-1 against the five-time world champions with Norway and Manchester City striker Erling Haaland scoring the goals.
Disconcertingly, Coinbase’s AI had also made up commentary about Haaland being the goalscorer before either of his actual goals hit the net.
Obviously, there are only two possible team names for the winner of a soccer game, so Coinbase guessing this isn’t particularly remarkable. Haaland is also Norway’s leading goalscorer, so he was also pretty likely to be the man to get the goals.
Still, Coinbase’s push notification was enough to generate hundreds of thousands of views worth of social media controversy.
Read more: Brian Armstrong sold more stock in 12 months than Coinbase’s Q1 loss
Coinbase’s AI reported its guess as fact
Coinbase, the largest crypto exchange in the US, doesn’t run its own sportsbook. Instead, it routes sports prediction markets through Kalshi’s federally regulated event-contract platform.
The exchange rolled that partnership out to all 50 states in January. The AI notification pulls in data from Kalshi, occasionally framing sharp market swings as so-called news.
Unfortunately, media often reports on the odds of prediction market betting lines as though these percentages are the odds of an event occurring in real life.
In reality, prediction markets are similar to binary options contracts and gambling, trivially easy to manipulate with relatively small amounts of money, and disproportionately reward market-makers.
Concerned, one customer posted a screenshot of Coinbase’s push notification about the Norway vs. Brazil outcome. “Apparently Coinbase has opened a miniature black hole, stepped into the future, and returned with news of Norway bouncing Brazil out of the World Cup… hours before the game has even started.”
More screenshots spread. A widely shared post complained that the exchange hallucinated a World Cup victory for game that hadn’t even played, drawing over 150,000 views.
Another user tagged Coinbase and asked, “Insider info or AI hallucination? This match won’t take place for another five hours.”
Coinbase already promised to fix its push notifications
Coinbase has previously blasted its customers with troubling prediction market alerts. It’s promised to fix the problem.
During the March Madness basketball tournament, customers complained to CEO Brian Armstrong for flooding lock screens on phones with prompts that encouraged them to “predict” sports gameplay.
Armstrong blamed a targeting bug and apologized.
Nevertheless, prediction markets alerts keep blasting for one simple reason: profit. Indeed, prediction markets are one of Coinbase’s fastest-growing business lines.
Bernstein analysts pegged the product at a roughly $100 million annualized run rate barely two months after it went live. Kalshi, Coinbase’s prediction market partner, paid roughly $20 million to plaster its logo across World Cup stadiums.
The incentive to make sports feel urgent and immediately tradeable is enormous.
Got a tip? Send us an email securely via Protos Leaks. For more informed news and investigations, follow us on X, Bluesky, and Google News, or subscribe to our YouTube channel.
Crypto World
Deribit and SignalPlus Launch The Island Trading Competition With Up to $600,000 USDC in Prizes


Deribit by Coinbase, via its broker-dealer DRB Panama Inc., and SignalPlus, a leading provider of software and infrastructure solutions for crypto derivatives, today announced the launch of The Island, their fifth trading competition and biggest edition to date.
Running for 35 days, the competition features up to $600,000 USDC in prizes across solo and team competition, daily and weekly reward rounds, Mystery Box deposit mechanics, short-dated options challenges, and a Private Island jackpot.
Registration for The Island opens on June 29 at 08:00 UTC, with the competition running from July 6 at 08:00 UTC through August 10 at 23:59 UTC. To participate, users must trade through SignalPlus on Deribit. Competition standings will be based on eligible options and futures trading volume only, with options weighted 1.0 and futures weighted 0.5.
The campaign is designed around eleven core arenas spanning weekly volume competition, daily reward loops, team participation, referral-driven expansion, whale and block-trade incentives, and dynamic ecosystem progression in one connected experience. New mechanics in this edition include the Mystery Box deposit experience, a weekly P&L leaderboard, short-dated options reward multipliers, and the Flash Arena, where higher short-dated options volume unlocks more jackpot shots and reward opportunities.
Key Details
- Total Prize Pool: Up to $600,000 USDC
- Registration Period: June 29, 2026, 08:00 UTC – August 10, 2026, 23:59 UTC
- Competition Period: July 6, 2026, 08:00 UTC – August 10, 2026, 23:59 UTC
- Eligibility: Open to eligible retail traders on Deribit via SignalPlus
- Registration Link: https://t.signalplus.com/deribitislandcompetition
This campaign is run by DRB Panama Inc and is not targeted at or intended for residents of Dubai, UAE. T&Cs apply. Virtual Assets are subject to extreme market volatility, involve a high degree of risk, and can lose value, in part or in full.
Early Bird Incentives
- Users who register by July 7th will receive 3 free Deribit options.
- Team captains who invite five or more friends to register by July 7th will have a chance to win a Cressi Velvet Wetsuit valued at 300 USDC.
- Among the first 10 participants to reach 200M in trading volume by July 12, one randomly selected winner will receive two RIMOWA suitcases valued at 5,000 USDC in total.
“The Island brings together everything we want this competition to be: bigger scale, stronger participation loops, and a structure that rewards how active options traders actually engage,” said Luuk Strijers, Senior Director from Deribit by Coinbase. “With solo and team competition, short-dated options mechanics and aspirational rewards led by the Private Island jackpot, this is our most ambitious retail trading campaign yet.”“We are excited to partner with Deribit by Coinbase once again on the latest edition of the competition,” said Chris Yu, CEO and Co-Founder from SignalPlus. “The Island is designed to make participation more dynamic and more rewarding, whether traders are competing on volume, teaming up with their network, or engaging through short-dated options and daily missions. Together, we are creating a more immersive experience for sophisticated retail traders.”
Competition Highlights include:
- Core Arena: Weekly solo and team trading leaderboards designed to reward notional trading activity across individual and squad-based competition.
- Mystery Box Deposit Round: Users who register and maintain deposits for seven days unlock Mystery Box draw chances tied to guaranteed USDC prizes and premium rewards.
- Daily Reward Ecosystem: Daily individual and team missions encourage repeat engagement, with volume-based rewards and team milestone unlocks.
- Flash Arena: Short-dated options trading powers daily reward multipliers and jackpot-style shooting mechanics, including access to the Private Island reward opportunity.
- Block Arena: High-balance and block-trade participants can unlock fee rebates and luxury reward opportunities.
- Expansion Arena: Referral mechanics reward both community growth and successful invitations of higher-value traders.
In addition to the Private Island headline reward, this year’s prize pool includes a range of premium rewards such as a Rolex Watch, Apple Vision Pro, NVIDIA Stock, Luxury Turkey Trip, Ledger Stax, Gentle Monster Sunglasses, Razer Keyboard, SOL spot rewards, trading fee coupons, and daily USDC prize pools.
The Island invites participants into a dynamic retail trading competition that combines strategic trading with team-based participation and a tiered reward structure. With every trade, participants move closer to exclusive rewards, from daily USDC prizes to the Private Island headline jackpot. The event begins today.
About Deribit
Deribit by Coinbase is a centralized, institutional-grade provider of crypto derivatives ecosystem, specializing in Bitcoin and Ethereum options and futures. With state-of-the-art infrastructure, Deribit offers instantaneous price discovery, low-latency execution, advanced risk mitigation tools, and deep liquidity through a network of top-tier market makers. Deribit facilitates the majority of global crypto options volume and upholds rigorous proof-of-reserves practices to maintain the highest standards of integrity and transparency.
About SignalPlus
Signalplus provides trading software and infrastructure for crypto derivatives, helping professional and sophisticated retail traders access options, futures, and spot markets with advanced execution and analytics tools. SignalPlus delivers a comprehensive options trading suite tailored for crypto derivatives traders.
The post Deribit and SignalPlus Launch The Island Trading Competition With Up to $600,000 USDC in Prizes appeared first on BeInCrypto.
Ripple has secured full MiCA authorisation in Luxembourg, giving the company a regulated route to offer cryptoasset services across the European Economic Area.
The approval from Luxembourg’s financial regulator, the CSSF, comes days after the European Union’s MiCA transition period ended. From July 2026, crypto firms need proper authorisation to keep serving EU clients.
For Ripple, the licence is more than a compliance milestone. It strengthens a bigger shift inside the company’s business. Ripple is building a regulated payment infrastructure around crypto, stablecoins, and institutional settlement, with XRP playing a less central role in the story.
What the Licence Actually Allows
The approval is a Crypto Asset Service Provider, or CASP, authorisation. In simple terms, this is the main MiCA licence for companies that provide crypto services in Europe.
A CASP licence can cover services such as crypto transfers, custody, exchanging crypto for fiat money, exchanging one cryptoasset for another, executing orders, and operating trading infrastructure. The exact scope depends on what the regulator approved for that company.
Ripple says the authorisation makes its regulated crypto payments product available to financial institutions, corporates, and businesses across all 30 EEA countries.

Ripple Also Has an Electronic Money License
Ripple also holds an EU Electronic Money Institution, or EMI, licence. That covers the fiat money and e-money side of payments.
Together, the CASP and EMI approvals give Ripple a stronger legal setup for payment flows that involve both traditional money and cryptoassets. A bank or company using Ripple’s infrastructure may need to collect funds, convert value, move digital assets, and pay out in another currency.
That is where Ripple’s business appears to be heading. The company is no longer defined only by XRP.
Its recent strategy points toward regulated payment rails, stablecoin settlement, and institutional crypto services.
The XRP Link Is Weaker Than It Looks
The approval does not mean EU regulators have approved XRP. MiCA authorises the service provider, not the token.
Still, XRP could benefit if Ripple’s payment activity drives more usage on the XRP Ledger. That would require real volume on XRPL, deeper XRP liquidity, and demand for XRP as a bridge asset.
The link is indirect. If Ripple’s stablecoin and payment activity runs through centralised venues or other chains, XRP may see little direct benefit.
RLUSD is the Main Attraction
Ripple’s dollar stablecoin fits more clearly into the company’s regulated payments push than the old XRP-focused narrative.
A stablecoin can support settlement, liquidity, remittances, and business payments in a way institutions understand more easily. In Europe, that becomes more valuable after MiCA, because firms now need licensed partners to handle cryptoasset services.

Ripple’s licence could therefore help RLUSD more directly than XRP. It gives Ripple a compliant European base to offer crypto payment infrastructure at the same time many unlicensed firms are being pushed out of the market.
The unresolved question is whether this turns into real adoption. Ripple now has the regulatory structure to sell into Europe’s institutional market.
The harder task is proving that banks and businesses want to use its crypto rails at scale.
The post Ripple’s MiCA Win Raises a Hard Question for XRP appeared first on BeInCrypto.

Bitcoin has rebounded nearly 10% from its July 1 low as weak U.S. jobs data, lower oil prices, and a weekend short squeeze pushed traders back toward risk assets.
Summary
- Bitcoin rebounded nearly 10% as weak U.S. jobs data boosted expectations for Fed rate cuts.
- ETF inflows returned after a prolonged outflow streak, while lower oil prices added to risk appetite.
- Analysts identify $64K as the key resistance, with $62.5K remaining the critical support level.
According to data from crypto.news, Bitcoin (BTC) price traded near $62,990 on July 6 after climbing from $58,293 earlier in the week to an intraday high near $64,000. The move followed a weaker-than-expected U.S. nonfarm payrolls report, which showed only 57,000 jobs added in June against forecasts near 110,000.
The miss reduced expectations for more Federal Reserve tightening and helped ease pressure on non-yielding assets. Crude oil traded below $69 per barrel on Monday as energy flows through the Strait of Hormuz recovered, and OPEC+’s planned 188,000-barrel-per-day production increase fueled concerns over a supply glut.
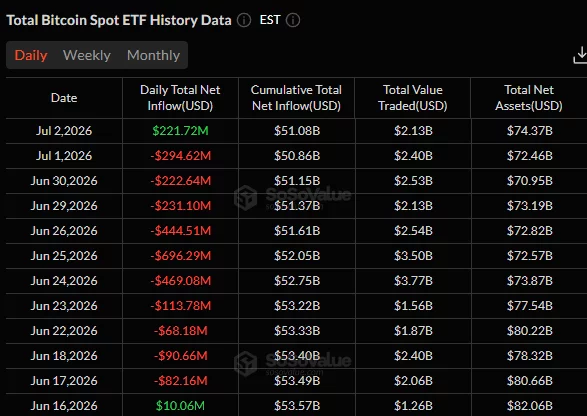
Spot Bitcoin ETFs added to the recovery after snapping a 10-day outflow streak with more than $220 million in net inflows. The rebound came after June produced more than $4.5 billion in redemptions and pushed sentiment into extreme fear, with the Crypto Fear & Greed Index falling to 11.
Bitcoin’s rebound faces its first major resistance near $64,000
The daily chart shows Bitcoin testing the 0.236 Fibonacci retracement level at $63,994 after bouncing from the June low zone near $58,187. A clean daily close above that level would open the next resistance area near $67,587, followed by $70,491 and $73,395.
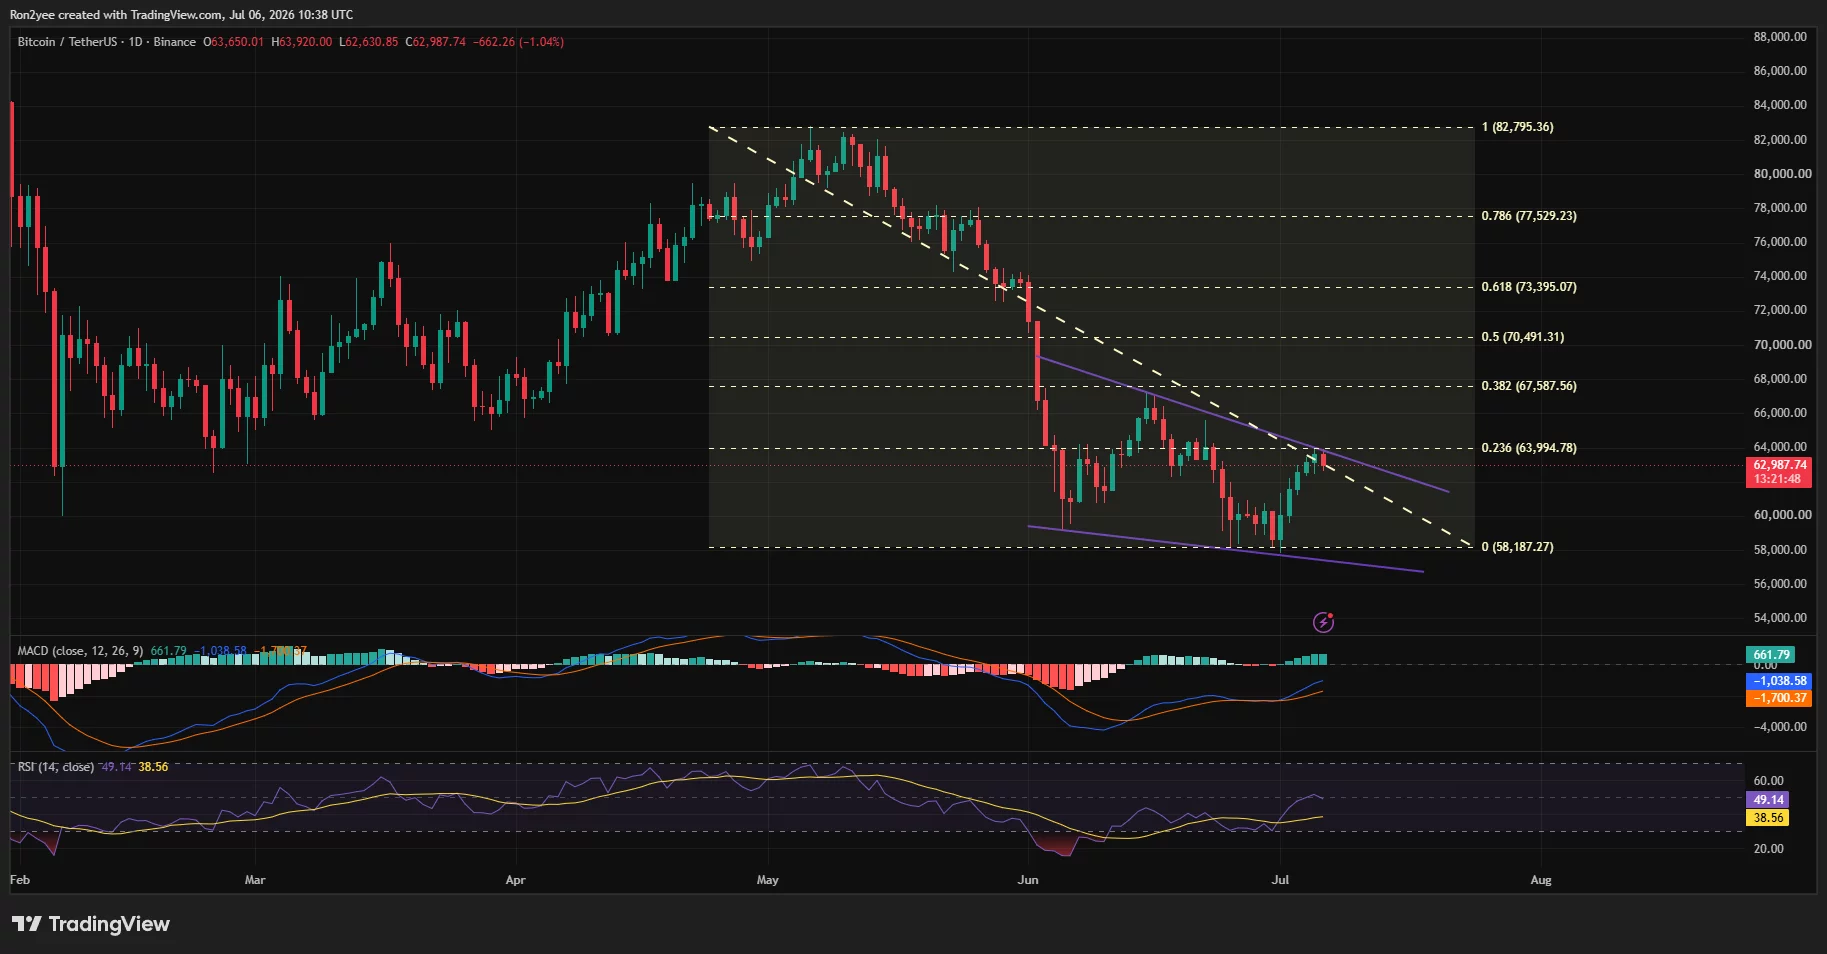
Bitcoin has also pushed back into a descending channel that has capped price action since the May high near $82,795. The latest candle is struggling near the channel’s upper boundary, making the $64,000 region the first key test for buyers.
Momentum has improved but not fully flipped bullish. The daily MACD histogram has turned positive at about 661, while the MACD line remains below the signal line. RSI has recovered to 49, just under the neutral 50 level, after rising from oversold territory in June.
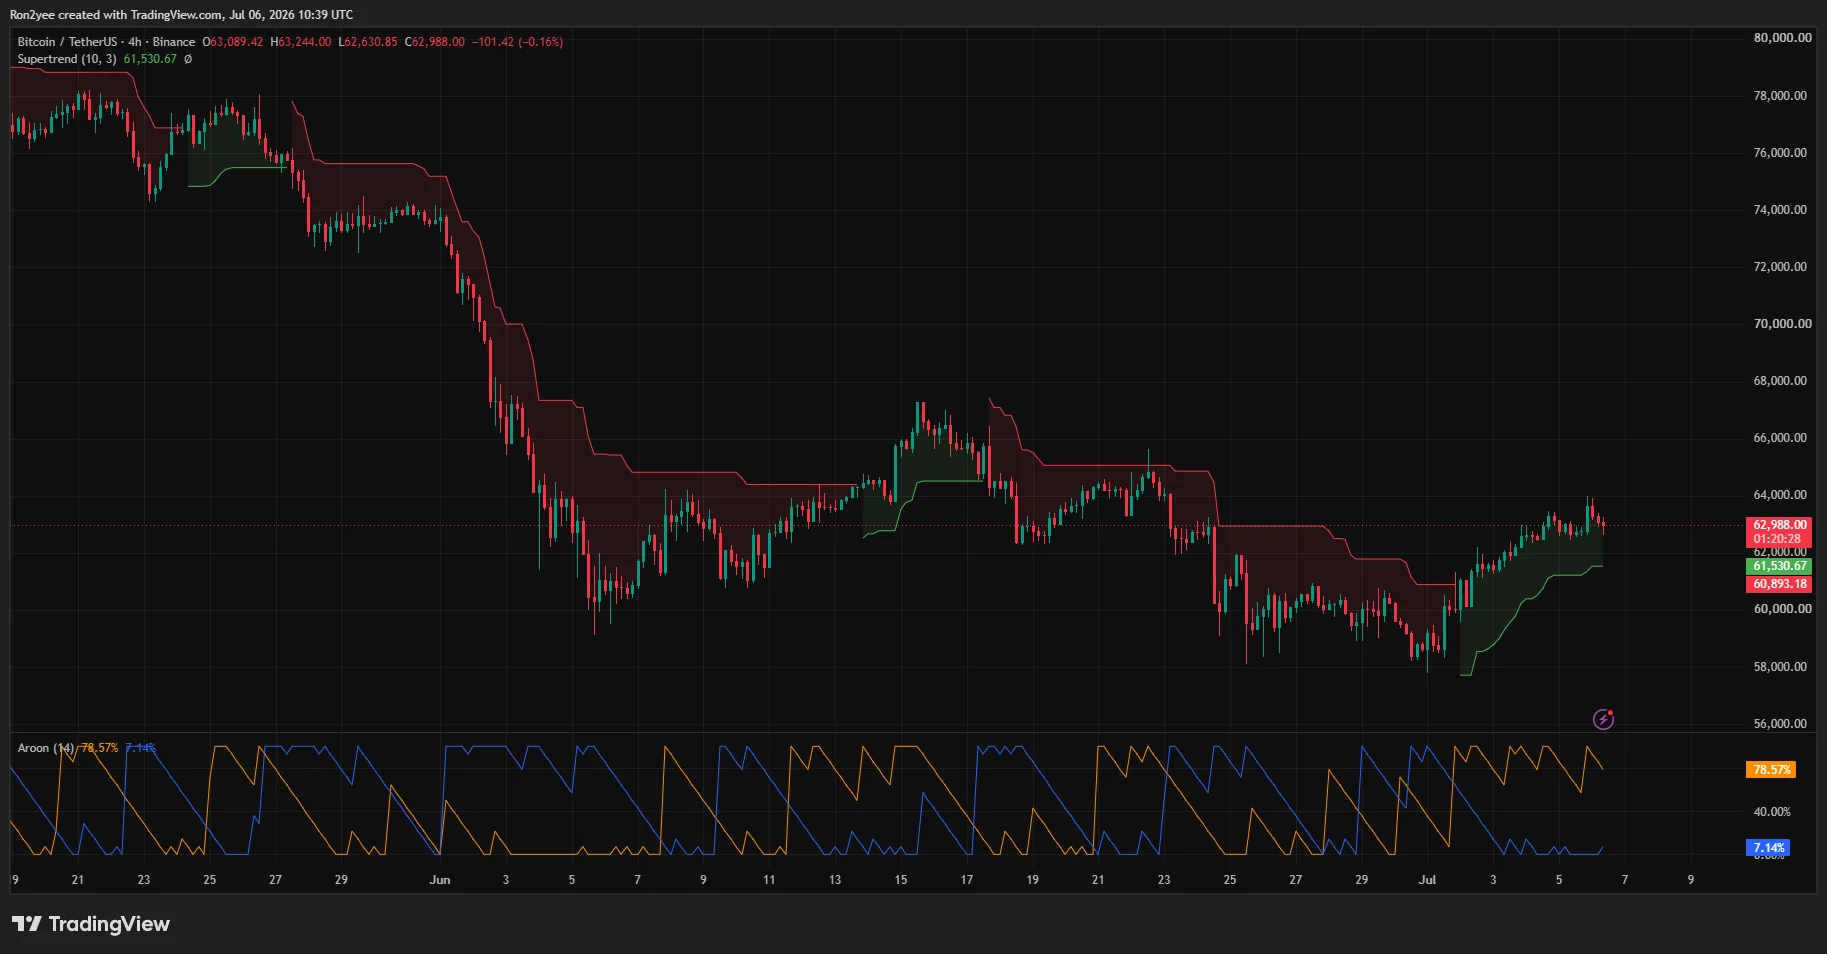
On the four-hour chart, Bitcoin is holding above the Supertrend support near $61,530, while the Aroon Up reading stands at 78.57 against Aroon Down at 7.14. The setup shows buyers have regained short-term control, though price remains below the next heavy resistance band around $64,000 to $65,000.
According to analyst Ted Pillows, the $62,500–$62,800 support zone remains the level to watch.
“$BTC is holding above the $62,500-$62,800 support zone. Spot selling has definitely accelerated, so this support zone is very crucial. If it holds, Bitcoin’s next stop would be around $65,000.”
Liquidation clusters leave Bitcoin exposed on both sides
CoinGlass’ three-day liquidation heatmap shows dense upside liquidity between $64,000 and $65,300, with another pocket near $66,000. A push through $64,000 could trigger another round of forced buying if short positions remain crowded above spot.
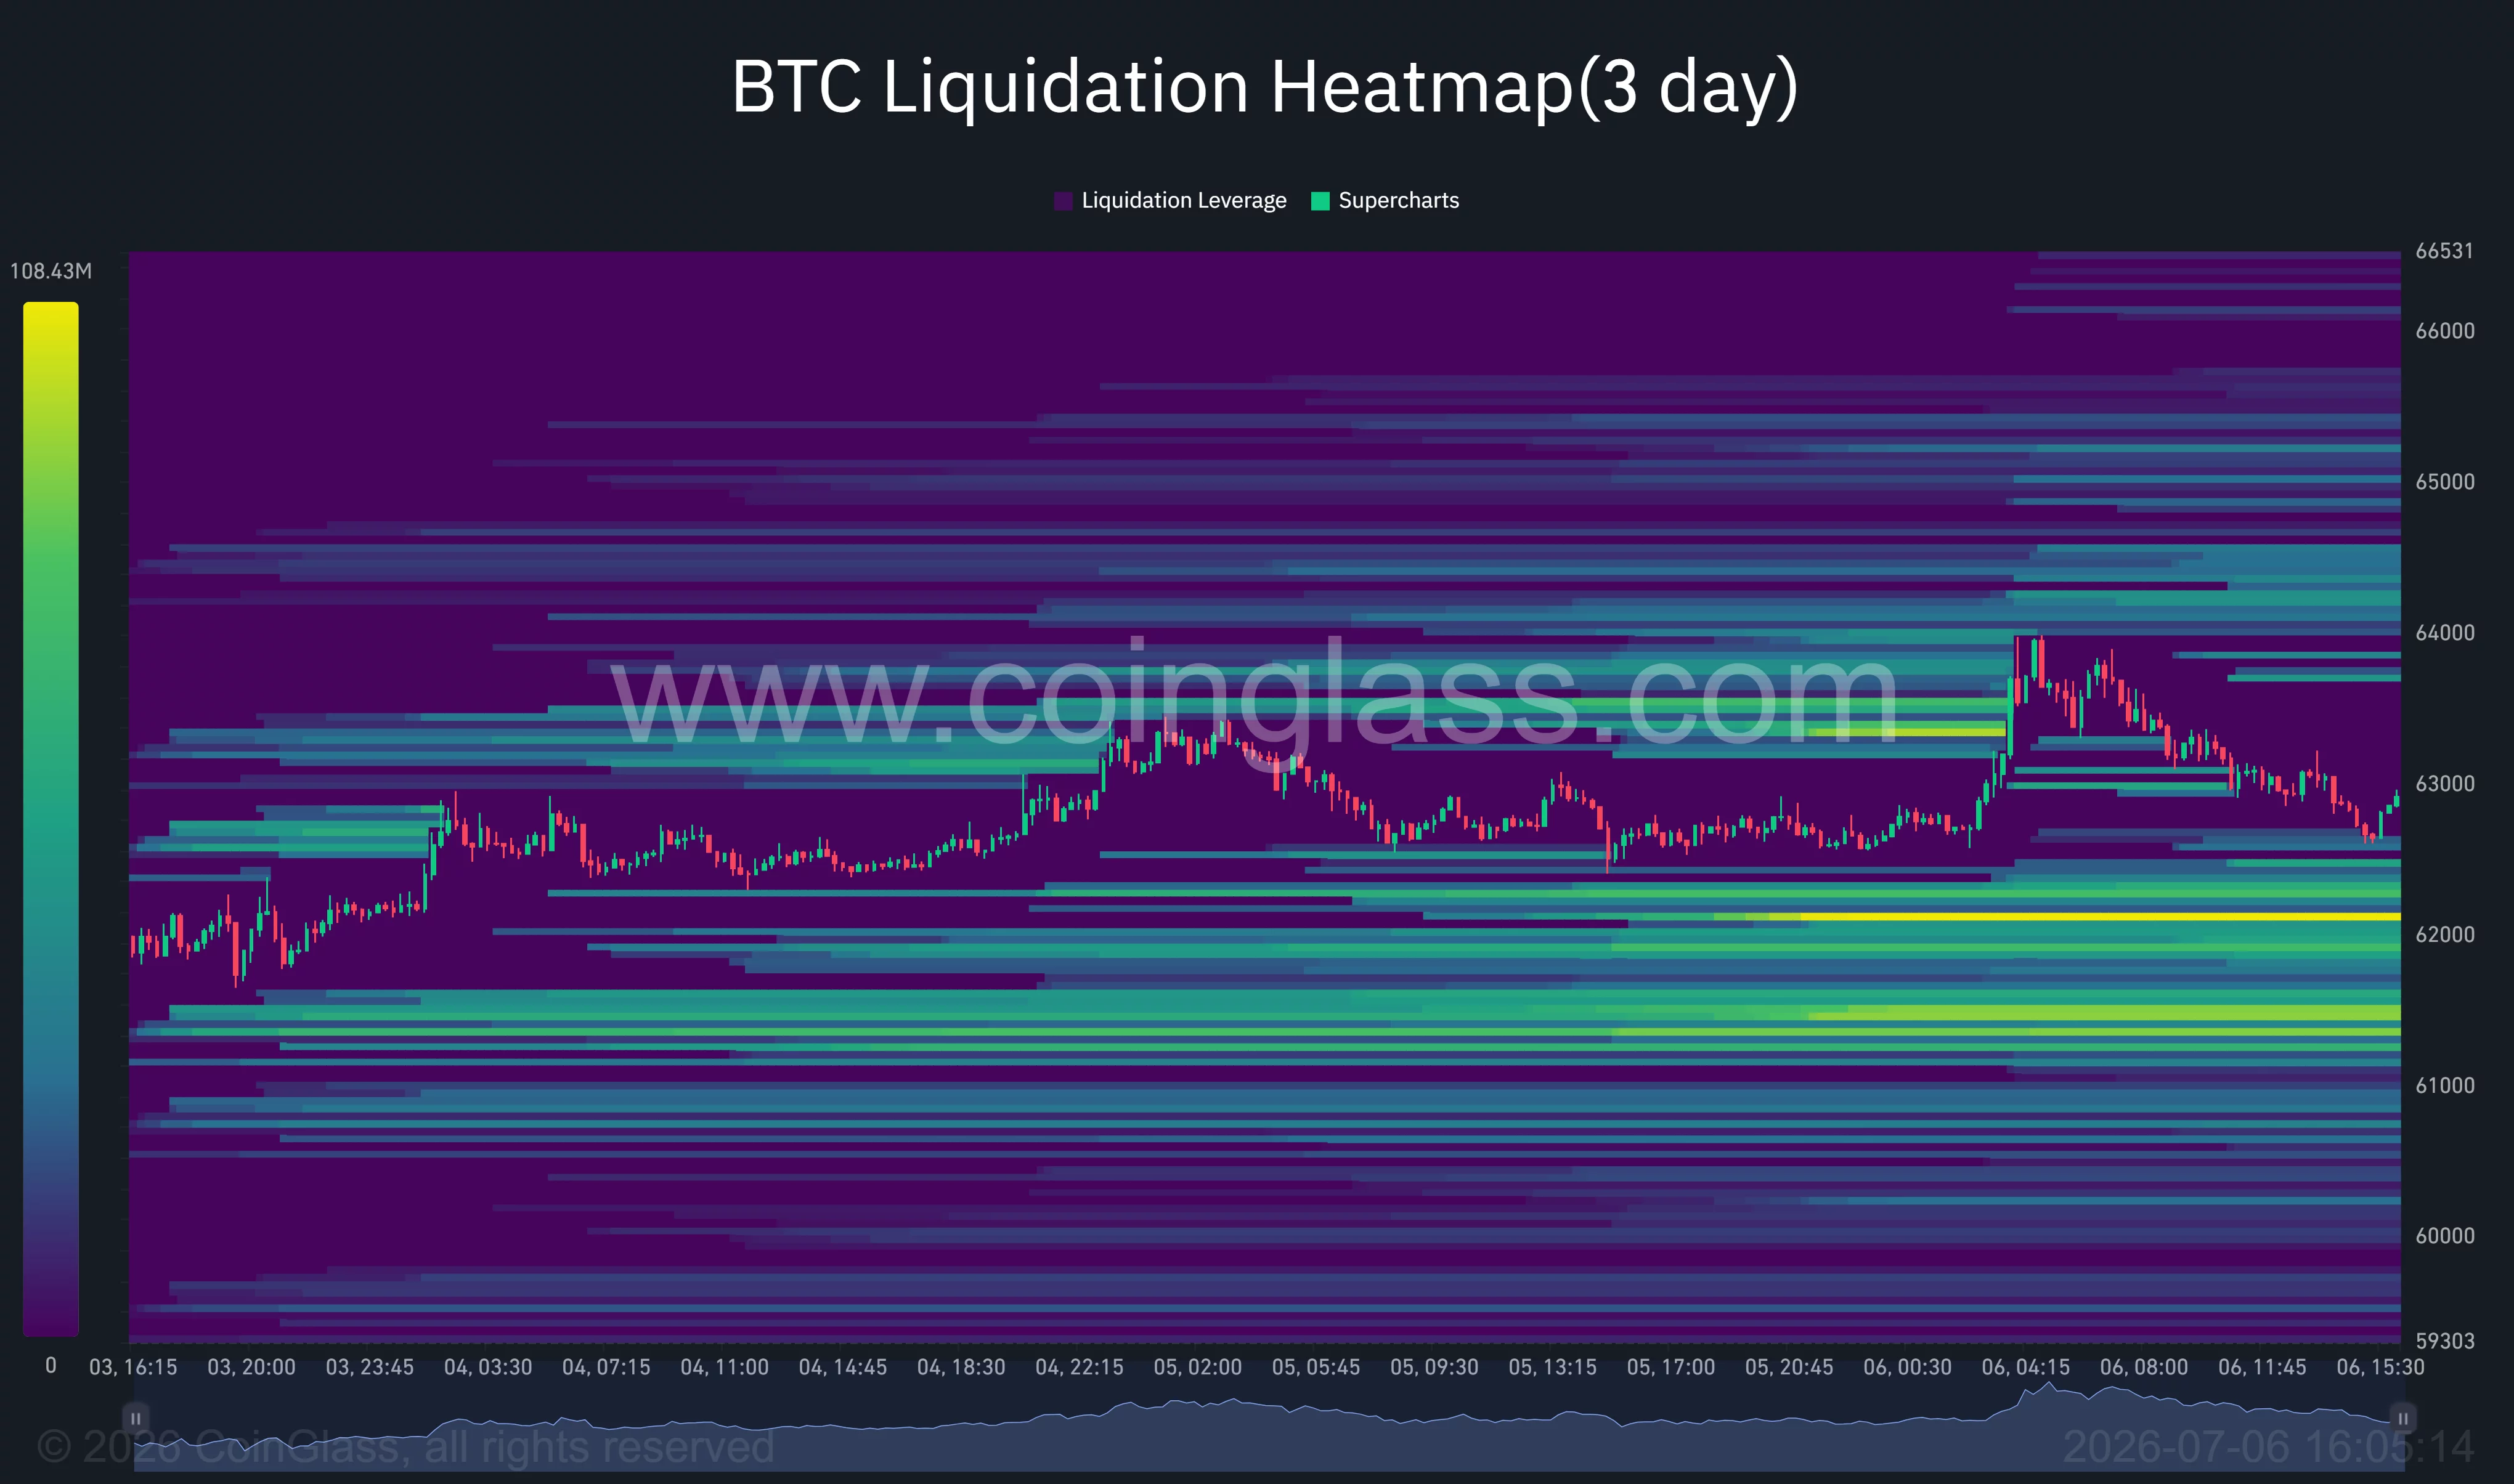
Downside liquidity is also visible near $62,000, $61,500, and $60,000. Those levels match the support areas identified by traders after Bitcoin’s quick move higher.
Commenting on the matter, analyst Lennaert Snyder noted that Bitcoin had already pushed into the final short point of interest and warned that the bounce lacked strong spot follow-through.
“I’m still in my swing-short from 63.2K, and willing to add if we get a clean break of ~62.5K,” Snyder wrote, adding that the move appeared to be driven mainly by short closing rather than fresh spot demand.
The invalidation zone for the bullish case now sits around $62,500. A four-hour close below that area could pull BTC toward $61,500, then $60,300 and $58,800, which Snyder listed as potential targets.
Macro risks remain active as well. A stronger July CPI print, hawkish Federal Reserve minutes, or renewed energy-market stress could revive dollar strength and pressure Bitcoin again. Supply risks from Mt. Gox repayments and government liquidations also remain unresolved.
For now, Bitcoin’s recovery depends on whether buyers can defend $62,500 and convert $64,000 into support. A failure there would leave the rally looking like a short squeeze inside a still-fragile downtrend.
Disclosure: This article does not represent investment advice. The content and materials featured on this page are for educational purposes only.

Versant to buy golf simulator company Full Swing for $530 million
Intel (INTC) Stock Climbs to $120.35 as Institutional Buying Accelerates

Kristin Chenoweth’s Exact Lip Gloss for a Lustrous Pout Is Just $24


-

 Fashion3 days ago
Weekend Open Thread: High Hopes
-

 Politics3 days ago
The House | “Reframing the debate from a binary discussion of winners and losers”: Yuan Yang reviews ‘We Are Not Machines’
-

 Crypto World6 days ago
Strategy authorizes up to $1.25B in Bitcoin sales under new capital plan
-

 News Videos6 days ago
How to Build INSANE Live Financial Dashboards With Claude
-

 Tech6 days ago
Anonymous researcher drops 0-day ‘exploitarium’ repo
-

 Business6 days ago
Australia treasurer says alleged access of prime minister’s bank data ’incredibly concerning’
-
 NewsBeat1 day ago
Taylor Swift and Travis Kelce wedding staffer hilariously struggles to keep her cool while checking in megastars
-
Crypto World5 days ago
Airdrop Registration Becomes Key Focus For Remittix As RTX Launch Updates Approach
-

 Sports5 days ago
Broncos roster: OL Ben Powers (No. 74) entering final year of contract
-
 Business7 days ago
The AI boom won’t burst all at once. It will pop in ‘rolling bubbles’: Macquarie
-

 Crypto World4 days ago
Binance stock trading tops $1B in first month after launch
-

 NewsBeat6 days ago
Presenter Caroline Flack’s brother Paul Flack dies aged 55
-

 Crypto World4 days ago
Alibaba-affiliate Ant Group enters the humanoid robot market with 12 deals
-
 NewsBeat4 days ago
New exhibition reflects five decades of movement between island of Ireland and GB
-

 Crypto World22 hours ago
South Africa proposes crypto tax guidance under existing rules
-
 Crypto World3 days ago
Standard Chartered Secures MiCA License as ESMA Adds 37 New Crypto Firms
-

 Tech1 day ago
Lenovo laptops are now shipping with YMTC SSDs, a sign of Chinese NAND entering the mainstream
-

 Business5 days ago
Meta Platforms Stock Jumps 7% Today as Bloomberg Reports Company Plans to Enter the Cloud Business
-

 Business3 days ago
What a 10 Percent Drop Means for Buyers, Sellers and Renters
-

 Crypto World4 days ago
Binance Re-Enters Philippines As EU MiCA Rules Restrict Access
You must be logged in to post a comment Login