
Crypto World
Apple (AAPL) Names John Ternus as Next CEO: Stock Dips on Leadership Change

Key Takeaways
- Tim Cook transitions from Apple CEO to Executive Chairman effective September 1, 2026
- Hardware Engineering SVP John Ternus, a 25-year Apple employee, named as successor
- AAPL shares declined 2.52% in response to the leadership announcement
- Q2 FY26 earnings scheduled for April 30; analysts project $1.94 EPS on revenue of $109.32B
- Wall Street maintains Moderate Buy rating with $305.81 average target price, suggesting ~12% potential gain
Apple appears ready to return to its product-focused roots.
The tech giant revealed Monday that Tim Cook will relinquish his CEO position on September 1, 2026, transitioning to Executive Chairman. John Ternus, who currently serves as Senior Vice President of Hardware Engineering after 25 years with the company, will assume the chief executive position. The announcement sent AAPL down 2.52%.
Ternus embodies Apple’s product-first philosophy. His signature accomplishment involved spearheading the Mac’s migration away from Intel processors to proprietary Apple Silicon — a strategic move that strengthened Apple’s competitive positioning in the personal computer sector.
His attention to detail borders on legendary. Speaking at a 2024 University of Pennsylvania commencement ceremony, Ternus shared a story about examining machined screw heads on the Cinema Display — his first Apple project. He discovered the manufacturer had added 35 concentric grooves instead of the specified 25.
“Maybe a customer notices, maybe they don’t,” Ternus explained. “But either way, whenever I saw one of those displays on someone’s desk, it mattered to me.”
This meticulous approach represents the foundation upon which Apple was established.
Refocusing on Product Excellence
Recent years saw Apple emphasizing its services ecosystem and artificial intelligence capabilities. The services division — encompassing App Store, AppleCare, and Apple Music — has delivered solid performance. The AI narrative has proven more challenging.
Selecting Ternus indicates a strategic realignment toward hardware as Apple’s fundamental strength. The reality is simple: without iPhones, Macs, iPads, and Watches, the accompanying services ecosystem becomes irrelevant. This appointment communicates that priority clearly.
Cook’s own succession plan mirrors his original ascension. Steve Jobs selected Cook — an operations and supply chain expert rather than a product visionary — because Apple required different leadership capabilities at that juncture. Today, Cook and the board are entrusting leadership to someone who thinks in precision measurements and manufacturing specifications.
The recently launched MacBook Neo, with student pricing beginning at $500, exemplifies the direction a Ternus-led Apple might pursue: competitive pricing while maintaining the premium quality standards the brand demands.
Financial Outlook and Shareholder Composition
The leadership transition comes just before Apple releases Q2 FY26 financial results on April 30. Analyst consensus calls for earnings per share of $1.94 alongside revenue reaching $109.32 billion.
Regarding shareholder structure, TipRanks data shows public companies and retail investors controlling 60.61% of AAPL. Exchange-traded funds represent 21.61% of ownership, while mutual funds hold 17.70%. Vanguard leads all institutional holders with 8.45%, followed by Vanguard Index Funds controlling 6.87%.
Wall Street analysts assign AAPL a Moderate Buy consensus rating, comprising 16 Buy recommendations, 8 Hold ratings, and 1 Sell rating across the previous three months. The consensus price target stands at $305.81 — approximately 12% higher than current trading levels.
Apple’s April 30 quarterly report will provide the initial significant gauge of market confidence in the new leadership framework.


Strategy (formerly MicroStrategy) already pays 11.5% annualized dividends on its ultra-risky Stretch (STRC) but DeFi users are now adding risks and leverage to crank that up to 39%.
In finance, interest rates are often dictated by the risk of total loss. With very few exceptions, when someone offers a higher interest rate, it’s because they’re much more likely to not pay you back.
Unbothered, traders are now re-routing Strategy’s dividend payouts through multiple blockchain protocols to manufacture yields of double, triple, or more what STRC actually pays.
They add future obligations in exchange for near-term payouts, take advantage of temporary incentives for obscure DeFi protocols, and add exotic forms of leverage to amplify the notional exposure of an otherwise small investment.
In the curious underworld of tokenized STRC, there are at least five protocols offering the financial machinery for DeFi yield farmers, not to mention the risks of the custodians and technology providers involved with these protocols.
A daisy-chain of DeFi risks to amplify STRC
Apyx wraps roughly $136 million of STRC into a synthetic stablecoin-like token called apxUSD. Saturn packages approximately $85 million worth of STRC into its USDat product. Another tokenization protocol xStocks put approximately $53 million worth of STRC on-chain.
Meanwhile, Pendle Finance splits these STRC tokens and the dividends paid to STRC stockholders into separately tradable, fixed-rate and floating-rate components, and Morpho provides the loan-looping mechanism at the end to add even more financial leverage on these instruments.
Depositing assets to borrow these tokens, which trade under a variety of ticker symbols like STRCx, apyUSD, apxUSD, USADT, sUSADT, strcUSX, traders borrow tokens, re-deposit some portion of those loan proceeds to take out more loans, re-deposit some portion of those loan proceeds to take out more loans, and so on.
The more loops and the smaller the range of prices that a user collateralizes, the higher the probability that the protocol will forcibly liquidate the position.
Irresponsible dividends, amplified
The base yield of STRC with no tokenization whatsoever is already extreme. STRC pays 11.50% annualized, roughly 450 basis points above the average junk bond.
Indeed, Strategy has hiked its dividend rate seven times since launching STRC at 9% in July 2025.
Each hike tacitly admitted that demand at the prior rate was too weak to hold up STRC’s secondary trading on Nasdaq at its intended $100 per share.
Read more: We calculated the present value of STRC — it’s bad for MSTR
Rather than ease up on leverage in light of the thinning air, DeFi’s response has been to treat 11.5% as a stable case on which to construct even higher artifices.
Apyx Finance closed a $300 million valuation round in February as a self-described dividend-backed stablecoin protocol.
It issues apxUSD backed by STRC and a related preferred like Strive’s STRC-like SATA, with apyUSD as the yield-bearing version of the same claim. Saturn Credit raised $800,000 from Sora Ventures and Changpeng Zhao’s YZi Labs in January to run the same play through USDat and sUSDat.
Both of these STRC tokenizers wrap their resulting tokens into Pendle, where PT-apyUSD locks in fixed yields of roughly 14.84%.
Users then deposit those PT tokens on Defi protocol Morpho as collateral to borrow USDC at rates as low as 1.59%.
The arithmetic isn’t subtle. A 5x leverage loop landed on a 64% APY. A separate analyst account documented 39% APY.
Hoping and praying STRC never de-pegs for long
On April 14, STRC was approaching its monthly dividend snapshot date, going “ex-dividend” in the parlance of Wall Street, causing its price to decline. That sag dragged sUSDat’s exchange rate below the high-water mark Pendle uses to govern yield accrual for the Saturn token.
Pendle had to explain this basis phenomenon to its users. “Yield accrual on YT-sUSDat is currently paused due to STRC’s ex-dividend event on 14 April, which pushed the exchange rate below the watermark,” it said.
It reassured holders that “If STRC recovers to $100, the watermark is recaptured, yield accrual resumes, and your total earnings will be ultimately unaffected.”
As always, the conditional “if” is doing a lot of heavy lifting.
Indeed, if STRC trades near $100 and pays dividends near 11.5% forever, everything will work out wonderfully.
In fact, STRC fell to $90.52 on November 21, 2025, and to $93.10 in February 2026. That’s why the dividend rate is where it is. It shouldn’t be a mystery as to why Strategy needs to pay such as higher dividend rate.
Unfortunately for STRC traders in DeFi, neither is guaranteed. The quasi-peg has already failed twice in the last six months. Moreover, Strategy’s board of directors can cut the dividend at its discretion.
DeFi traders are also exposed to countless numbers of protocol, blockchain, smart contract, and custodian risks that multiply these risks even higher.
Got a tip? Send us an email securely via Protos Leaks. For more informed news, follow us on X, Bluesky, and Google News, or subscribe to our YouTube channel.
Bitcoin pushed above $78,000, lifting the broader crypto market. The move came as risk sentiment improved after U.S. President Donald Trump extended the ceasefire with Iran. Stock index futures also gained.
The cryptocurrency’s ascent ended the weeks of choppy trading between $65,000 and $75,000 that defined March and early April, finally giving momentum traders the green signal they had been waiting for.
Momentum traders buy when they see proof that an upward trend is underway. Bitcoin’s breakout is exactly that, and more buyers could pile in as a result, adding to the momentum. As the first law of motion says: An object in motion stays in motion until an outside force acts upon it, though Sir Isaac Newton may not have been thinking of financial markets at the time.
“The market spent months capped in the 65 to 75 box. Breaking out of that kind of range matters because it changes behavior. Sellers who were comfortable fading rallies above 74 now have to reassess. Momentum buyers who were waiting for confirmation finally have something to lean on,” analysts at Marex said.
Onchain indicators suggest the same. For instance, the number of coins held in wallets tied to centralized exchanges has dropped to a fresh multiyear low of 2.67 millon BTC, according to data source CryptoQuant. It points to continued investor accumulation, which could culminate in a supply shock.
“Bitcoin supply on exchanges continues to shrink, with fewer coins available to sell, more BTC moving to long-term holders, and liquidity tightening. Bitcoin is becoming increasingly scarce – supply down means volatility up,” Delta Exchange said on X.
Still, QCP Capital is urging caution, noting the persistent relative richness of bitcoin put options on Deribit. Puts are used as a hedge against potential price drops in the underlying asset. It added that crypto trends currently seem tied to the price of oil and the interest-rate outlook.
“The path forward remains anchored to oil and policy. A move lower in crude or clearer Fed signaling would support risk. Absent that, markets are likely to remain in a holding pattern, pricing uncertainty rather than resolution,” the Singapore-based firm said in a market update.
In traditional markets, WTI crude futures are trading around $90, having bounced from a low of $78 on Friday.
In the broader market, DeFi security risks remain an issue as hacks proliferate. Early today, the Sui-based Volo protocol was drained of over $3 million just days after the KelpDAO event that caused collateral damage across the sector. Stay alert!
Read more: For analysis of today’s activity in altcoins and derivatives, see Crypto Markets Today . For a comprehensive list of events this week, see CoinDesk’s “Crypto Week Ahead.”
What’s trending
This is an excerpt from CoinDesk newsletter ‘Daybook.’ Sign up here, if you haven’t already.
Today’s signal

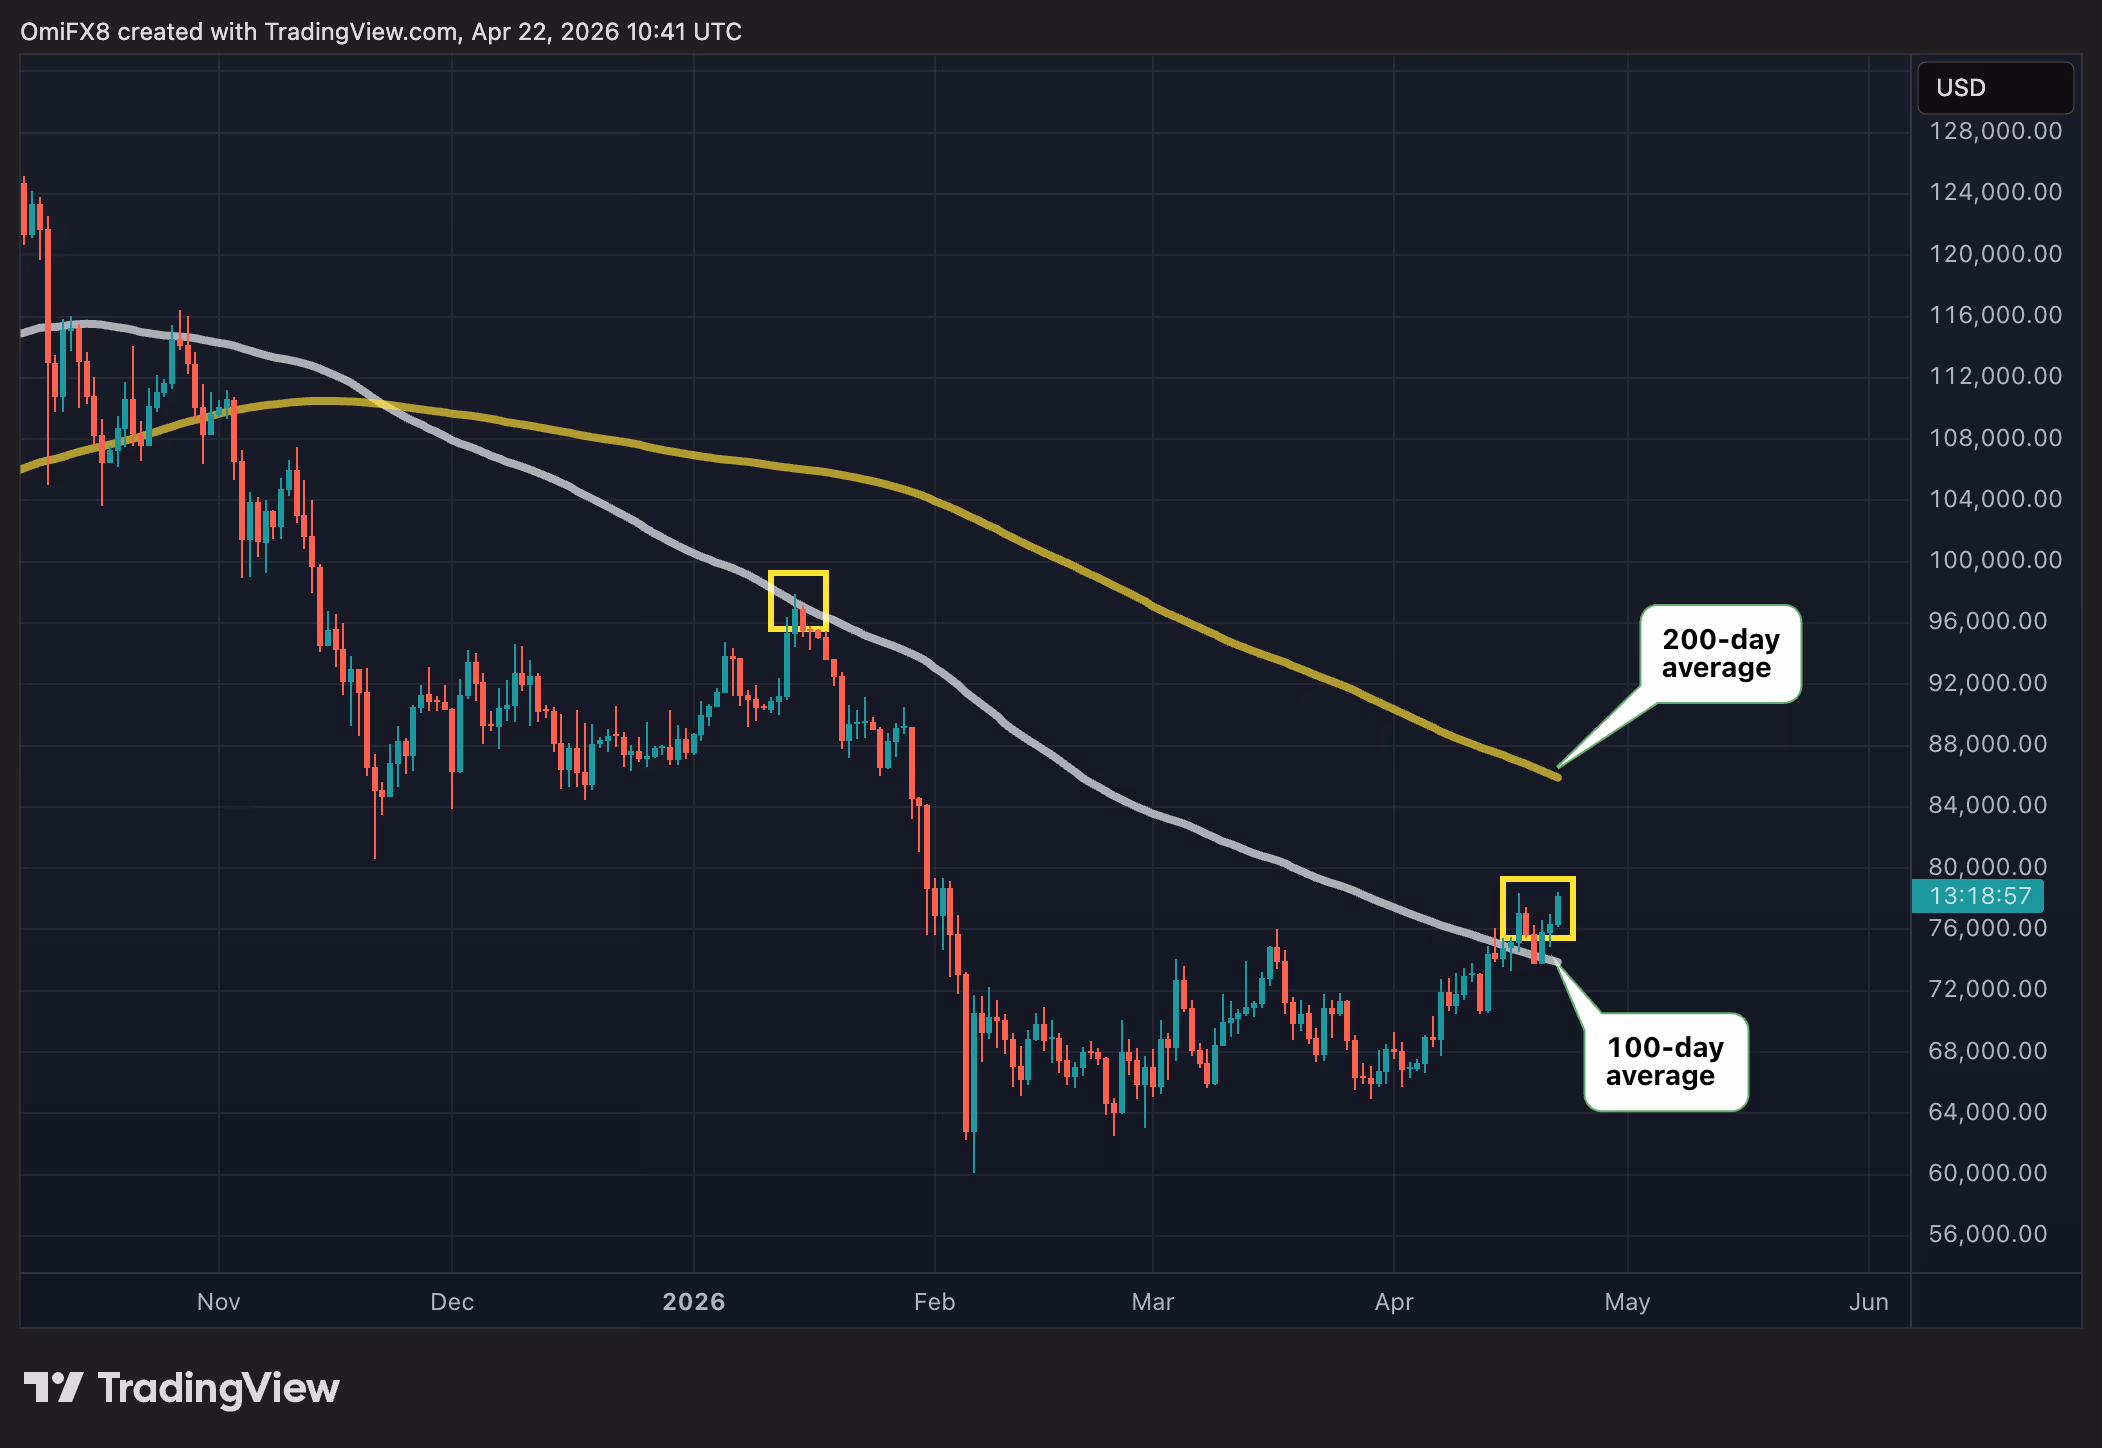
The chart shows bitcoin’s daily price movements in candlestick format, with lines indicating the 100-day and 200-day average prices.
BTC’s price has established a firm foothold above the 100-day average, represented by the white line. This is pivotal because the 100-day average capped the bounce in January, following which sellers re-established control, leading to a deeper crash to nearly $60,000.
Now the price has pierced through, which typically signals a strengthening of bullish momentum, focus shifts to the 200-day average, currently positioned at $85,900.
Crypto World
WOJAK Crypto Meme Coin Pumps 87% as MAXI Targets $5M: Analyst Calls Most Obvious Trade of 2026

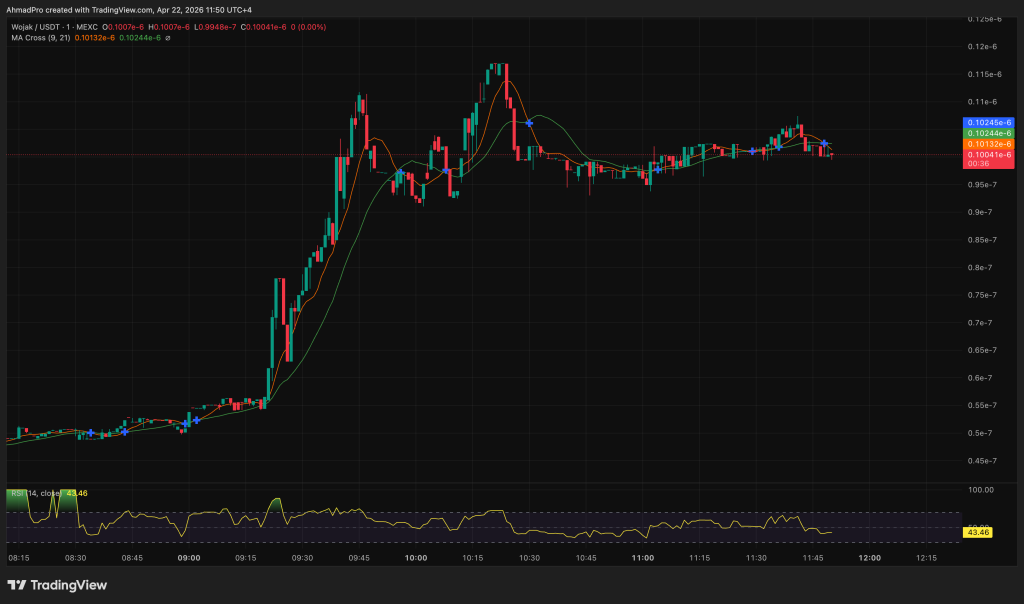
WOJAK crypto is moving again, and the meme coin faithful are paying attention. The original despair-fueled token surged as much as 87% in a 24-hour window, reigniting a sector that many had written off after months of sideways consolidation.
Whether this leg holds or fades fast is the question every trader is asking right now.
The rally appears supply-driven. On-chain data tracked by MEXC shows aggressive accumulation alongside a tightening circulating supply, with whale wallets absorbing selling pressure at key floor levels.
Volume spiked into the move, a distinction that separates genuine breakouts from low-liquidity noise. One chart making rounds on Crypto Twitter shows WOJAK printing its highest weekly close since its 2023 peak. That kind of structure demands a closer look.
The broader ETH memecoin sector is catching a bid at the same time, suggesting this isn’t an isolated pump. Ethereum-based meme tokens are drawing renewed capital as gas conditions improve and risk appetite expands, a context that matters when sizing any position here.
Can WOJAK Crypto Price Sustain Its Breakout or Is a Reversal Imminent?
WOJAK crypto is currently priced at approximately $0.0₆1021, sitting on a market cap of roughly $41.5M after the multi-day surge. That’s a meaningful number, small enough to move fast, large enough to attract institutional-grade meme traders who track this tier specifically.
The move here is not just a one-candle spike; it looks like sustained buying over a short window, with volume well above average, which usually signals real interest rather than a quick pump.
The structure is pretty clean when viewed in market-cap terms. Right now, the key resistance sits around $50M, and that is the level that decides whether this continues or stalls.
If it breaks above $50M with volume holding, that is where momentum can expand fast and open the path toward $100M as the next target, especially with traders chasing strength.
If it gets rejected there, the more realistic outcome is a cooldown, with price settling and accumulating around the $30M area while the market digests the move.
The risk is that it starts losing structure rather than consolidating, because once distribution kicks in, these moves unwind quickly.
And at this size, the further it runs without a reset, the worse the risk-reward gets, so anyone entering now is chasing momentum, not early positioning.
Maxi Doge Presale Nears $5M as WOJAK Traders Hunt Earlier-Stage Upside
WOJAK’s surge is validating the meme coin thesis — but at $21.5M market cap and already up 187%, the easy money has cleared the table (that’s just math). Traders who want the next WOJAK-style move, not the current one, are looking earlier in the funnel.
Maxi Doge ($MAXI) is currently the presale generating the most discussion in that context. Built on Ethereum as an ERC-20, the project has raised $4,748,137.43 at a current price of $0.0002814 — closing in hard on the $5M milestone.
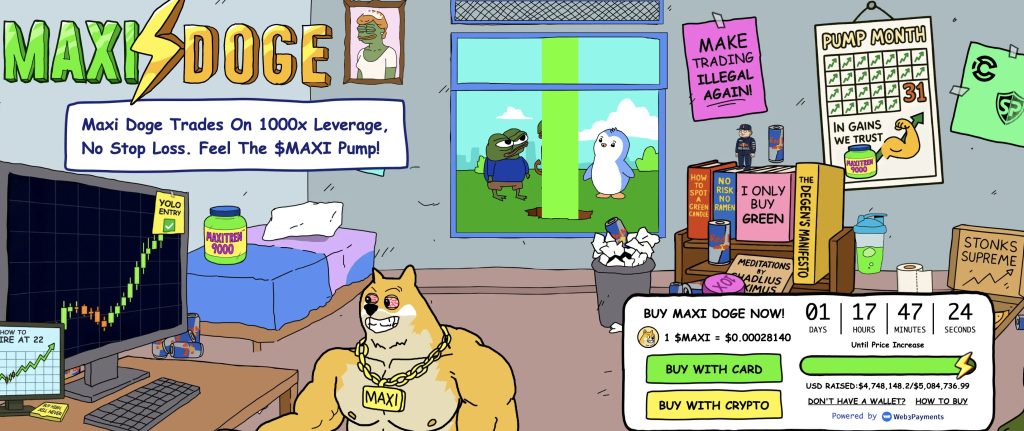
The concept is built around a 240-lb canine juggernaut embodying a 1000x leverage trading mentality: gym-bro energy meets aggressive market culture, packaged into holder-only trading competitions with leaderboard rewards and a Maxi Fund treasury backing liquidity and partnerships.
Recent coverage confirms the presale’s momentum toward that $5M threshold. Dynamic staking APY is live for current holders. The tagline, never skip leg-day, never skip a pump, is aggressively on-brand for the audience it’s targeting.
Presales carry real risk: no secondary market liquidity until launch, and meme projects live or die on community velocity. Do the work. But for traders who missed WOJAK’s entry, Maxi Doge is worth researching before that $5M milestone closes the current tier.
The post WOJAK Crypto Meme Coin Pumps 87% as MAXI Targets $5M: Analyst Calls Most Obvious Trade of 2026 appeared first on Cryptonews.
Bitcoin (BTC) price metrics are showing relief this month, but the risk of repeating the 2022 bear market remains.
Key points:
-
Bitcoin’s Bull Score Index combined price metric reaches its highest levels since October last year.
-
The relief may be short-lived, analysis warns, pointing to the 2022 bear market.
-
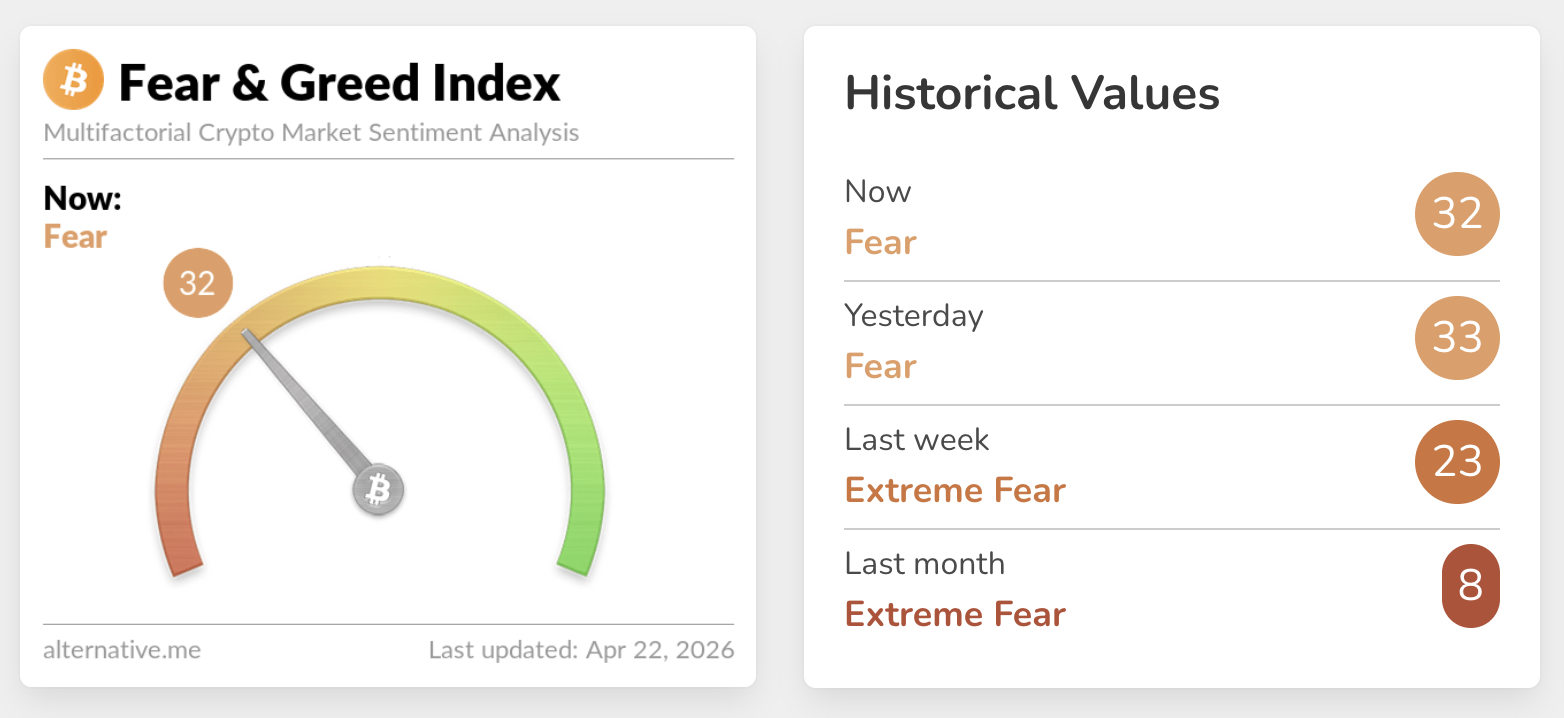
Crypto sentiment reaches its most bullish since January, per the Crypto Fear & Greed Index.
Bitcoin Bull Score Index ditches “bearish” zone
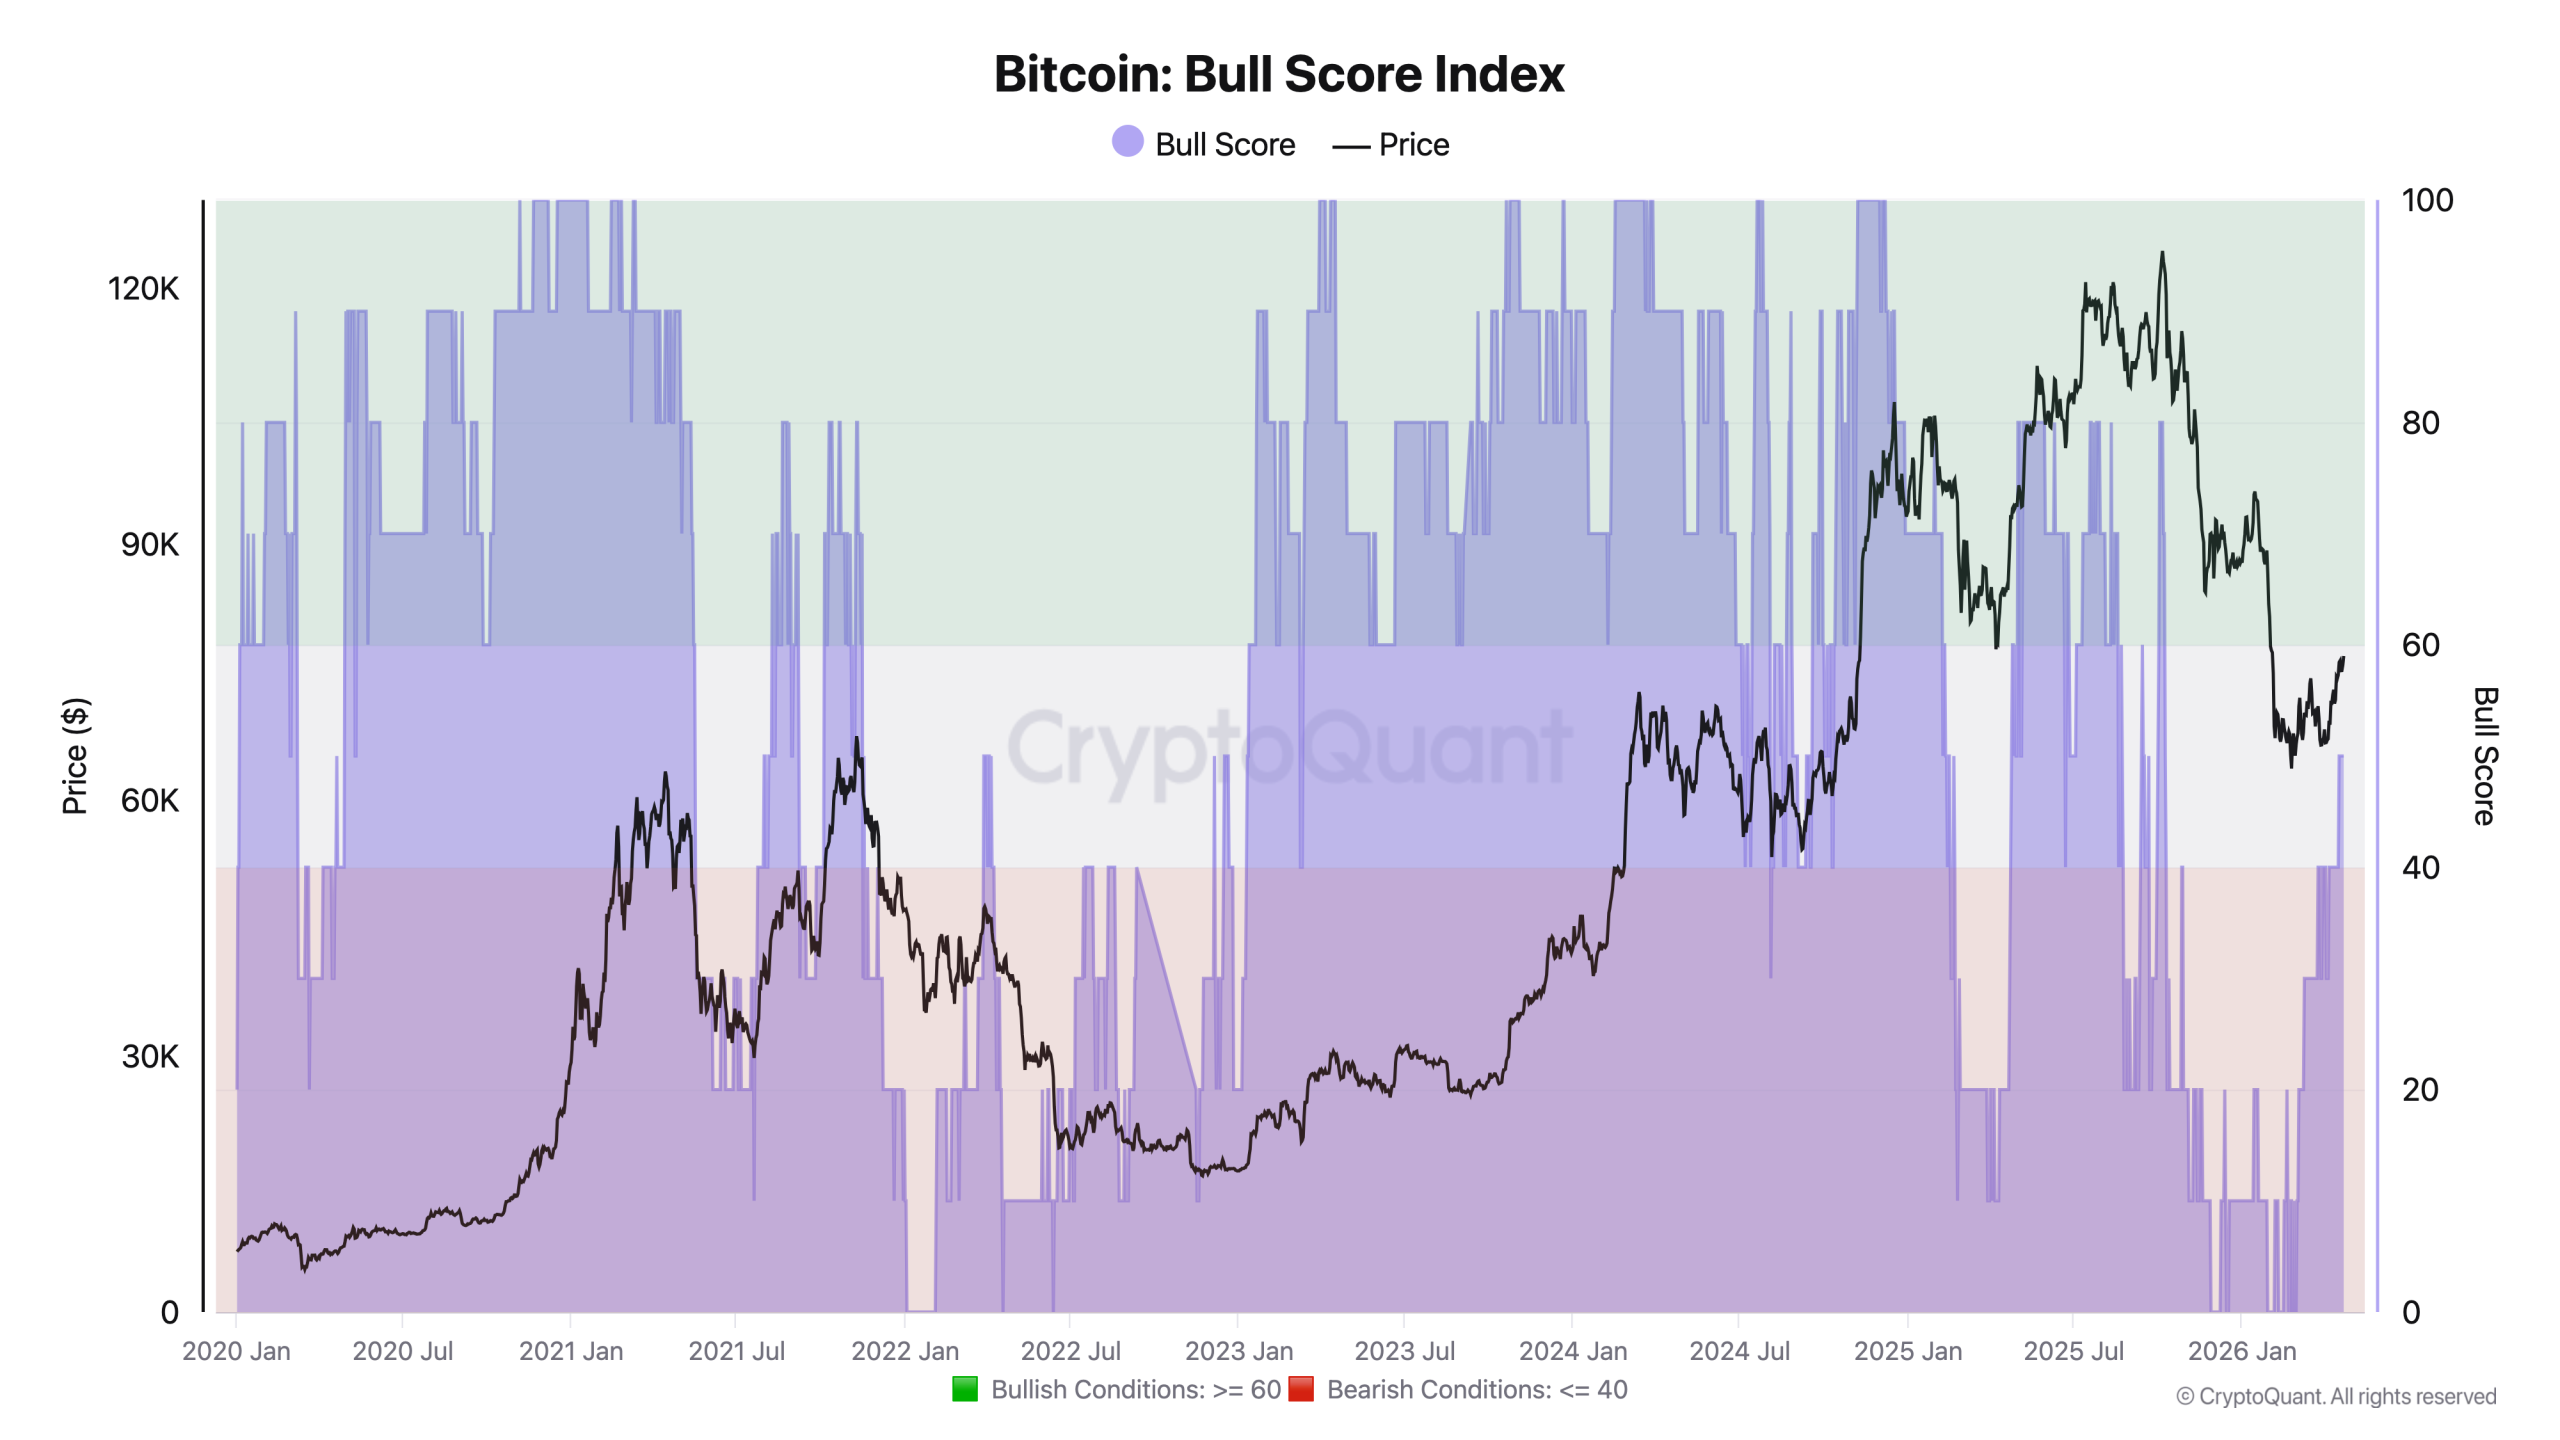
New data from onchain analytics platform CryptoQuant place the spotlight on the Bitcoin Bull Score Index (BSI).
Bitcoin has finally entered “neutral” territory with its push to $78,000, the latest BSI data confirms, with the Index climbing to its highest since October 2025.
BSI incorporates nine price metrics to give an overall impression of performance. Since the bear market began, it has been sharply bearish — just as in the early stages of the previous bear market four years ago.
“First time in this bear market that the Bull Score Index enters neutral zone (50),” CryptoQuant contributor Julio Moreno noted in an X post on Wednesday.

Moreno cautioned that despite the pressure being off for now, BSI also had a brief cooling-off period before the 2022 bear market continued.
“In March 2022, the Bull Score entered neutral territory for about a week, and then the price resumed its decline,” he added.
Should history repeat, attention will be on the Index’s performance into the April monthly close, as BTC/USD attempts to break out of a multi-month range.
Examining BSI readings last week, with price around $74,000, CryptoQuant contributor Arab Chain described a “balance between supply and demand forces.”
“On the other hand, the current BSI reading shows that the market is still far from the area of strong optimism (above 60), which typically indicates strong bullish conditions, while also remaining above the zone of extreme pessimism (clearly below 40),” they wrote in a “QuickTake” blog post.
“This places the market in a transitional phase, as investors await new catalysts to determine the next direction.”
Sentiment edges to most bullish since January
Other signs of a broader market recovery come from crypto trader sentiment.
Related: BTC price due new highs: Five things to know in Bitcoin this week
🚨 UPDATE: Crypto Fear & Greed Index sits at 32 (Fear) today, a notable recovery from Extreme Fear at 23 last week. pic.twitter.com/lmjfjh0Ui3
— Cointelegraph (@Cointelegraph) April 22, 2026
According to the Crypto Fear & Greed Index, a classic lagging indicator that uses a basket of factors to reflect the mood among investors, conditions are at their least negative since mid-January.
Fear & Greed measured 32/100 on Wednesday — still within its “fear” zone while like BSI also approaching the “neutral” bracket.
The Index value has nearly tripled in a little over a week.

This article is produced in accordance with Cointelegraph’s Editorial Policy and is intended for informational purposes only. It does not constitute investment advice or recommendations. All investments and trades carry risk; readers are encouraged to conduct independent research before making any decisions. Cointelegraph makes no guarantees regarding the accuracy or completeness of the information presented, including forward-looking statements, and will not be liable for any loss or damage arising from reliance on this content.
Stablecoin Dispute Blocks Legislative Progress
The CLARITY Act remains stalled in the Senate Banking Committee despite earlier bipartisan support. The bill passed the House in July 2025 with a 294–134 vote, signaling strong initial backing. However, disagreements over stablecoin yields have created a major obstacle.
Banks argue that allowing crypto platforms to offer yield-like rewards could trigger deposit outflows. They warn that reduced deposits may weaken lending capacity. Crypto firms, on the other hand, maintain that stablecoin rewards support their revenue models and user growth. This conflict has prevented consensus, as both sides continue to resist compromise.
The dispute reflects broader tensions between traditional finance and digital asset platforms. Lawmakers must balance financial stability concerns with innovation demands. Without agreement on this issue, the bill cannot advance to the next stage.
Industry Pushback and Senate Delays
Momentum weakened further in January 2026 when Brian Armstrong withdrew support for the Senate draft. He criticized provisions affecting stablecoin rewards and other industry concerns. Shortly after his statement, the Senate Banking Committee postponed its markup vote indefinitely.
This decision disrupted the legislative timeline and delayed progress by several months. The Senate Agriculture Committee approved its portion of the bill in January, yet the Banking Committee has not scheduled a new markup date. Ongoing negotiations continue, but lawmakers have not finalized key provisions.
The absence of a scheduled vote keeps the bill in legislative limbo. Each delay reduces the likelihood of timely passage. Industry divisions also complicate negotiations, as stakeholders push for favorable terms.
Time Pressure and External Priorities
The legislative calendar now poses a serious challenge. Lawmakers must move the bill through committees, secure Senate approval, and reconcile it with the House version. These steps require time and coordination.
However, attention is shifting toward the 2026 United States midterm elections. As election season approaches, legislative priorities often change. If the Senate does not act soon, the bill may face further delays or lose momentum entirely.
At the same time, geopolitical tensions, including issues involving Iran, have redirected focus toward national security matters. This shift reduces the time available for financial legislation.
The CLARITY Act now faces overlapping challenges. Policy disagreements, industry resistance, and limited legislative time continue to slow its progress.
Crypto World
BTC price stalls at $78,000 as traders brace for liquidation-driven breakout: Crypto Markets Today
The crypto market is on the brink of a major breakout with bitcoin trading at $78,000, the level it failed to breach on Friday and a price it has not topped since January.
A break above this level would trigger upside momentum to $80,000 as $180 million worth of futures positions are due to be liquidated between $77,000 and $78,000, according to CoinGlass’ liquidation heatmap.
However, there is also a $71 million long position that will be liquidated if the price fails to gain and descends back below $77,300, creating a defensive trading environment on both sides.
The market is higher after U.S. President Donald Trump extended the ceasefire in Iran, saying that country’s government was “seriously fractured.”
Nasdaq 100 futures and S&P 500 futures rose by 0.77% and 0.6%, respectively, since midnight UTC following the announcement, suggesting improving broader market sentiment.
Derivatives positioning
- BTC’s breakout to $78,000 caught the bears off guard, leading to $286 million in marketwide short liquidations on derivative exchanges. Longs, or bullish plays, suffered liquidations of just $132 million.
- Still, overall crypto futures open interest (OI) has increased by over 4% to $126 billion in 24 hours. Notably, OI grew across the major tokens, including bitcoin and ether (ETH), outpacing spot price gains, indicating renewed capital inflows and rising demand for leverage.
- Funding rates have flipped positive for most tokens, including BTC, indicating a renewed bias for bullish bets. The 24-hour cumulative volume delta also paints the same picture.
- M token stands out with annualized funding rates above 200%, signaling an overheated market crowded with bullish bets. Meanwhile, the HYPE and XML markets show a bias toward bearish short plays.
- Broadly speaking, crypto futures activity suggests scope for further market gains. Also supporting the bull case are bitcoin and ether’s 30-day implied volatility indices, which remain under pressure, pointing to market calm.
- On Deribit, bitcoin and ether risk reversals continue to print negative values across all time frames. That’s a sign of the richness of protective put options relative to calls.
- Block flows featured investor bias for call ratio spreads, a strategy used by traders to profit from a moderately bullish, sideways or slightly rising market. Traders also chased bitcoin and ether straddles, a volatility strategy.
Token talk
- The altcoin market was also in a buoyant mood on Wednesday, with all major CoinDesk indexes posting gains of at least 1.5% since midnight UTC.
- The CoinDesk MemeCoin Index (CDMEME) was the top performer, rising 3.4%, with one person turning $575 into more than $1 million on recently released token ASTEROID.
- Popular memecoins TRUMP and DOGE added 6% and 3.8%, respectively, reflecting broader optimism across the sector.
- There was also a boost in privacy coins DASH and XMR, both of which gained 6%-7% over the past 24 hours before tailing off slightly since midnight.
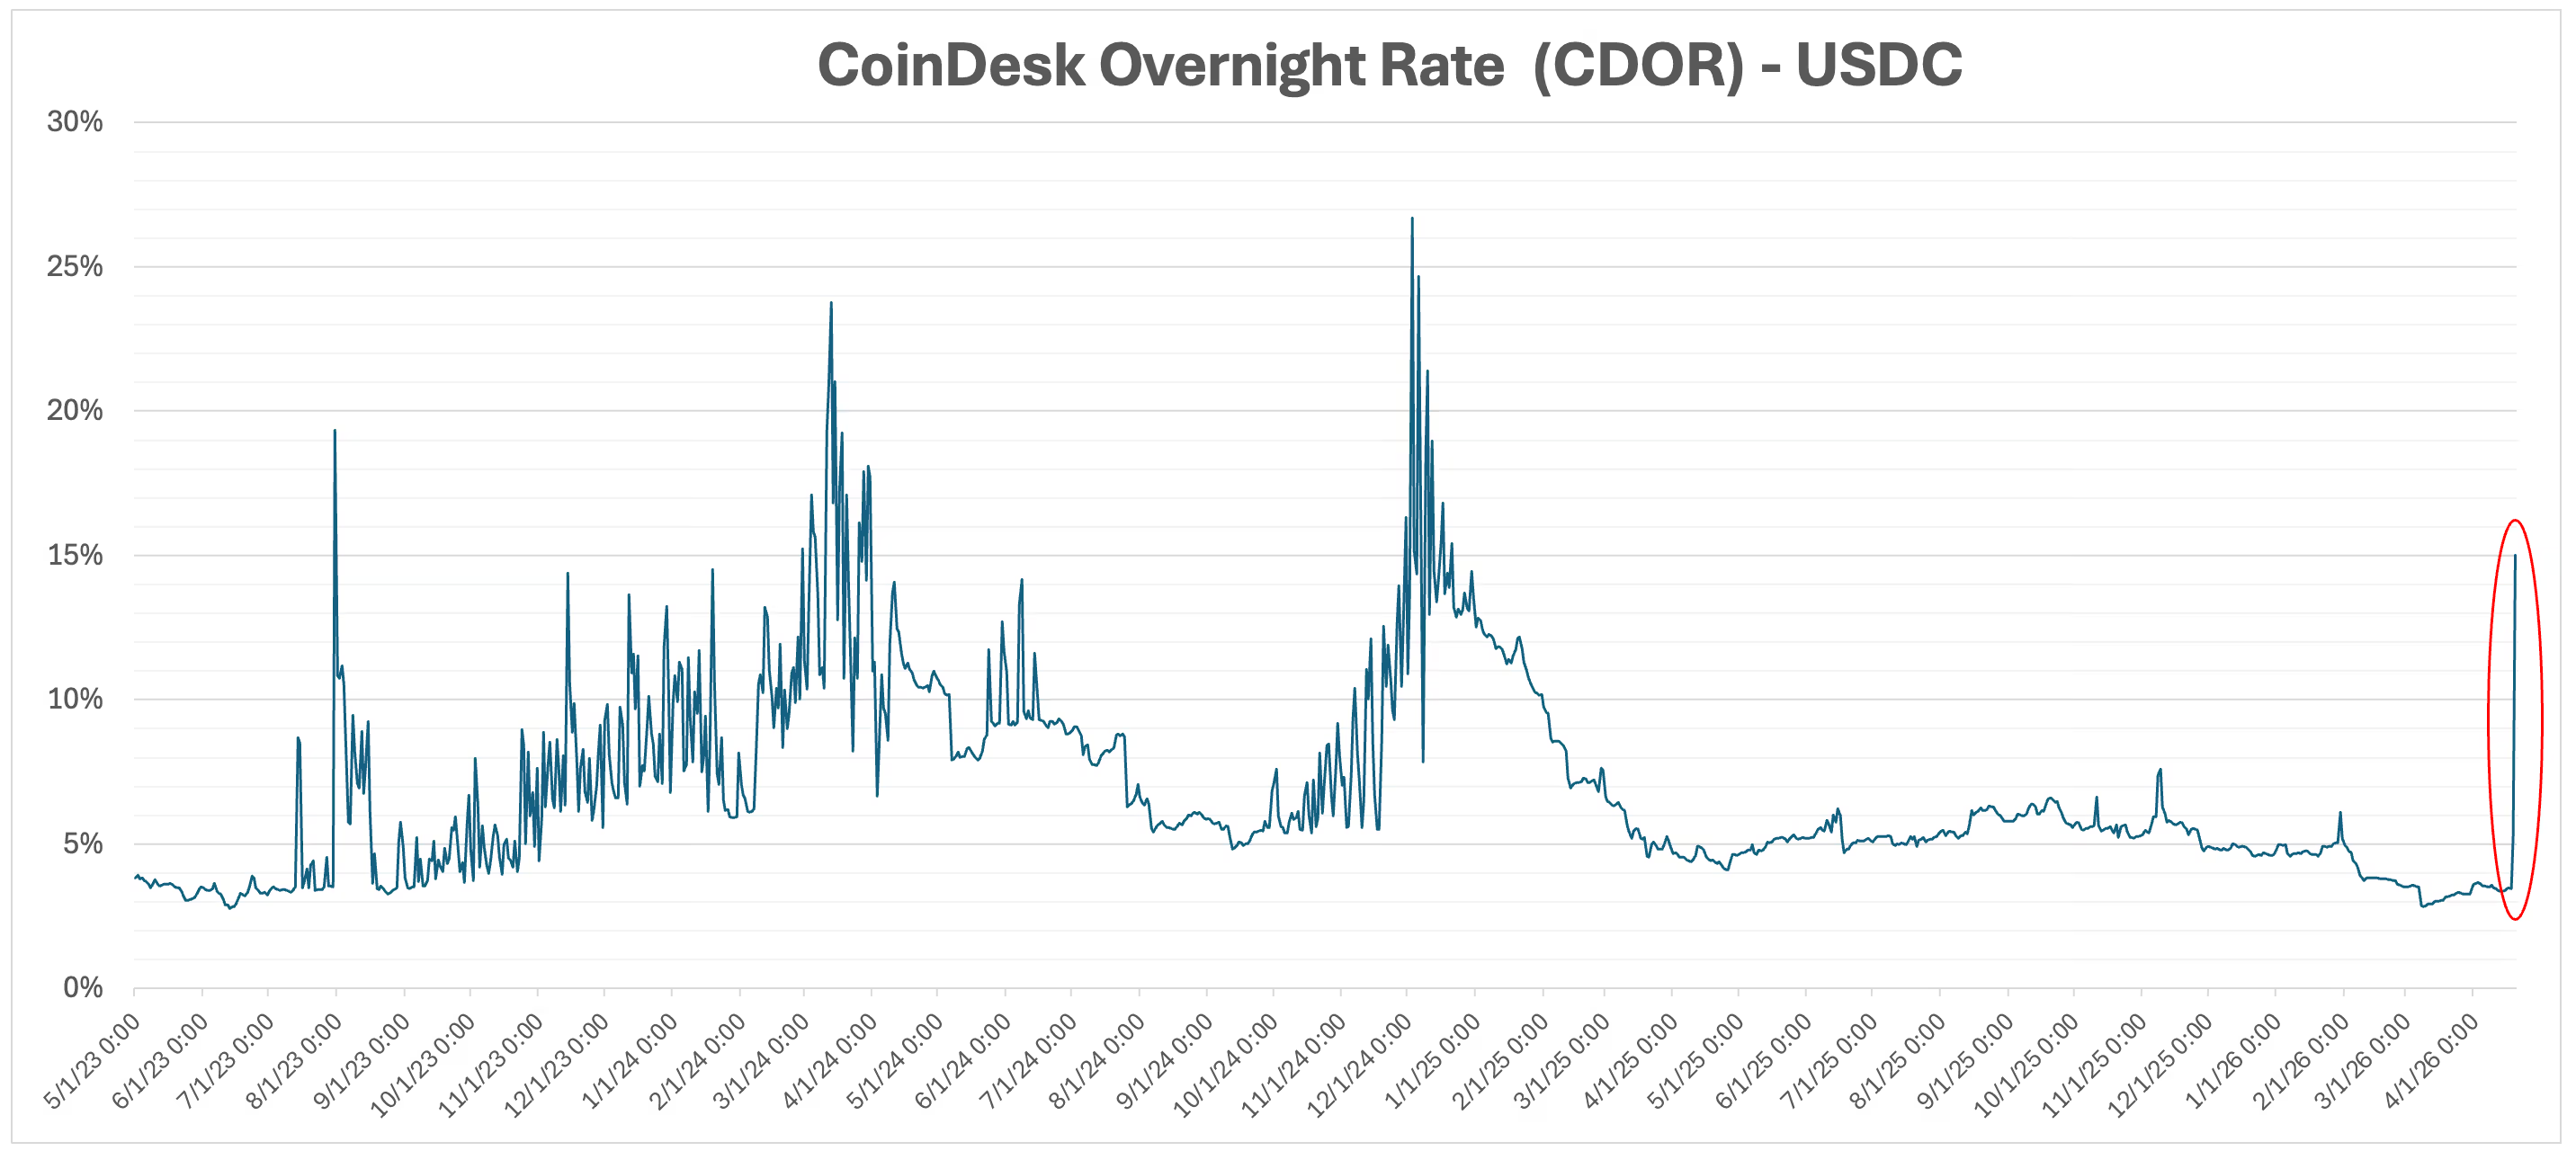
- CoinDesk’s overnight rate (CDOR) for USDC rose to the highest level since 2024, hitting 15%. CDOR measures stablecoin lending & borrowing activity on the Aave platform, which spiked following the weekend’s $290 million exploit on KelpDAO. A high interest rate reflects high demand.

Crypto security programs are rethinking vulnerability disclosure as AI tools flood bug bounty submissions across the industry. While bug bounties reward researchers for responsibly flagging flaws, the surge in AI-assisted reports is both an aid and a challenge—helping teams comb through code faster, but also increasing false positives and noise.
Industry voices say AI-assisted analysis is changing how programs must triage and verify findings, a shift with potential implications for developers, operators, and users of decentralized protocols.
Key takeaways
- AI-enabled tooling is accelerating bug-bounty submissions, expanding both legitimate reports and noise that security teams must sort through.
- Cosmos Labs reports a roughly 900% jump in submission volume, translating to about 20–50 reports per day and a mix of valid findings and false positives.
- Leading researchers note rising low-quality submissions and AI-sourced noise, prompting calls for smarter triage and stricter reporting standards.
- Industry data from HackerOne indicates 85,000 valid bounty submissions in 2025, up 7% from 2024, underscoring growing engagement in bug bounty programs.
AI-driven flood tests bug bounty programs
Co-CEO Barry Plunkett of Cosmos Labs described a dramatic change in how bug bounty programs operate. “Our program has seen a 900% increase in submission volume from last year, on the order of 20–50 per day,” he said, noting that the influx encompasses both credible vulnerability reports and a significant amount of noise. The volume surge has pushed teams to deploy more stringent triage and verification workflows to separate real threats from false alarms.
Across other organizations, developers have reported a similar pattern. Kadan Stadelmann, CTO at Komodo Platform, told Cointelegraph that bug bounty submissions and payouts have risen notably, with a noticeable uptick in low-quality reports and false positives. He suggested that AI-driven tooling may be lowering the cost of producing vulnerability submissions, thereby fueling the higher throughput.
The phenomenon isn’t isolated to crypto software. In January, Daniel Stenberg, the creator of curl—a widely used open-source tool responsible for data transfers in many blockchain infrastructures—announced he would end his personal bug bounty program due to an overwhelming tide of “AI slop in vulnerability reports,” making it exhausting to sift through submissions.
HackerOne, one of the largest bug bounty platforms, also highlighted the broader trend, reporting that 85,000 valid bounty submissions were filed in 2025, up 7% from the previous year. The data underscores how AI-enabled automation is reshaping the volume and pace at which researchers engage with security programs.
AI could be both the cause and the solution
Cosmos Labs has begun adapting in response to the surge by tightening its scoring framework and prioritizing trusted researchers with proven track records. Plunkett said the team is collaborating with other bug bounty providers that offer more advanced triage capabilities, aiming to separate signal from noise more efficiently as volumes rise.
Stadelmann similarly underscored the potential of defensive AI to help teams withstand the deluge. “Blockchain teams will have to create AI deterrents to sift through incoming bug bounties. The smaller the team, the bigger the problem of increased bug bounties will become. Software engineers won’t have the capacity to examine everything,” he cautioned. A defensive AI approach could automatically filter and rank reports, reducing the burden on human reviewers.
“This is where defensive AI systems to automatically sift through incoming bug bounties will be crucial. Teams dependent on bug bounties will need to develop stricter standards on their bug bounty programs as a means of lowering the number of incoming reports.”
Taken together, the episode highlights a central tension in bug bounty ecosystems: AI can amplify vigilance by widening the net for vulnerability discovery, but it can also swamp teams with untenable volumes of reports. The path forward appears to hinge on smarter triage tools, more rigorous reporter verification, and standardized quality controls across platforms.
What this means for developers and ecosystems
Bug bounty programs have long been a cornerstone of security for decentralized networks, offering a carrot for researchers to disclose flaws before attackers can exploit them. The current spike in AI-assisted submissions tests the sustainability of those programs, especially for teams with limited security staff. The emerging consensus among practitioners is that AI will be a necessary ally, but only if paired with robust triage protocols and tighter verification standards.
For builders and operators, the development suggests several practical shifts: invest in AI-enabled triage that can coarsely filter reports, cultivate a trusted researcher network to fast-track credible findings, and align with bounty providers that offer deeper automated review capabilities. These moves can help ensure that the bounty ecosystem remains a reliable line of defense rather than a flood of trivial or erroneous submissions.
As the industry experiments with stronger screening and smarter automation, observers will want to watch for how quickly bug bounty platforms roll out standardized quality controls and how crypto projects adapt incentive structures to maintain high signal-to-noise ratios. The degree to which smaller teams can implement effective defensive AI and whether regulators begin to steer disclosure practices will shape the resilience of crypto security in the near term.
Readers should stay tuned for updates on AI-driven triage innovations, platform policy changes, and real-world outcomes from ongoing vulnerability disclosures across leading DeFi and non-DeFi protocols.
Looking ahead, the balance between rapid vulnerability discovery and manageable review workloads will determine how bug bounty programs influence security in an increasingly automated landscape. The next few quarters could define whether AI remains a force multiplier for defense or becomes a bottleneck that teams must outpace with smarter tooling and stricter reporting standards.
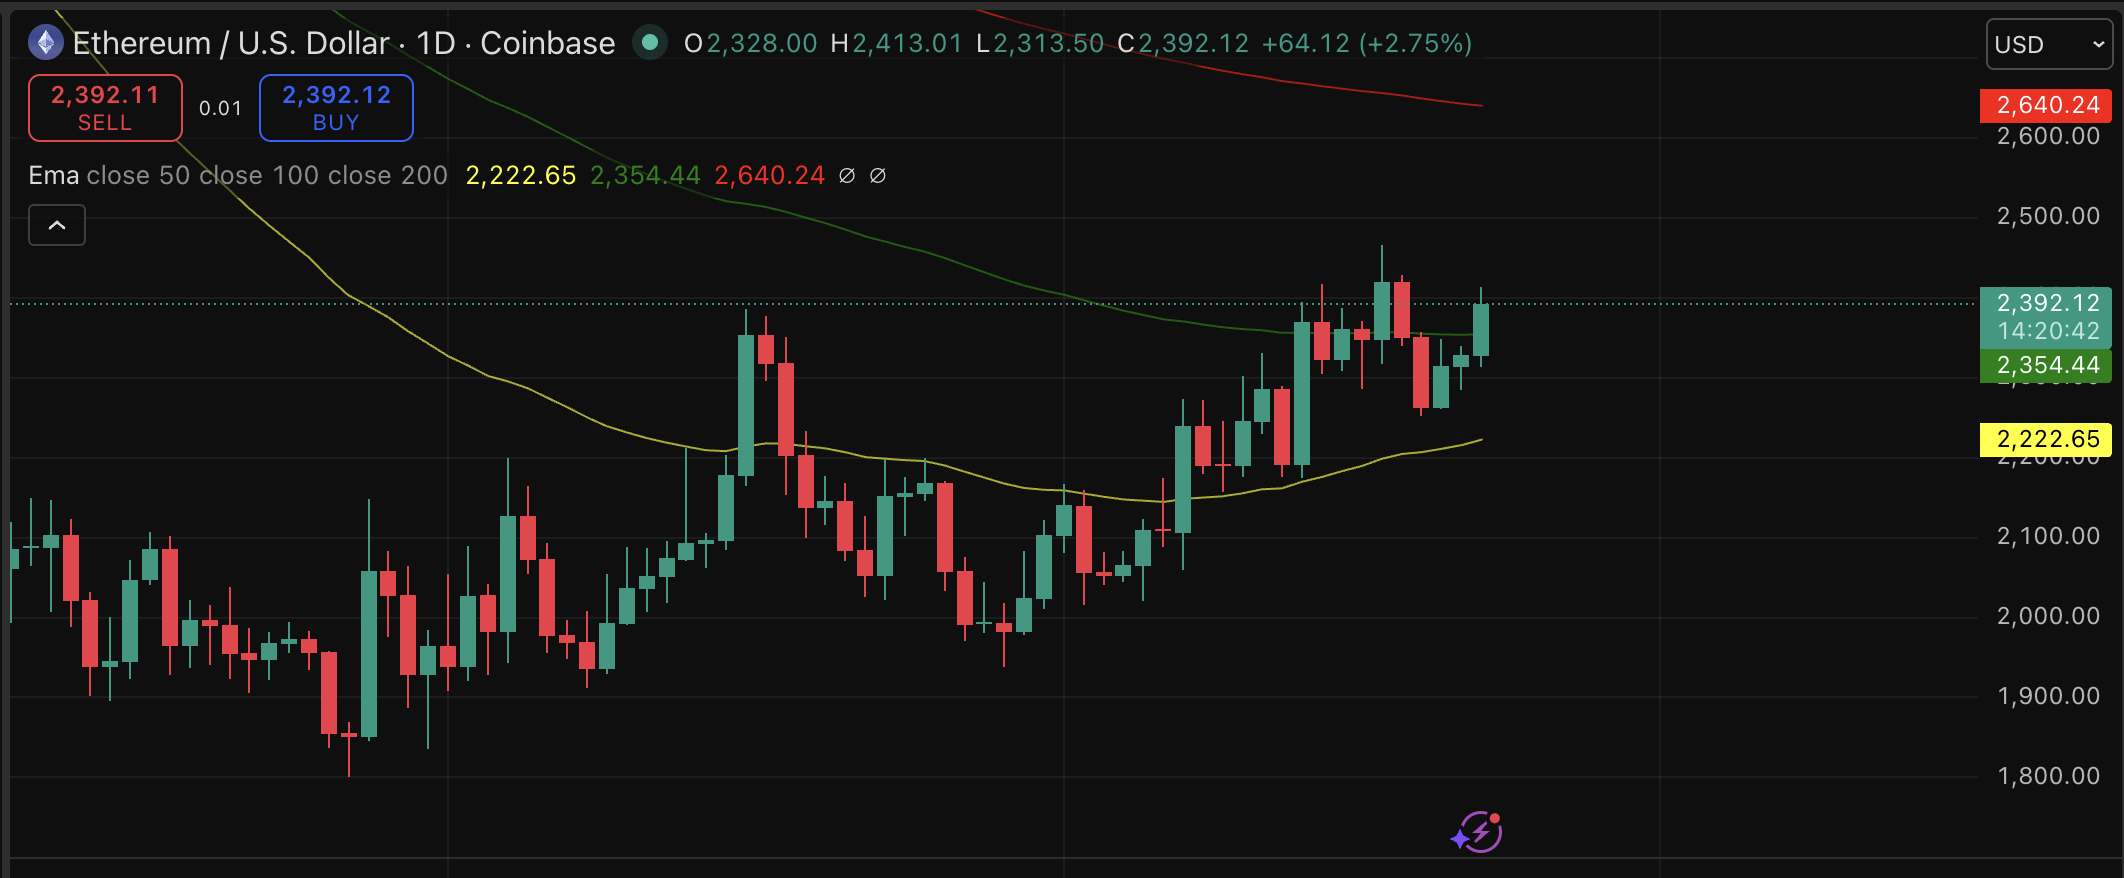
Ethereum price is about to breach $2,400 as an institutional prediction lands with unusual force this week. Etherealize, an institutional Ethereum advocacy group, published a revised long-term price target of $250,000 per ETH, arguing the network is positioned to absorb the combined $31.1 trillion market premium currently held by gold and Bitcoin.
100X move from current levels sounds crazy, but Fundstrat’s Tom Lee independently echoed the same $250,000 “supercycle” figure, citing accelerating institutional accumulation. The thesis: Ethereum’s proof-of-stake yield model and role as DeFi’s primary settlement layer give it structural advantages neither gold nor Bitcoin can replicate.
Short-term technicals, however, tell a complicated story, a gap between macro vision and current price action.
Discover: The best pre-launch token sales
Forget The $250K Ethereum Price Prediction: Can Ethereum Break $2,600
ETH sits just under $2,400, between two forces pulling in opposite directions. The funding rate has turned negative at -0.0033%, a signal that traders are leaning short.
The Crypto Fear & Greed Index reads 32, firmly in fear territory, though getting better than the last 30 days. Bitcoin dominance has climbed back above 60%, compressing altcoin liquidity across the board and creating a supply-demand stagnation that makes clean breakouts difficult to sustain.

The immediate battleground is the $2,200 support level now. Hold it, and a breakout toward $2,500 becomesan easy target. Clear that resistance convincingly, and the next logical destination is $2,800 as a level that, if reclaimed and consolidated, would technically confirm a shift toward a macro-level uptrend.
However, if support at $2,200 breaks. The next meaningful floor appears at $2,000, with a structural correction potentially extending to $1,900 as a consolidation zone. Risk management is not optional here.
The Etherealize report offers no timeline on the $250,000 target, so it’s a price destination, not a trade. What it does provide is a structural argument: 121 million circulating ETH capturing even a fraction of gold’s store-of-value premium implies a repricing event that would dwarf any previous crypto cycle.
Institutional buyers are already moving with BitMine Immersion Technologies, which purchased 32,977 ETH ($104 million) last week alone, bringing its holdings to 4.14 million ETH, or 3.4% of total supply. Conviction capital.
Discover: The best crypto to diversify your portfolio with
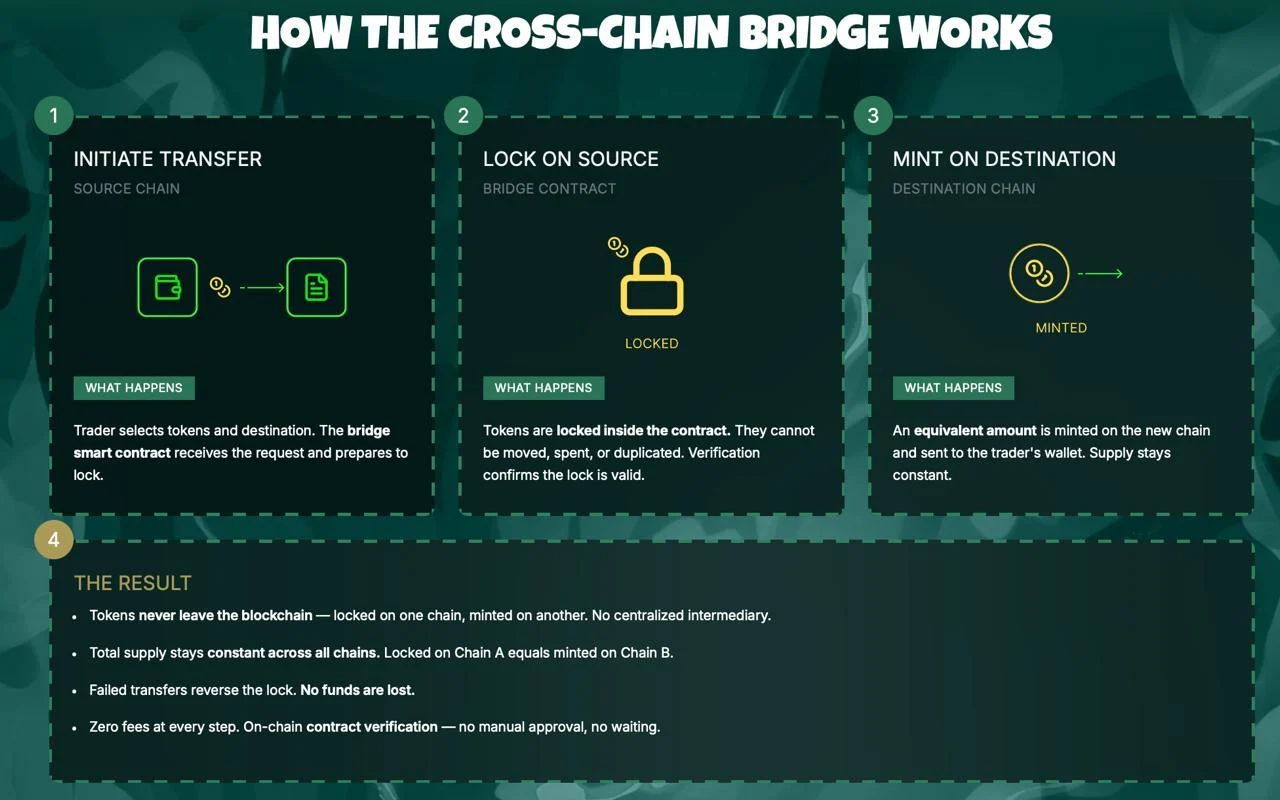
LiquidChain with Big Upside Potential Bridging ETH, SOL, and BTC
Even if the $250,000 thesis is correct for ETH, getting there from $2,300 requires holding through multi-year drawdowns, regulatory headwinds, and multiple altcoin winters.
Ethereum’s institutional narrative is strengthening, but the asymmetric upside that defined early ETH buyers no longer exists, not without big capital. That’s where early-stage infrastructure plays enter the picture.
LiquidChain ($LIQUID) is a Layer 3 infrastructure project built around a specific and underserved problem: fragmented liquidity across Bitcoin, Ethereum, and Solana. Its Unified Liquidity Layer fuses BTC, ETH, and SOL ecosystems into a single execution environment.
The LiquidChain library is home to the entire foundation of the LiquidChain L3. — LiquidChain (@getliquidchain) April 22, 2026
Knowledge this powerful needs to be under lock and key 
 https://t.co/vqvBcdSQYC pic.twitter.com/YHwkivyZcC
With Liquid, developers only need to deploy once and access all three networks simultaneously. Single-Step Execution and Verifiable Settlement are the architectural pillars.
The presale has raised somewhere close to $700K, with $LIQUID currently priced at $0.01452. That’s a early-stage entry point on infrastructure that sits directly beneath the kind of cross-chain capital flows an Ethereum supercycle would generate.
Research LiquidChain thoroughly before the next priceincrease.
The post Ethereum Price Prediction: $250,000 per ETH as Global Finance Backbone appeared first on Cryptonews.

Key Highlights
- Russian lawmakers advance comprehensive digital asset legislation with stringent oversight mechanisms
- Retail investors face significant purchase restrictions while professional traders gain broader access
- Central bank receives authority to license and monitor cryptocurrency market operators
- Digital currencies granted property status while domestic transaction use remains prohibited
- New framework establishes investment thresholds and provides regulatory certainty for crypto participants
Russian legislators have progressed significant cryptocurrency legislation through its initial parliamentary stage, establishing a regulatory framework that incorporates licensing mandates, investment restrictions, and provisions for international transactions. The State Duma approved the draft legislation during its first reading, demonstrating the government’s commitment to establishing formal oversight of digital asset operations within a tightly controlled environment.
Regulatory Authorization Structure and Industry Participation
The proposed legislation establishes a comprehensive authorization system for cryptocurrency business operations under centralized regulatory control. The framework grants the Bank of Russia comprehensive powers to license and monitor all market participants. Consequently, trading platforms, brokerage firms, and custody service providers must satisfy rigorous regulatory criteria before commencing operations.
Russia established an accelerated authorization route for companies currently operating within its pilot regulatory sandbox program. Financial institutions and licensed brokers can access the cryptocurrency sector through this expedited mechanism. This strategy seeks to encourage broader industry involvement while preserving regulatory standards.
The legislation aims to eliminate unlicensed intermediaries through systematic enforcement and licensing protocols. Regulatory bodies will conduct ongoing compliance surveillance and apply sanctions for unauthorized operations. The system emphasizes transparency and responsibility throughout the cryptocurrency marketplace.
Investment Thresholds and Participant Classification
The bill implements a stratified framework that differentiates market participation based on investor qualifications. Retail participants encounter significant restrictions on cryptocurrency acquisitions under the proposed regulations. The current threshold limits purchases to 300,000 rubles, approximately equivalent to $3,900.
Russia permits qualified professional participants to conduct transactions without purchase limitations under the identical framework. This classification strategy attempts to reconcile market accessibility with protective risk management measures. Policymakers structured the system to minimize exposure for participants lacking extensive experience.
Authorities plan to ensure adherence through mandatory disclosure obligations and transaction surveillance infrastructure. These protocols guarantee that all participants function within established boundaries. Consequently, the framework encourages measured expansion while mitigating speculative hazards.
Asset Classification and International Transaction Provisions
The proposed legislation officially designates cryptocurrency as property under Russian law. This categorization provides legal safeguards in conflict resolution, insolvency proceedings, and property settlement matters. Digital assets receive explicit legal recognition within the financial infrastructure.
Domestic cryptocurrency usage for purchasing goods and services remains strictly forbidden under Russian law. The national currency maintains its exclusive status as legal tender throughout the territory. This limitation strengthens monetary policy control while constraining cryptocurrency’s function in routine commercial activities.
The legislation permits cryptocurrency utilization in international commerce under the new regulatory parameters. Businesses may execute cross-border settlements using digital assets subject to regulatory supervision. This authorization addresses external payment obstacles and facilitates international commercial activity.
Russia incorporated regulations governing cryptocurrency mining operations within its regulatory structure. Mining enterprises must utilize domestic facilities and comply with disclosure requirements. Accordingly, the nation seeks to formalize mining activities while retaining oversight of production operations and energy consumption.
The legislation requires subsequent approvals before enactment in Russia. Parliamentary members must complete second and third readings, followed by additional institutional examination. Upon approval, Russia intends to activate the framework effective July 1, 2026.
Crypto World
Cardano, BNB and Pepeto: Comparing Market Value Shows Presales Still Crush Top 10 Coins
Comparing market value Cardano BNB Pepeto after Hoskinson’s April 20 critique of Ripple’s tokenomics and BNB Chain’s $1.02 billion quarterly burn tells a brutal story for large caps. ADA sits at $0.247 and BNB holds $630 but neither can match the returns a presale at six decimal zeros still offers. BNB holders know the pattern.
Meanwhile, one presale is pulling the same kind of heavy capital that defined the BNB ICO in 2017. Pepeto has raised $9.35 million at $0.0000001865 with the Binance listing on the runway, and the wallets entering now are moving the same way BNB ICO buyers did nine years ago.
Cardano Takes a Shot at Ripple and BNB Chain Burns $1.02B Into Hong Kong Week
Cardano founder Charles Hoskinson argued on April 20 that XRP’s tokenomics sell into corporate operations without creating organic buy demand, contrasting that with Cardano’s fee-driven model per CoinMarketCap. ADA trades at $0.247 after the $71 million Hydra and Leios treasury approval, with 735 developer commits logged April 14 and 15.
BNB holds $630 after the April 16 burn destroyed 1.57 million tokens worth $1.02 billion, with BNB Chain running a three-day RWA Demo Day and AWS AI-powered DeFi session in Hong Kong April 19 to 21. Every fundamental firing, yet the chart still caps.
Comparing Market Value Cardano BNB Pepeto Shows Why Presale Wallets Still Win
Pepeto Is the Presale BNB Holders Remember From 2017
Comparing market value Cardano BNB Pepeto gets blunt fast. ADA at $8.7 billion and BNB at $84 billion need enormous fresh capital to clock single multiples. BNB ICO buyers paid $0.15 per token in July 2017 per CoinCodex, and $10,000 into that round became roughly $41.7 million at today’s $630 price and $91 million at the $1,370 peak. That is the presale math large caps cannot replicate once large.
Pepeto carries the same entry structure today. Priced at $0.0000001865 before any exchange opens, built by the cofounder who drove the original Pepe to $7 billion with nothing shipped, only this time with a full exchange already live. PepetoSwap routes every trade fee-free, which matters to small wallets that usually lose a slice across swaps.
Liquidity ports between Ethereum, BNB Chain, and Solana at no transfer cost. A contract risk scanner grades each token before purchase, and SolidProof signed off on every line before the round opened.
Over $9.35 million has flowed in during this fear phase, and staking pays 180% APY compounding daily. A former Binance exec runs listing prep. The 420 trillion fixed supply keeps tokens tight when trading begins. Presales end the way they always end: early wallets collect the gains the late ones watch from the sidelines.
Cardano (ADA) Price at $0.247 With $71M Scaling Spend but No Short-Term Catalyst
Cardano (ADA) trades at $0.247, up 0.80% per CoinGecko, roughly 91% below the 2021 high of $3.09. The governance treasury approved $71 million for Hydra and Leios scaling delivery late 2026, whale wallets above 10 million ADA hit a four-month high, and Protocol 11 hard fork targets a full governance overhaul.
CoinCodex models $0.37 mid-April and Benzinga maps $0.48 to $0.57 on execution. Even the bullish target delivers a 130% move over months, sealing the case on multiples alone.
BNB Price at $630 With $1.02B Burn and Hong Kong Events Confirming Network Adoption
BNB trades at $630, up 0.55% on the day after the 35th quarterly burn removed 1.57 million tokens worth $1.02 billion per CoinMarketCap. BNB Chain averages 4.5 million daily active users in Q1 2026, topping every Layer 1, and the Osaka/Mendel hard fork activates April 28.
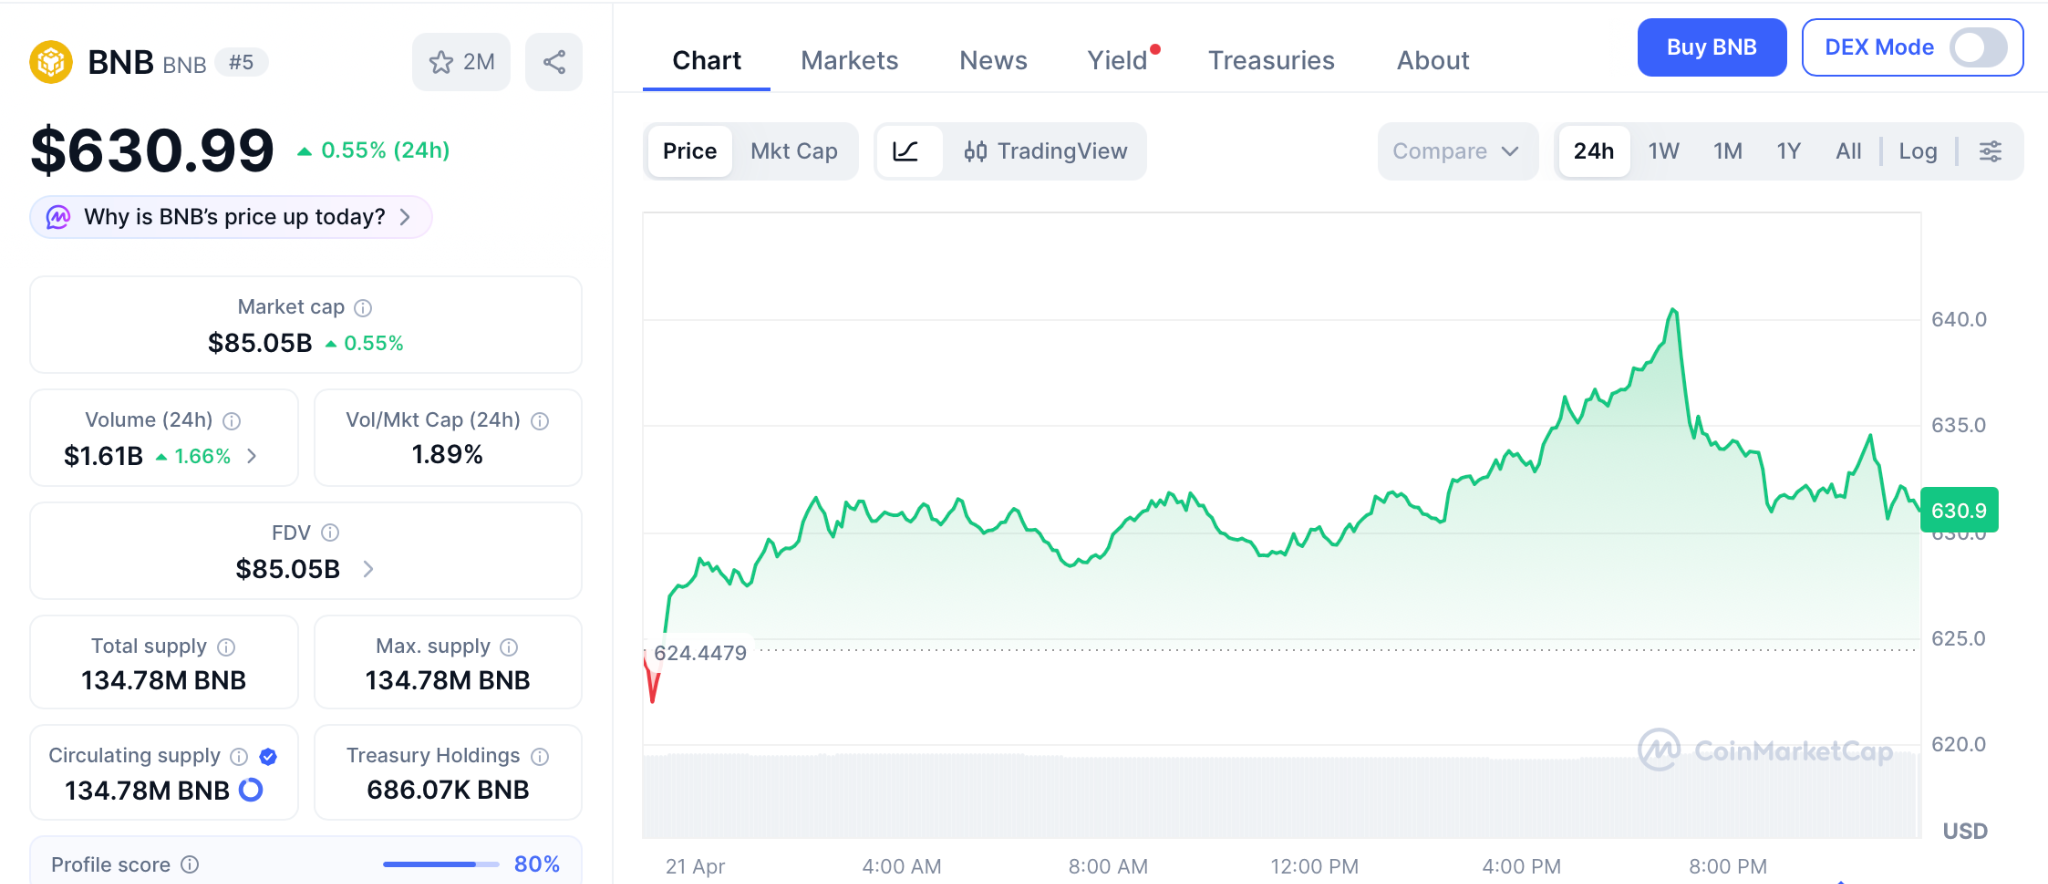
Changelly caps April at $671 and the mid-term path targets $886. A 40% move for a top-five asset is steady, but BNB ICO buyers at $0.15 in 2017 already lived the presale math no $84 billion cap can replay.
The Verdict
Comparing market value Cardano BNB Pepeto confirms ADA at $8.7 billion and BNB at $84 billion can produce recovery gains, but Pepeto sits in a different bracket with a live exchange and presale pricing no top-ten coin can still offer. Every BNB winner started with one choice while the entry was still on the table, and that exact chance is open today from the Pepe cofounder with the Binance listing on the calendar.
The presale at $0.0000001865 is the position that flips on listing day, and when the year wraps, you are either the wallet holding the trade that rewrote your year, or the one sitting across from a mirror asking why you mapped it out, clocked the setup, and stayed on the sidelines.
Click To Visit Pepeto Website To Enter The Presale

FAQs
How does comparing market value Cardano BNB Pepeto explain return potential?
Comparing market value Cardano BNB Pepeto shows ADA at $8.7B and BNB at $84B cap returns, while Pepeto’s presale at $0.0000001865 offers 100x from one Binance listing, matching the BNB ICO trajectory from 2017.
Why is Pepeto called the next BNB presale opportunity?
Pepeto is called the next BNB presale because BNB’s $0.15 ICO in 2017 turned $10,000 into roughly $41.7 million by today, and Pepeto’s $0.0000001865 entry offers the same early-stage math before the Binance listing opens.
Disclaimer: This is a Press Release provided by a third party who is responsible for the content. Please conduct your own research before taking any action based on the content.

BBC faces backlash for using Reform’s branding on the news
IPL 2026: Vaibhav Sooryavanshi has ‘glimpses of Brian Lara’, says legendary cricketer | Cricket News
Amazon Prime Broadcast Fails Completely During Several Minutes Of NBA Playoff Game
Manchester United reach agreement with Casemiro over contract clause amid transfer speculation

Steven Gerrard disagrees with Gary Neville over ‘shock’ Chelsea and Arsenal claim | Football

US brings back mandatory military draft registration
!["Buy Before April 15th" - Matt Hougan's Urgent Warning To All Bitcoin & Crypto Investors [2026]](https://wordupnews.com/wp-content/uploads/2026/04/1776856944_maxresdefault-80x80.jpg)


-

 Fashion5 days ago
Weekend Open Thread: Theodora Dress
-

 Sports5 days ago
NWFL Suspends Two Players Over Post-Match Clash in Ado-Ekiti
-

 Politics5 days ago
Palestine barred from entering Canada for FIFA Congress
-
Entertainment3 days ago
NBA Analyst Charles Barkley Chimes in on Ice Spice McDonald’s Fiasco
-

 Business3 days ago
Powerball Result April 18, 2026: No Jackpot Winner in Powerball Draw: $75 Million Rolls Over
-

 Politics3 days ago
Zack Polanski demands ‘council homes not luxury flats for foreign investors’
-

 Crypto World5 days ago
Russia Pushes Bill to Criminalize Unregistered Crypto Services
-

 Politics2 days ago
Gary Stevenson delivers timely reminder to register to vote as deadline TODAY
-

 Tech3 days ago
Auto Enthusiast Scores Running Tesla Model 3 for Two Grand and Turns It Into Bare-Bones Go-Kart
-

 Tech6 days ago
‘Avatar: Aang, The Last Airbender’ Leaked Online. Some Fans Say Paramount Deserves the Fallout
-
 Business6 days ago
Creo Medical agree sale of its manufacturing operation
-

 Crypto World5 days ago
Russia Introduces Bill To Criminalize Unregistered Crypto Services
-

 Business2 hours ago
Rolls-Royce Voted UK’s Most Iconic Trade Mark as IPO Register Hits 150
-
Crypto World3 days ago
Kelp DAO rsETH Bridge Hack Drains $292M as DeFi Losses Top $600M in Two Weeks
-

 Sports6 days ago
British climbers complete new route in Swiss Alps
-

 Tech6 days ago
Ford EV and tech chief leaving automaker
-

 Sports6 days ago
“Felt Much Better Today”: Josh Hazlewood Opens Up On His Recovery Win Over LSG
-

 Business6 days ago
Cheaper Doritos and Lays helps PepsiCo win back struggling snackers
-
 Entertainment6 days ago
Clavicular Says Streaming May Not Work Without Substances
-

 Entertainment7 days ago
Ruby Rose Accuses Katy Perry Of Sexual Assault, Police React
You must be logged in to post a comment Login