

Crypto World
Fixed Range Volume Profile (FRVP) Explained
The Fixed Range Volume Profile (FRVP) is a technical analysis tool that allows traders to spot where trading volume has concentrated within a chosen price range. It shows the trading volume traded at each price level. Traders read these levels to gauge market participation and to locate potential support and resistance levels. Higher-volume prices tend to mark stronger areas of interest.
The Fixed Range Volume Profile (FRVP) is a popular tool among traders as it provides a wide range of signals. However, its complex appearance can put some traders off. In this article, we’ll take a deep dive into the FRVP, how to use it in a trading strategy, and some common mistakes to avoid.
What Is Fixed Range Volume Profile (FRVP)?

The Fixed Range Volume Profile (FRVP) is an advanced tool that plays an important role in assessing market activity. It provides a comprehensive view of the market by shedding light on trading volume and price data over a specific period. Unlike traditional price-based indicators, the FRVP incorporates volume data, offering a deeper insight into market liquidity and supply and demand dynamics.
Most chart indicators measure market activity against time. The FRVP measures it against price instead. It groups the volume traded at each price level inside a fixed range. This shows where buyers and sellers were most active. Compared with other volume indicators that plot volume bar by bar, the FRVP reveals which prices mattered, not which moments. This makes imbalances between supply and demand more straightforward. A price with heavy volume saw strong participation. A price with light volume saw little.
The FRVP presents a distribution of trading activity, represented by horizontal bars at various price levels, typically from one key swing point to another (e.g. a swing high to a swing low). It shows areas of high and low activity and may help traders spot areas where the market has spent considerable time and where it traded through easily.
Traders anchor the FRVP between two swing points because that range captures one complete move. The profile then reflects only the volume traded during that leg. This keeps the analysis focused, rather than spread across the whole chart. Many traders bracket a trend leg, a range, or a sharp news-driven move. The result is a clearer read of where value built up inside that move.
How Fixed Range Volume Profile Works
So how does the Fixed Range Volume Profile work? The FVRP indicator measures volume at price across a range you define. You pick a start point and an end point on the chart. The indicator then adds up the volume traded at each price level and stacks the totals sideways. The longer the horizontal bar, the more volume changed hands at that price.
In trading, volume measures the total units traded over a given period. It signals how much interest sits behind a price move. High volume points to strong participation and an active market. Low volume points to weaker interest and a more passive one. The Fixed Range Volume Profile indicator takes that idea and ties it to price, not the clock.
This is where volume profile trading differs from standard volume bars. A tall bar shows a price where the market was active. This reflects acceptance, a core idea in auction market theory and price discovery. A short bar shows a price the market passed through fast. Acceptance builds value. Rejection moves price on. Reading the two together shows where business was actually done.
The calculation runs in four steps:
- Select the range. You mark a start and end point, usually a swing high to a swing low.
- Split the range into rows. The tool divides the price range into thin horizontal bands.
- Allocate the volume. It assigns the volume from each bar to the price rows it covers.
- Plot the profile. It draws the totals as a sideways histogram showing volume by price.
The result locks to the move you chose. Scrolling or zooming the chart does not change it.
Components of FRVP
The Fixed Range Volume Profile can be broken down into several key components. Each one marks a different type of price behaviour inside your selected range. Read together, they show where the market built value and where it moved on. These definitions follow standard volume profile methodology used across charting platforms.
Point of Control (POC)
The Point of Control (POC) is the price level with the highest traded volume within the selected range. The POC can be considered as the price level where the market found the most acceptance and is usually plotted as a red line. It is often the most watched level in the whole profile. Traders treat the POC as a balance point. Price tends to return to it over time. That makes the POC a level where support or resistance can form.
Value Area
The Value Area represents the price range where a specified percentage of total volume has occurred, typically 70%. It demonstrates the levels at which most trading activity has transpired. The upper boundary is the Value Area High (VAH). The lower boundary is the Value Area Low (VAL). Traders treat the VAH and VAL as the boundaries of fair value. Price inside the Value Area points to balance. A move beyond either edge can signal the market is seeking new value. Both edges often draw reactions when price tests them.
High Volume Nodes (HVN)
A High Volume Node (HVN) represents a peak in volume at a price level. It marks a price the market accepted and traded heavily. HVNs often act as strong support and resistance, as price tends to slow around them. Several HVNs can sit close together to form a wider zone of interest.
Low Volume Nodes (LVN)
A Low Volume Node (LVN) represents a trough in volume at a price level. It marks a price the market rejected and moved through quickly. Price tends to travel fast across LVNs toward the next HVN. These thin zones often highlight potential breakpoints in a move.
Both nodes play key roles in volume profile analysis. With the POC, they give traders reference points for reading market structure.
FRVP Applications in Market Analysis
Now that we’ve answered, ‘What is the Fixed Range Volume Profile?’, let’s take a look at three ways to incorporate the indicator into a strategy. The tool is rarely used on its own. A sound Fixed Range Volume Profile strategy combines it with price action and risk management. The profile shows where volume sits. Price action confirms how the market reacts there.
If you’d like to see how it works for yourself, you can consider heading over to FXOpen’s TickTrader platform and test the Fixed Range Volume Profile.
Identifying Trend Continuation with FRVP

One of the most common applications of the Fixed Range Volume Profile is its use in gauging market trends. The interaction of price with high and low-volume areas can give valuable insights into market sentiment.
When analysing market trends using the FRVP, traders first pay close attention to areas of low volume, or LVNs. These areas, characterised by limited trading activity, often suggest an imbalance between supply and demand where the market moved rapidly. As such, they create a price gap or vacuum in the profile.
In the markets, these low-volume gaps are likely to be filled over time. An asset’s price usually tends to move quickly through these areas in search of the next area of value, represented by HVNs. As such, LVNs can act as powerful directional indicators, pointing to the potential for swift price movements, either upward or downward, to reach the next HVN, where market acceptance is greater.
This is the core of HVN and LVN trading: price tends to travel from one value area to the next. It moves fast through thin LVN zones and slows at dense HVN ones. In a bullish case, price clears an LVN and runs up toward a higher HVN. In a bearish case, it drops through an LVN toward a lower HVN. Traders watching for trend continuation often note a few things:
- Where the nearest LVN sits relative to current price
- Which HVN is the likely target once the LVN is crossed
- Whether the wider trend agrees with that direction
- How price behaves on the first test of the HVN
HVNs and LVNs as Support and Resistance Zones
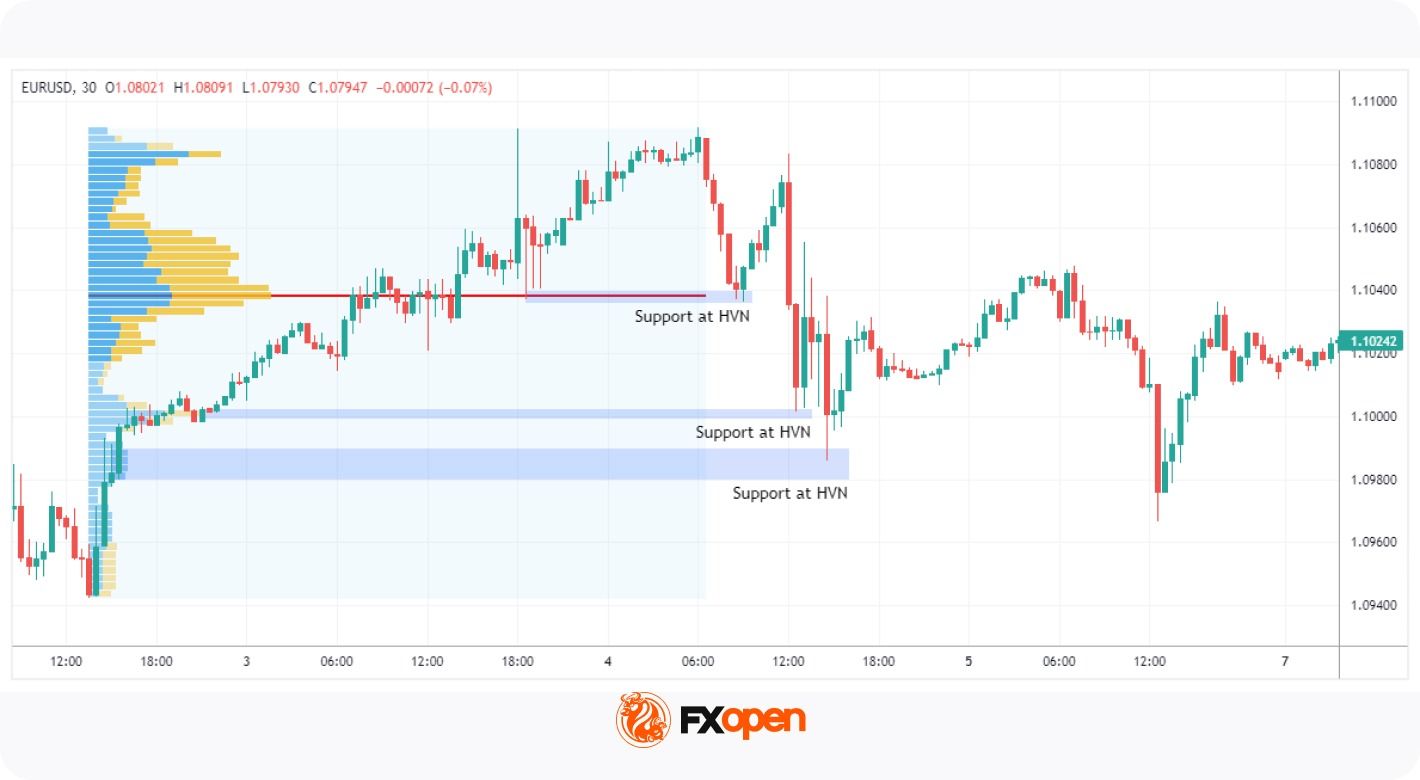
The FRVP can be an invaluable tool in identifying support and resistance levels. HVNs often indicate levels of strong support or resistance as they reflect periods where a significant amount of trading has occurred. These are areas where the market has shown acceptance, often making them difficult to breach.
Conversely, LVNs, with their relatively lower trading activity, often highlight potential breakpoints. Because these are levels at which the market has shown rejection. They are less likely to act as strong support or resistance areas, and the price is more likely to pass through them more quickly.
The split comes down to acceptance versus rejection. Where the market accepted price, volume built up and a zone holds. Where it rejected price, volume stayed thin and the zone gives way. Using the Fixed Range Volume Profile for support and resistance rests on reading that difference. The table below summarises how the two nodes tend to behave.
Therefore, traders can use HVNs and LVNs as a basis to establish potential entry and exit points in their trading strategies. For example, a trader may consider entering a long position when the price breaks above an HVN (an area of resistance). Similarly, an LVN above the current price might be a good target for this long trade, as the price could rise quickly to this level.
Point of Control (POC) in Market Analysis
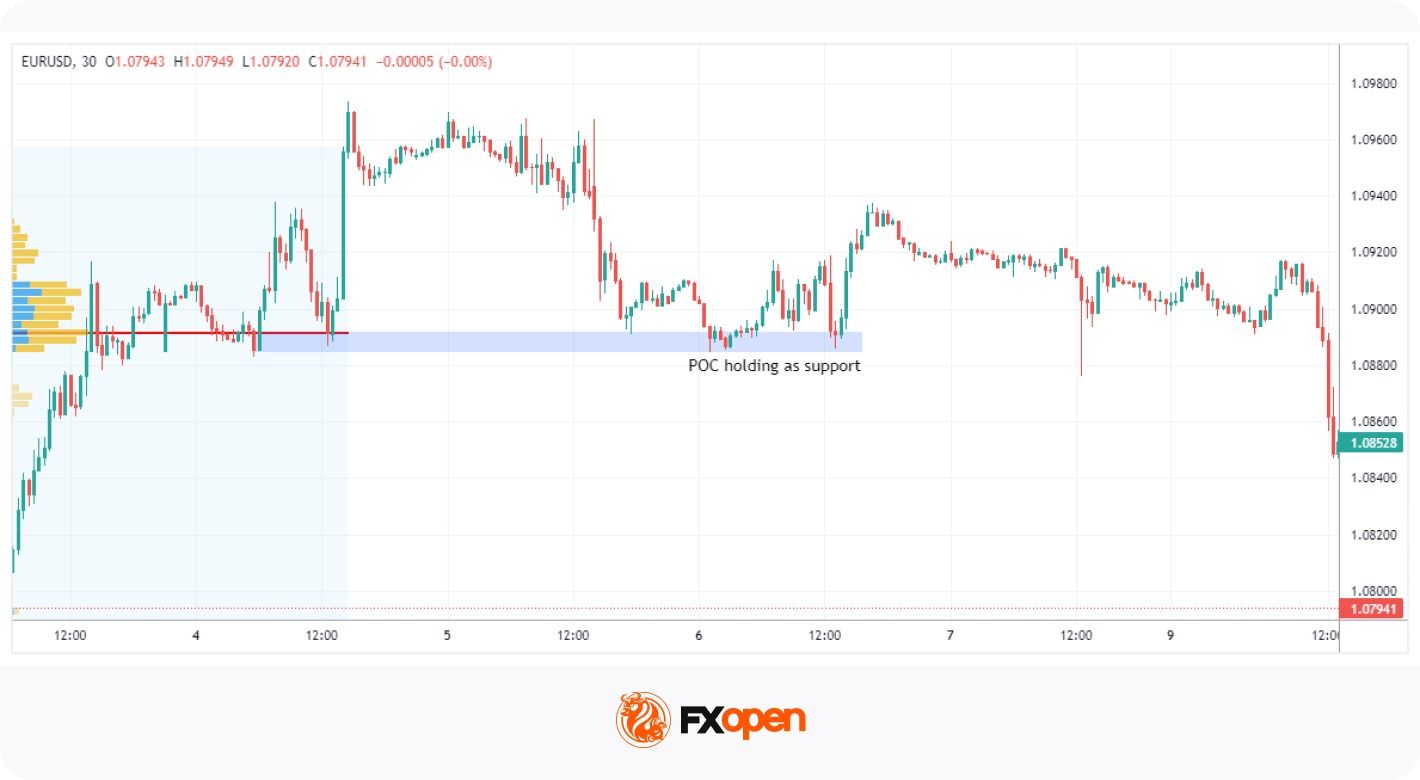
In addition to HVNs and LVNs, the Point of Control (POC) is another widely used element within the Fixed Range Volume Profile. Price often revisits the POC because it marks the range’s balance point. It is where the most business was done, so the market treats it as fair value.
In an upward-trending market, the POC often acts as a support level, where buyers may enter or add to long positions, expecting the price to bounce back upwards. Conversely, in a downward-trending market, the POC can serve as a resistance level, where sellers might consider short positions, anticipating market rejection.
In a broader Fixed Range Volume Profile strategy, traders often look at:
- Whether price stalls or pushes straight through the POC
- How volume behaves as price returns to the level
- Where the POC sits against the wider price action
Fixed Range Volume Profile vs Session Volume Profile vs Visible Range
The Fixed Range Volume Profile is one of three common volume profile types. The other two are the Session Volume Profile and the Visible Range Volume Profile (VRVP). All three plot volumes by price. They differ in how the range is set.
The Fixed Range Volume Profile vs Session Profile vs Visible Range Volume Profile question comes down to control. With FRVP, you pick the start and end points by hand. The profile then stays locked to that move. The Session Volume Profile sets its own range. It resets automatically at the open of each trading session. The Visible Range Volume Profile uses whatever bars are on screen. It redraws as you scroll or zoom.
Traders pick the tool to match the question. FRVP is used for a completed move traders want to study closely. The Session Volume Profile is popular for intraday work, where each day’s value matters. The Visible Range Volume Profile is applied for a fast read of the wider chart. Many traders run more than one together. A fixed range over a key leg, paired with the current session, can give context that neither offers alone.
Selecting the Range for FRVP Analysis
The range you choose shapes everything the FRVP shows you. The same chart can produce different profiles depending on where you start and finish. So the choice of range is the important decision when using the tool. A well-chosen range captures one clean phase of market activity. A poorly chosen one mixes unrelated moves and blurs the read.
Most traders anchor the profile between two clear points. A swing high to a swing low is the common choice, as it brackets a single move. This ties the profile to a defined piece of market structure rather than an arbitrary stretch of chart.
Several range types tend to suit the tool:
- Trend legs: a single push from one swing point to the next, to see where volume built during the move.
- Consolidations: a sideways range or period of consolidation, to find the levels the market kept returning to.
- News-driven moves: a sharp reaction to an event, to map where volume settled once the move calmed.
- Swing ranges: a full swing from high to low, often used alongside a swing trading approach.
Because the output depends on the input, two traders can read the same chart differently. One brackets the whole trend. Another brackets only the latest leg. Both profiles are valid, but they answer different questions. Many traders test a few ranges over the same area. They look for levels that hold up across more than one selection, since those tend to carry more weight.
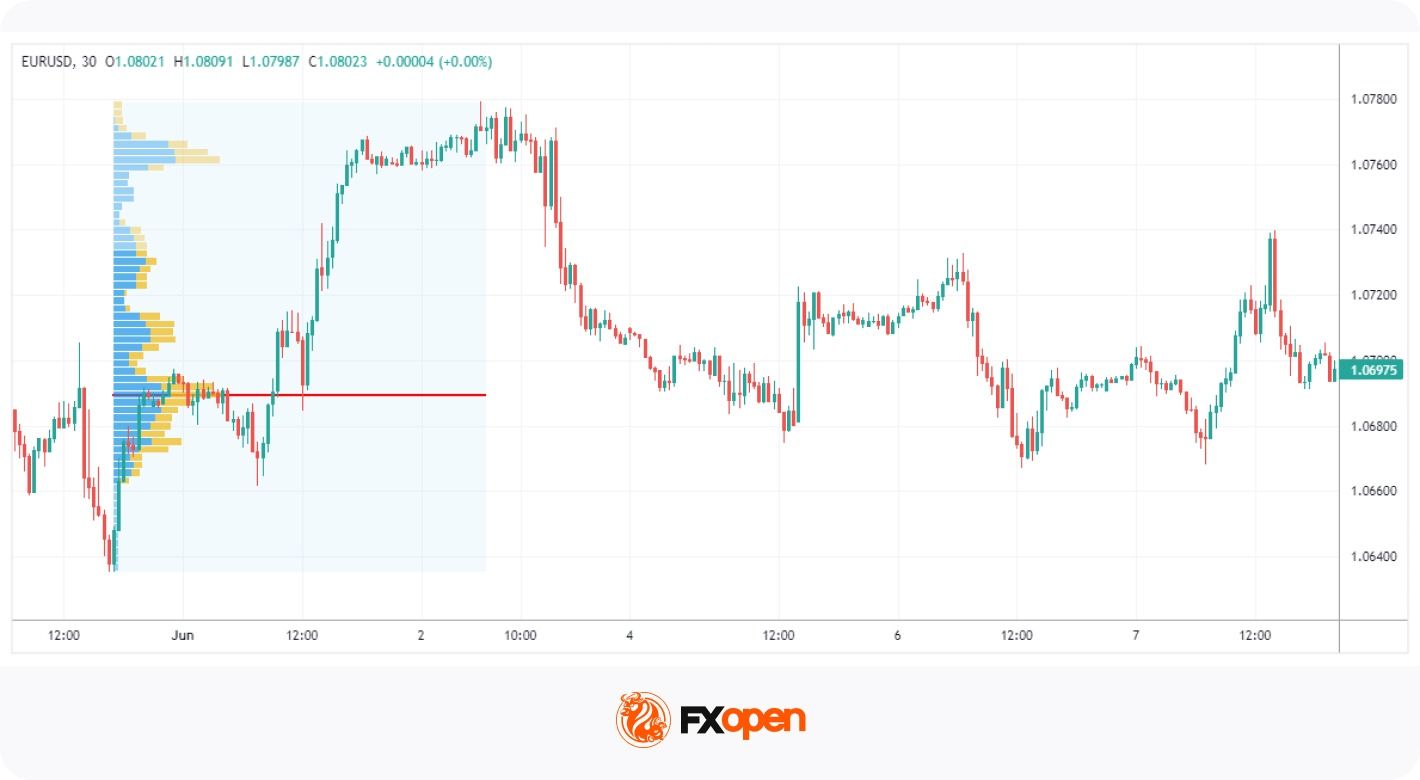
FRVP Example: Analysing a Market Range
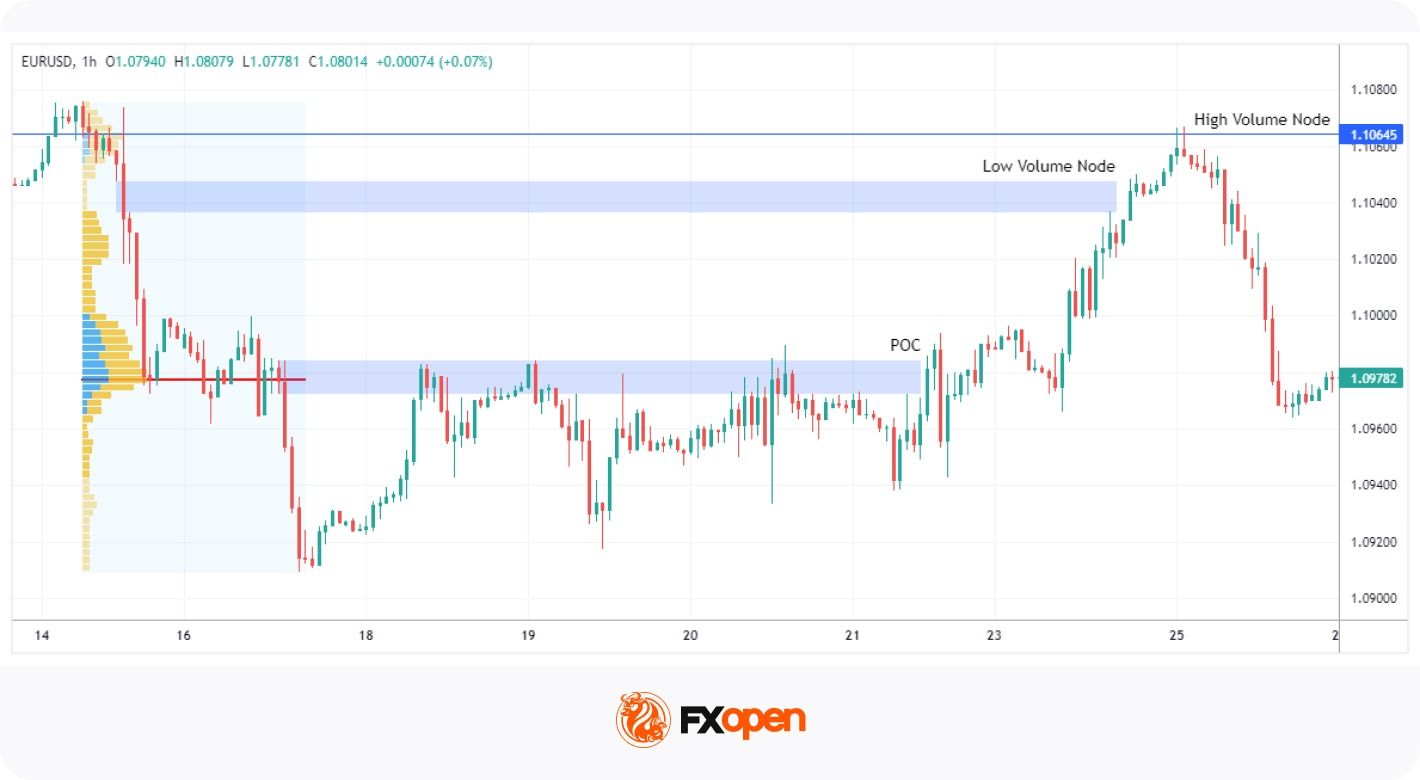
In this example, we see the market cooling off after a prolonged uptrend to the left (finishing just on the edge of the chart). The price fell sharply, finding a bottom. Given the distinct high and low points, the FRVP tool is set to those two points. The walkthrough below breaks the move into five steps.
- Set the range. With clear high and low points in place, the profile is anchored from the swing high to the swing low. This brackets the full move for analysis.
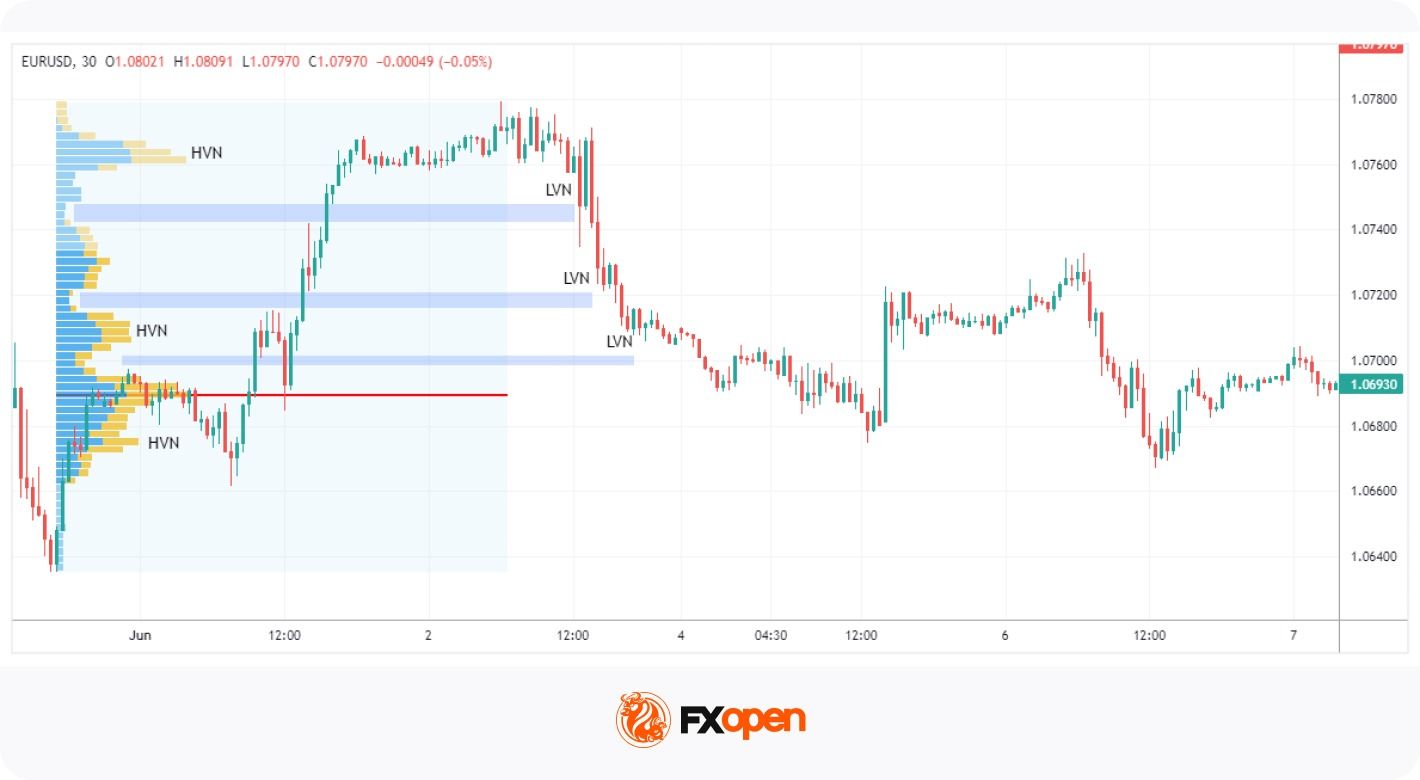
- Read the POC. The first area to notice is the POC, which acted as strong resistance within the multi-day range. Traders could have anticipated this area to hold, using other forms of technical analysis to find entries on a lower timeframe.
- Mark the LVN target. The POC area was eventually pierced through, indicating that it may be time for the price to come and meet the LVN toward the top of the range. This level represented the area with the lowest volume in the entire range. Combined with the prior bullishness offscreen, traders could have been confident that the price would at least reach this area, acting as a solid target if they had bought earlier near the POC.
- Watch the HVN reaction. However, it moved higher to tap the HVN (blue line). Notice that it’s the area with the highest volume besides the POC. After reaching the HVN, the price quickly reversed.
- Confirm the turn. Similar to the POC, traders could have anticipated bearishness from this area. The shooting star pattern here acted as confirmation.
Common FRVP Mistakes
So what are the common mistakes many traders make when using the Fixed Range Volume Profile indicator? The list below covers the ones that catch traders out most often.
- Misreading volume nodes: Traders may assume all HVNs or LVNs carry equal weight. Their importance shifts with the broader market context, so strong bullishness can see an HVN traded straight through.
- Ignoring other indicators: Relying on the FRVP alone makes for a one-dimensional approach. A sound strategy pairs it with tools that confirm reversals, like the Relative Strength Index (RSI) or MACD.
- Over-relying on historical data: The FRVP maps past activity, not future moves. Fundamental drivers still matter and belong in the analysis.
- Selecting the wrong range: A poorly chosen range mixes unrelated moves and distorts the profile. The levels it produces then carry little meaning.
- Ignoring higher timeframes: A profile read in isolation can clash with the wider trend. Checking a higher timeframe gives needed context.
- Treating nodes as exact prices: HVNs and LVNs mark zones, not precise lines. Expecting prices to turn at a single level often disappoints.
- Skipping risk management: Using the FRVP without risk management leaves a strategy exposed when a level fails to hold.
Advantages and Limitations of FRVP
Like any tool, the FRVP indicator has clear strengths and real limits. Knowing both may help traders use it in the right place. It reads volume well, but it does not act as a standalone system.
On the plus side, the volume profile indicator shows where genuine activity occurred, not just when. It ties volume directly to price, which standard volume bars cannot do. It also locks to a chosen move, so the analysis stays focused. That makes it useful for marking support, resistance and likely target zones.
The limits matter just as much. The FRVP reflects past activity, so it offers no guarantee about future moves. Its output depends entirely on the range you select, which adds a layer of judgement. On forex charts, the volume shown is often tick volume rather than true traded volume. And the tool is always combined with other forms of analysis.
Key Takeaways
The Fixed Range Volume Profile may help traders analyse where trading activity was concentrated within a selected price range. By highlighting key areas such as the Point of Control, Value Area, High Volume Nodes, and Low Volume Nodes, it provides additional context on where the market found acceptance or rejection.
Like any technical tool, the FRVP is commonly used alongside price action analysis, market structure, and risk management. Since the profile’s output depends heavily on the range selected, traders typically take care to choose ranges that reflect meaningful market swings or trading sessions.
With an understanding of how to use the FRVP indicator, you might consider opening a trading account with FXOpen to access over 700 markets across forex and CFDs.
FAQ
What Is Fixed Range Volume Profile (FRVP)?
Fixed Range Volume Profile (FRVP) is a volume analysis tool that displays how much trading activity occurred at different price levels within a user-defined range. Instead of focusing on volume over time, it organises volume by price, which may help traders identify areas where the market spent the most and least effort transacting.
What Does the Point of Control Mean in FRVP?
The Point of Control (POC) is the price level that recorded the highest trading volume within the selected range. Traders often monitor the POC because it can represent a key area of market acceptance, where buyers and sellers were most active, and where price may later find support, resistance, or balance.
What Are HVNs and LVNs?
High Volume Nodes (HVNs) are price levels where a large amount of trading occurred, often indicating areas of market acceptance and potential support or resistance. Low Volume Nodes (LVNs) are levels with relatively little trading activity and may represent zones of rejection where price can move through more quickly.
How Is FRVP Different From Session Volume Profile?
The main difference is that FRVP analyses a manually selected price range, allowing traders to focus on specific market swings, consolidations, or trends. Session Volume Profile, by contrast, automatically calculates volume distribution for predefined trading sessions without requiring manual range selection.
Can FRVP Identify Support and Resistance Levels?
Many traders use FRVP to identify potential support and resistance areas. High Volume Nodes and the Point of Control often highlight prices where significant trading activity occurred, which can attract future market interest. However, these levels are not guaranteed to hold and are typically assessed alongside other forms of technical analysis.
What Is the Value Area in a Volume Profile?
The Value Area is the range of prices that contains approximately 70% of the total traded volume within the selected profile. It is bounded by the Value Area High (VAH) and Value Area Low (VAL). Traders often use these levels to assess whether price is trading in an area of perceived value or moving beyond it.
Which Markets Can FRVP Be Used On?
FRVP can be applied to a wide range of markets, including forex and CFDs. The tool is particularly popular among traders who analyse market structure and volume distribution, as it may help highlight areas where significant trading activity has taken place.
This article represents the opinion of the Companies operating under the FXOpen brand only. It is not to be construed as an offer, solicitation, or recommendation with respect to products and services provided by the Companies operating under the FXOpen brand, nor is it to be considered financial advice.

A viral post claiming a $1,499 desktop could break Nvidia’s AI empire is racing across X.
The market is not waiting to judge it. Money is already leaving Nvidia stock. And that money could be flowing into AMD, at least for now.
A $1,499 Box and a Big Claim?
The post comes from an account called reputable researcher Bull Theory and landed on June 16.
AMD may have just broken Nvidia’s most profitable business, the renting out of AI compute in the cloud. At CES in January, AMD chief Lisa Su held up a mini PC near that price. It runs large AI models on a desk, with no cloud and no rented GPU.
Want more insights like this? Sign up for Editor Harsh Notariya’s Daily Newsletter here.
The thread frames the math as brutal for Nvidia. It cites a consultant who swapped a $2,800 monthly cloud bill for a few dollars of electricity.
Every firm that buys the box, the post argues, stops paying for cloud AI for good. Lawyers, banks, and doctors with private data are the customers it expects to switch first.

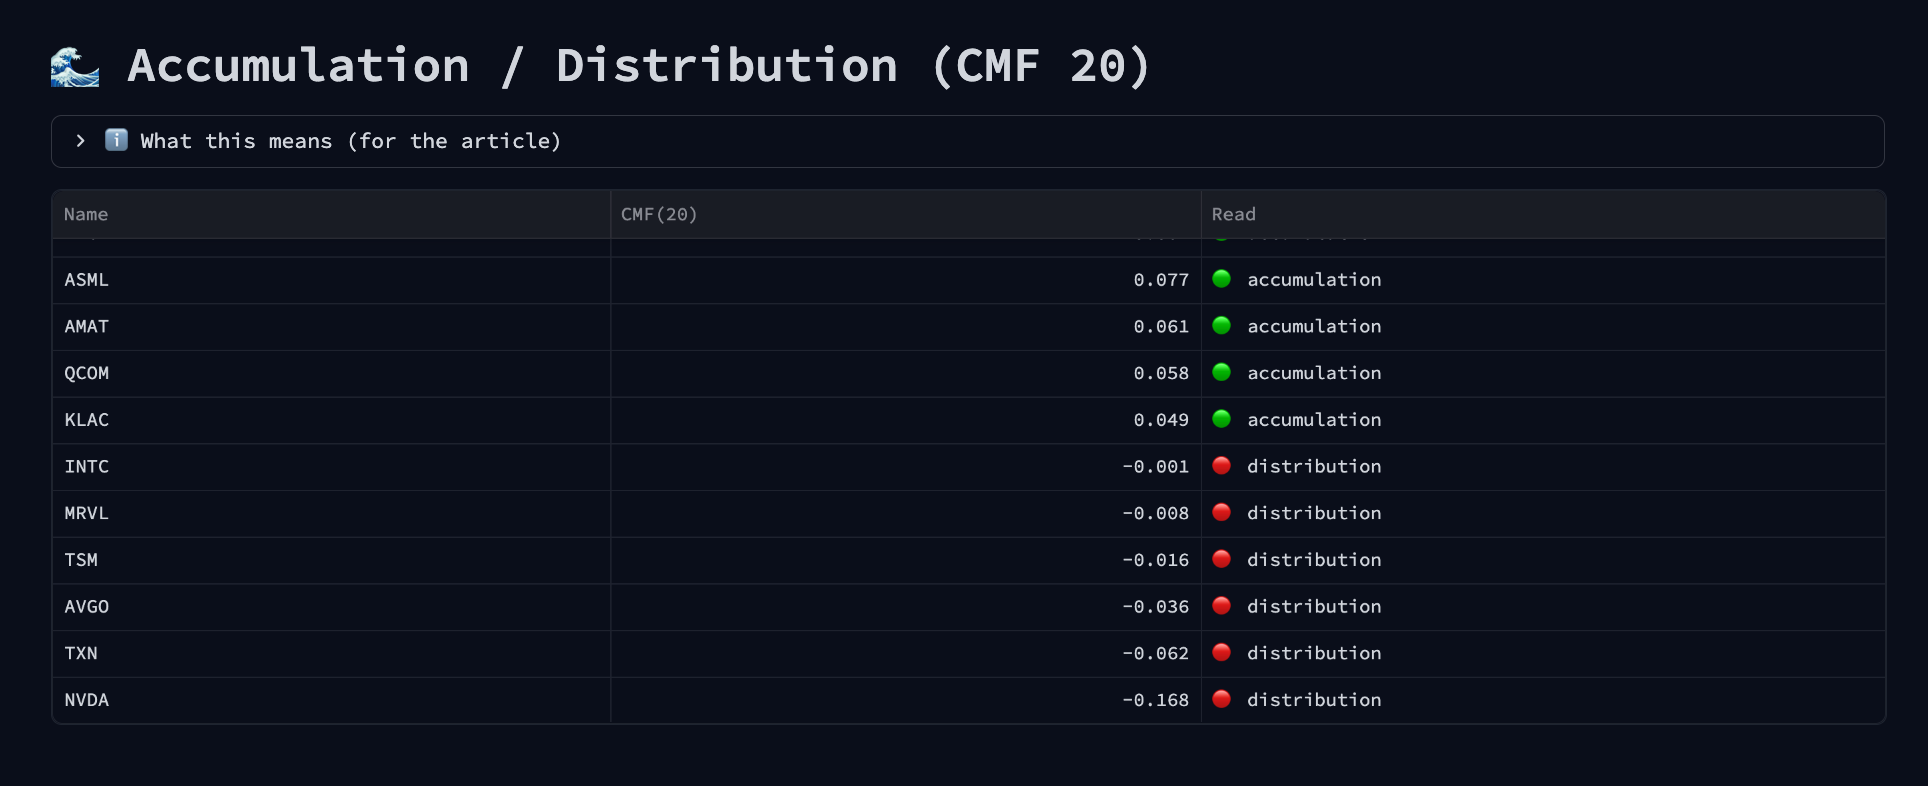
Not surprising to see that the Nvidia stock is already seeing the deepest bit of institutional capital erosion, as highlighted by the negative CMF counter. More on that later in this piece.
The Threat to NVDA Is Bigger Than One Box
The slogan oversells one box, but the trend behind it is real. The bigger threat is not on a desk; it is inside the cloud.
Nvidia’s largest customers are now building their own AI chips to lean on it less. Google has committed up to one million of its chips to Anthropic and is in talks to supply Meta.
Amazon runs its own custom silicon across its cloud at scale. Those in-house chips already make up about 28% of AI server shipments, up from roughly a fifth a year ago.
The cheaper hardware is real too. AMD’s Ryzen AI Halo box opened pre-orders this month at $3,999, below Nvidia’s competing DGX Spark at $4,699. Both trends attack the same thing, the demand for Nvidia’s chips, which is where its revenue comes from.
Nvidia still holds about 70% of the AI chip market, so this is erosion, not collapse. But for the first time, its own customers and a cheaper rival are routing around it.
The Money Has Already Picked a Side, and Its Not Nvidia
The thesis is loud, but the quieter signal is the telling one. The money is already moving. Chaikin Money Flow tracks whether cash is entering or leaving a stock. On Nvidia it has turned firmly negative at -0.168, the weakest reading of any major chip name.

AMD sits at the opposite end, with a positive +0.209, seeing one of the strongest accumulations in the AI chip group.

The trend agrees. Against the SOXX semiconductor index, Nvidia scores just 58.5 on relative strength, while AMD scores 123.
The company that defined AI compute is trailing its own sector, while the rival it once dwarfed leads it.
Nvidia Traders Are Leaning the Same Way
Positioning has turned with the story. In the options market, the Nvidia put/call ratio by volume has risen to about 0.63. Just a day earlier, it sat at a call-heavy 0.49. A rising ratio means puts are gaining on calls, a tilt toward downside hedging.The put-call ratio is still call-heavy but several bearish positions showed up post the viral mini PC post on June 16.

Crypto traders lean in the same direction. On Nansen, the smart money holds its largest chip short against Nvidia, ahead of every peer. The options desk and the perpetual market rarely agree.

Right now, both point away from the Nvidia stock as the money has already picked a side. Despite that, NVDA still manages to keep a near 10% year-to-date uptick, trading around $207 at press time.
The post Nvidia Stock’s Biggest Threat Now Costs $1,499 and Fits on a Desk? appeared first on BeInCrypto.


Prediction market platform Kalshi has partnered with StarCompliance to give financial institutions real-time visibility into employee trading activity as it expands efforts to address insider trading concerns and attract institutional participants.
Summary
- Kalshi has partnered with StarCompliance to give financial firms real time monitoring of employee prediction market trades.
- Employees at participating firms will be required to link their Kalshi accounts, allowing compliance teams to flag suspicious activity.
- The agreement follows Kalshi’s recent compliance push, which included employer disclosures, market risk reviews, and more than 100 blocked insider trading attempts in Q1 2026.
According to a Barron’s report, employees at firms using StarCompliance will be able to link their Kalshi accounts to compliance systems that monitor trades and flag potentially suspicious activity.
The arrangement allows employers to oversee prediction market participation in much the same way they already supervise employee trading in stocks and derivatives.
The partnership comes days after Kalshi introduced new compliance controls across its platform, including employer disclosure requirements for traders participating in markets considered more vulnerable to insider trading.
Earlier this month, the company said it had conducted more than 150 investigations, blocked over 100 suspected insider-trading attempts, and referred 20 cases to law enforcement during the first quarter of 2026.
According to the companies, financial institutions face new risks as prediction markets become more popular because employees may attempt to profit from material nonpublic information through event-based contracts.
StarCompliance said its software will help firms monitor activity on Kalshi and enforce internal compliance policies.
Explaining how the system works, Kelvin Dickenson, chief product officer at StarCompliance, said firms can permit employee participation while requiring account disclosure.
Dickenson said the framework allows employers to tell staff, “You can engage in this activity, but in order to engage in this activity you have to disclose your accounts to me.”
For now, the arrangement focuses on monitoring transactions after accounts are connected. Dickenson told Barron’s that additional controls could be introduced later if clients request them, including requirements for employees to obtain approval before placing prediction market trades.
Compliance measures expand as institutional interest grows
Recent moves suggest Kalshi is putting compliance infrastructure at the center of its push into traditional finance.
Speaking to Barron’s, Max Crowley, vice president of business development at Kalshi, said the company is “obsessed with compliance” and described strong monitoring systems as a basic requirement for working with major financial institutions.
Crowley said the StarCompliance integration emerged after discussions with a large New York hedge fund that wanted to hedge risk through a Kalshi institutional account but could not participate because the platform lacked a StarCompliance connection.
Recalling the conversation, Crowley said the fund’s response was, “You don’t have an integration with StarCompliance.”
The latest announcement follows several steps Kalshi has taken to strengthen oversight. Alongside employer disclosures for higher-risk markets, the company recently launched a whistleblower reporting channel and introduced a risk-scoring process for every proposed market before listing.
Pressure on prediction markets has intensified following a series of alleged insider-trading cases across the sector.
Earlier this month, NPR reported that the U.S. Department of Justice and the Commodity Futures Trading Commission were investigating former U.S. Representative George Santos after Kalshi detected suspicious trading tied to a market involving President Donald Trump’s State of the Union address.
The company froze the account and referred the matter to authorities, according to NPR.
Federal prosecutors have also pursued separate cases involving trading activity on prediction market platform Polymarket.
One case involved a U.S. Army Special Forces soldier accused of using classified information to place trades related to former Venezuelan President Nicolás Maduro, while another involved a Google software engineer accused of using confidential company information to trade Google-related contracts.

For years, the crypto industry has been driven by narratives.
From ICOs and DeFi Summer to NFTs, GameFi, the Metaverse, AI tokens, and memecoins, markets have repeatedly chased stories that promised future growth. Capital flowed toward attention, speculation, and potential rather than measurable business performance.
But the industry is evolving.
As crypto matures, a new narrative is emerging—one that may prove more durable than any trend cycle before it:
Revenue is the new narrative.
The Shift From Hype to Fundamentals
In traditional finance, companies are often evaluated based on revenue, profitability, cash flow, and long-term sustainability. Crypto, however, spent much of its early history prioritizing network growth, token distribution, and community expansion over actual economic output.
This approach made sense during the industry’s formative years. Protocols needed users, developers, liquidity, and network effects before they could focus on monetization.
Today, many blockchain networks have achieved scale. The question investors are increasingly asking is no longer:
“How many users does this protocol have?”
Instead, they are asking:
“How much value does this protocol generate?”
This subtle shift represents one of the most important transitions in digital asset markets.
Why Revenue Matters
Revenue demonstrates that a product solves a real problem for real users.
When individuals or institutions repeatedly pay fees to use a protocol, it creates tangible economic activity rather than speculative demand alone.
Revenue-generating protocols often possess:
- Sustainable business models
- Strong product-market fit
- Loyal user bases
- Defensible network effects
- Long-term growth potential
While revenue does not guarantee success, it provides a measurable signal that users find value in a platform’s services.
In an industry often criticized for speculation, revenue offers a foundation grounded in actual utility.
The Rise of On-Chain Businesses
One of crypto’s most fascinating developments is the emergence of fully on-chain businesses.
Decentralized exchanges generate trading fees.
Lending protocols earn interest spreads.
Infrastructure networks collect usage fees.
Stablecoin issuers generate treasury income.
Prediction markets monetize information flows.
Tokenized asset platforms create revenue from issuance and management services.
These businesses operate globally, transparently, and continuously, often with financial metrics visible in real time.
Unlike traditional companies that report earnings quarterly, blockchain protocols frequently provide open access to their economic performance.
This transparency allows investors to evaluate projects using objective data rather than relying solely on marketing narratives.
Revenue and Token Valuation
The growing focus on revenue is also changing how market participants evaluate tokens.
Historically, token valuations often depended on future expectations:
- Potential adoption
- Partnership announcements
- Ecosystem growth
- Narrative momentum
Today, investors increasingly examine:
- Protocol revenue
- Fee generation
- Treasury growth
- Token buyback mechanisms
- Value accrual models
- Economic sustainability
Projects that successfully connect protocol revenue to token holder value may attract greater long-term investor confidence.
As markets become more sophisticated, financial performance is becoming a larger component of token analysis.
The Era of Productive Capital
Another reason revenue is gaining importance is the changing nature of capital allocation.
During periods of abundant liquidity, speculative assets can thrive regardless of fundamentals.
As markets mature, however, investors become more selective.
Capital increasingly flows toward protocols that generate measurable economic activity rather than simply promising future growth.
This creates a feedback loop:
Strong products generate revenue.
Revenue attracts investors.
Investment funds expansion.
Expansion generates additional revenue.
Protocols capable of sustaining this cycle may become the dominant digital businesses of the next decade.
Beyond Revenue: Quality Matters
Not all revenue is created equal.
Sophisticated investors look beyond headline figures to evaluate:
- Revenue consistency
- User retention
- Revenue diversification
- Organic demand
- Cost efficiency
- Long-term scalability
A protocol that earns sustainable revenue from loyal users may ultimately outperform one that generates larger but highly volatile fee streams.
The quality of revenue is becoming just as important as the quantity.
What This Means for Crypto’s Future
The rise of revenue-focused investing signals a broader maturation of the digital asset industry.
Crypto is gradually transitioning from an experimental ecosystem driven primarily by narratives into an industry increasingly evaluated through business fundamentals.
Narratives will never disappear. Stories remain powerful drivers of innovation and capital formation.
However, the strongest narratives of the future may be those supported by measurable economic performance.
In the years ahead, attention alone may no longer be enough.
Protocols will need users.
Users will need products.
And products will need revenue.
The next generation of crypto winners may not simply be the projects with the loudest communities or the strongest narratives.
They may be the projects that generate real value, serve real customers, and produce sustainable revenue at scale.
Because in an increasingly mature digital economy, revenue is no longer just a metric.
Revenue is the narrative.
REQUEST AN ARTICLE


Disclosure: This article does not represent investment advice. The content and materials featured on this page are for educational purposes only.
Bitcoin miners face rising costs as AI computing and cloud mining models gain traction across the industry.
Summary
- U.S. Bitcoin miners face pressure from the halving, power costs, and competition as AI cloud mining gains traction.
- Ei Crypto promotes AI-powered cloud mining, letting users access BTC, ETH, XRP, and other assets without hardware.
- Rising mining costs are pushing investors toward AI-managed cloud computing platforms focused on automation and security.
As the global digital asset industry enters a new cycle of development, U.S. Bitcoin mining companies are facing unprecedented operational pressure. Influenced by multiple factors, including the Bitcoin halving, rising electricity costs, accelerated equipment upgrades, and intensifying market competition, the profit margins of traditional mining enterprises continue to be squeezed. Industry analysts point out that under the current environment, how to improve computing power utilization efficiency, reduce operating costs, and achieve stable returns has become a topic of common concern across the entire industry.
At the same time, AI-powered computing power and cloud mining models are rapidly emerging, becoming a new area of interest for an increasing number of investors and digital asset holders.
U.S. mining companies face profit pressure as the industry accelerates its search for transformation
Since Bitcoin completed its latest halving, the block rewards received by miners have been further reduced. At the same computing power level, the revenue of mining companies has been directly affected.
At the same time, electricity prices continue to rise in certain regions of the United States, leading to steadily increasing operating costs for large-scale mining facilities. In addition to electricity expenses, traditional mining companies must also continuously invest in equipment procurement, mining machine maintenance, cooling system construction, and personnel management costs.
Industry experts believe that future competition in the mining industry will increasingly focus on operational efficiency and intelligent management capabilities. Platforms that can reduce costs and improve computing power utilization through technological innovation will possess stronger market competitiveness.
Against this backdrop, AI-powered computing power management systems and cloud mining models are gradually gaining increasing attention from the market.
AI Cloud computing power is transforming traditional mining models
Unlike traditional mining farm models, cloud mining provides users with a more convenient way to participate in digital assets through centralized computing power resource management.
As one of the global intelligent computing power platforms for digital assets, Ei Crypto integrates global computing power resources through its AI-powered scheduling system, enabling 24/7 automated operation. Users do not need to purchase mining machines, bear electricity costs, or possess professional technical experience to participate in digital asset cloud computing power services.
The platform supports a variety of mainstream digital assets, including:
- BTC
- ETH
- XRP
- USDT
- LTC
- BCH
- USDC
Users only need to select a computing power plan that suits their needs, and the system will automatically complete computing power allocation, earnings calculation, and operational management.
Ei crypto platform advantages gain market attention
As the digital asset industry gradually matures, investors are placing higher demands on platform security, stability, and transparency.
Ei Crypto continues to improve its platform infrastructure and adopts a multi-layered security protection system:
- AI-powered risk control system for real-time monitoring of abnormal activities
- Cold wallet storage mechanism to ensure asset security
- SSL data encryption technology to protect user information
- Multi-factor authentication (2FA)
- Third-party security audit mechanism
- Global server deployment
- 24/7 customer service support
Through its intelligent management and secure operational framework, the platform provides global users with a more stable digital asset service experience.
Getting started with Ei Crypto cloud computing power services
Step 1: Register an Account
Visit the official Ei Crypto website to complete the registration.
New users can receive a $15 trial reward after registration and can also claim a $0.60 daily check-in reward by logging in each day.
Step 2: Deposit Digital Assets
The platform supports deposits of a variety of mainstream digital assets, including:
- BTC
- ETH
- USDT
- XRP
- LTC
- USDC
- BCH
After completing the deposit, users can participate in the cloud computing power program.
Step 3: Choose a computing power plan
Ei Crypto offers a variety of computing power plans based on different user needs.
Sample Plans:
Starter Plan
$100 — 2-day term — Total earnings of approximately $108
Stable Plan
$1,200 — 10-day term — Total earnings of approximately $1,362
Advanced Plan
$5,000 — 20-day term — Total earnings of approximately $6,500
Long-Term Plan
$27,000 — 30-day term — Total earnings of approximately $43,200
After making a selection, the platform will automatically activate the computing power service. The system operates around the clock, and users can monitor their earnings in real time and choose to withdraw or continue reinvesting based on their personal needs.
AI cloud computing power becomes a new trend in the digital asset market
As profit margins in the traditional mining industry continue to shrink, the industry is accelerating its development toward intelligence, automation, and lower barriers to entry.
An increasing number of BTC holders have stated that, compared with simply waiting for market prices to rise, participating in digital asset earning programs through AI-powered cloud computing can further improve asset utilization efficiency and generate continuous returns during the holding period.
Industry analysts believe that, as artificial intelligence technology continues to integrate with digital asset infrastructure, AI cloud computing power is expected to become an important component of the global digital asset ecosystem and provide more investors with more flexible and efficient earnings management solutions.
Conclusion
In the face of continued profit pressure on U.S. mining companies and intensifying industry competition, AI-powered cloud computing and cloud mining models are attracting increasing attention from more and more market participants.
Through its AI-powered computing system, global resource integration capabilities, and comprehensive security protection framework, Ei Crypto provides users with a more convenient and efficient digital asset earnings solution. For investors who wish to continue creating value while holding digital assets, AI cloud computing is gradually becoming a new option worthy of attention.
For more information, visit the official website and download the mobile app.
Disclosure: This content is provided by a third party. Neither crypto.news nor the author of this article endorses any product mentioned on this page. Users should conduct their own research before taking any action related to the company.

A coalition of more than 50 gaming associations, tribal governments, and labor unions submitted a letter to the Senate on June 16, demanding that the Digital Asset Market Clarity Act include explicit language banning prediction markets from offering sports and casino-style event contracts. This is a direct shot at platforms like Polymarket and Kalshi that have built substantial real-money event contract businesses under CFTC oversight.
— NewsTongue (@NewsTongueX) June 17, 2026
 Gaming groups urge Senate to ban sports prediction markets in crypto bill
The American Gaming Association, Indian Gaming Association, and Association of Gaming Equipment Manufacturers sent a letter to the Senate calling for language in the Clarity Act that would explicitly… pic.twitter.com/TKcgGM4J4E
Signatories include the American Gaming Association (AGA), the Indian Gaming Association (IGA), and UNITE HERE, which represents 300,000 hotel, gaming, and food-service workers across the U.S. and Canada.
The letter argues that prediction market platforms have engineered the largest expansion of gambling in U.S. history over the past 18 months without state authorization, legislative approval, or meaningful consumer protections.
Discover: The Best Token Presales
Coalition’s Core Argument: CFTC Was Never Built to Police Gambling
The coalition’s legal framing is specific and worth unpacking. The groups are not simply arguing that sports betting is a bad policy. According to the coalition, the CFTC structurally lacks the authority and institutional infrastructure to regulate it. “Sports betting falls outside the CFTC’s remit and cannot be offered through prediction market platforms,” the letter states.
The CFTC was established to oversee commodities and derivatives markets, not to police wagering integrity, underage access, or problem-gambling safeguards – none of which it has enforcement history on.
AGA President Bill Miller has previously stated that gaming integrity frameworks are “being undermined by so-called ‘prediction markets’ who are invading state, local, and tribal authorities.”
UNITE HERE’s president, Gwen Mills, framed it as an employment threat: workers’ livelihoods are “now threatened by prediction markets conducting illegal sports betting in violation of Tribal sovereignty and state laws.”
The IGA’s concern runs deeper still, that the Clarity Act, without explicit carve-outs, could functionally back-door legalize nationwide sports betting by routing it through CFTC-registered platforms, bypassing the tribal-state compact system that currently governs where and how wagering is offered.
The American Gaming Association has also claimed states have lost approximately $1 billion in tax revenue to prediction markets since the start of 2025, though prediction market operators dispute that figure.
Senator John Hickenlooper of Colorado put the jurisdictional argument plainly: “The CFTC has literally no experience in regulating sports betting. Even worse, CFTC has failed to use the authority it does have to protect sports bettors from insider trading, market manipulation, predatory advertising, and financial instability.”
Discover: The Best Crypto to Diversify Your Portfolio
Clarity Act Legislative Battlefield: Three Obstacles, Nine Days, One Threshold
The gaming coalition’s letter lands on a bill already under structural strain. The Digital Asset Market Clarity Act cleared the Senate Banking Committee 15–9 on May 18, a meaningful vote count but one that does not resolve the three distinct obstacles still blocking floor passage.
An unresolved ethics fight embedded in the bill’s language, two competing committee texts that must be merged, and a 60-vote cloture threshold that demands bipartisan buy-in well beyond what the committee vote demonstrated.
With just nine working days before the July 4 recess, Senate drafters face a compressed timeline to decide whether to fold the gaming coalition’s anti-sports-betting language directly into the Clarity Act text or leave it to the separate Schiff-Curtis bill. S
Senators Adam Schiff and John Curtis introduced the Prediction Markets Are Gambling Act (S.4160) in March 2026, which would amend the Commodity Exchange Act to explicitly bar CFTC-registered entities from listing contracts tied to any sporting event or athletic competition, or offering casino-style products like poker or blackjack. That bill preserves state and tribal gaming jurisdiction as the governing framework, exactly what the IGA and AGA want codified.
The immediate regulatory trigger for this lobbying push was the CFTC’s early June 2026 rulemaking, which advanced a framework formally permitting certain sports event contracts on prediction markets. Banning markets on injuries, officiating calls, high-school athletics, and pure-chance games, but leaving skill-influenced event contracts potentially open.
Discover: The Best Token Presales
The post Casinos, Tribes, and Unions Urge Senate to Ban Sports Betting From the Clarity Act appeared first on Cryptonews.

CoinMENA, a cryptocurrency exchange operating in the United Arab Emirates, has signed a banking agreement with Standard Chartered to enhance how customers move between crypto and fiat. The deal is designed to strengthen fiat payment infrastructure, with Standard Chartered set to support key functions including on- and off-ramps and transaction management through virtual account arrangements.
In a separate development, Bloomberg reports that the Central Bank of the UAE has approved Revolut’s applications for Stored Value Facilities and Retail Payment Services licenses—another sign that mainstream fintech is preparing for deeper involvement in the UAE’s regulated financial landscape, even as questions remain about whether digital-asset services will be included at launch.
Key takeaways
- CoinMENA says Standard Chartered will support fiat on- and off-ramps, client money accounts, and virtual-account transaction management in the UAE.
- The exchange frames the partnership as a way to improve transparency and liquidity settlement with approved global counterparties.
- CBUAE approval of Revolut’s Stored Value Facilities and Retail Payment Services licenses indicates regulatory progress for broader fintech payments in the UAE.
- Revolut’s reported licenses cover payments and stored value; they do not amount to a clear, explicit green light for digital-asset trading or related services.
CoinMENA links fiat rails to Standard Chartered
CoinMENA announced that it has entered a banking agreement with Standard Chartered, aiming to “strengthen fiat payment infrastructure” for customers in the UAE. According to a press release shared with Cointelegraph, the exchange will use Standard Chartered to facilitate fiat on- and off-ramps as well as client money accounts.
The agreement also covers virtual account-based transaction management, which CoinMENA says is intended to bring more structured handling of transfers. The exchange believes this will help improve transparency and liquidity settlement when transacting with approved global counterparties.
The move comes as the UAE’s digital asset ecosystem continues to mature and attract more institutional participation. For many exchanges, reliable access to regulated banking infrastructure is increasingly treated as a prerequisite for scaling fiat volumes, reducing operational friction, and meeting compliance expectations tied to customer funds handling.
Standard Chartered emphasizes the UAE’s regulatory pull
Standard Chartered UAE, Middle East and Pakistan CEO Rola Abu Manneh said in the announcement that the UAE has positioned itself as a leading regulatory environment for digital assets. She suggested this creates collaboration opportunities for financial institutions and regulated firms.
That emphasis matters because crypto firms increasingly rely on bank partnerships not just for payment convenience, but for settlement reliability and compliance processes that can be difficult to replicate through non-bank alternatives. In this context, CoinMENA’s choice to anchor parts of its fiat flow around a major global bank reflects a broader trend in which exchanges seek “bank-grade” rails as they expand.
CoinMENA co-founders Dina Sam’an and Talal Tabbaa underlined the strategy in a joint statement, arguing that the industry’s future hinges on banking, regulatory, and operational foundations—not solely on technology.
Why bank agreements are becoming a competitive lever
For UAE-based exchanges, fiat rails are often the difference between frictionless onboarding and a payment process that can be slow, inconsistent, or difficult to scale. While the press release does not quantify outcomes such as reduced settlement time or improved throughput, it does outline the operational components involved: fiat on- and off-ramps, client money accounts, and virtual account transaction management.
These elements are particularly relevant for exchanges that want to attract a wider range of users, including those who prefer predictable banking workflows and clear custody or segregation practices for customer funds. The pledge of “improved transparency” also suggests that CoinMENA views clearer transaction handling and settlement processes as critical to trust and compliance.
Investors and users should watch how partnerships like this translate into day-to-day experience—such as deposit and withdrawal reliability, the smoothness of conversion flows, and whether settlement with counterparties becomes more consistent as volumes grow. Over time, exchanges with stronger banking connectivity may be better positioned to handle institutional-level demand that depends on dependable fiat processing.
Revolut’s UAE licenses signal wider payments expansion
Separately, Bloomberg reports that the Central Bank of the UAE has approved Revolut’s applications for Stored Value Facilities and Retail Payment Services licenses. The report frames this as the fintech moving closer to a UAE launch, with Revolut reportedly planning to build out technology, operations, and local capabilities before it makes its services available.
Bloomberg also notes that UAE users are expected to receive multi-currency accounts, physical and virtual cards, and domestic and international transfers through Revolut’s app. The combination of stored value and retail payment services indicates a focus on payments infrastructure and consumer financial utility rather than a direct digital-asset platform at the outset.
At the same time, the scope of authorization remains a key point for readers. The licenses approved in the report relate to stored value and retail payment services, not an explicit waiver for “virtual asset” activity. Revolut has not publicly confirmed—per Bloomberg’s reporting—whether its UAE offering will include digital asset trading, transfers tied to crypto, staking, or access to its Revolut X exchange.
Cointelegraph reached out to Revolut for comment but did not receive a response before publication, leaving details about a possible digital-asset component uncertain.
Bloomberg also reports that Revolut is considering additional expansion across the Middle East and North Africa, including Turkey and Morocco. If so, the UAE could become a test case for how rapidly the firm scales regulated payments in the region ahead of any expanded service offerings.
What to watch next in the UAE’s regulated finance build-out
These two developments—CoinMENA’s banking agreement with Standard Chartered and Revolut’s central bank licensing progress—highlight the UAE’s push toward deeper integration between regulated banking rails and digital finance services. The immediate questions for market participants are whether CoinMENA’s fiat improvements translate into measurable user and liquidity outcomes, and whether Revolut’s UAE rollout stays strictly within payments or eventually broadens into explicitly licensed digital-asset functions.

Ethereum price is pinned under $1,800, consolidating in a tight band as the market holds its breath ahead of the FOMC rate decision. Two overlapping catalysts, macro and protocol-level, could likely help the ETH case.
On the development side, the Ethereum Foundation confirmed that testnets are already running with all planned EIPs for the Glamsterdam upgrade. It’s the combined Amsterdam execution layer and Gloas consensus layer hard fork. This also marks the final pre-public-testnet development stage.
If testing clears without major issues, mainnet activation is targeted for the second half of 2026. The upgrade directly targets L1 scalability: ePBS and BALs are designed for faster block processing and future parallel execution, while the proposed gas repricing could make simple ETH transfers up to 71% cheaper, and could retake its market share that has been taken by Solana and any major L1 rivals.
Whales have accumulated 400,000 ETH between Sunday and Monday, driving a 6% gain, but the move has since faded back into range.
Discover: The Best Token Presales
Can Ethereum Price Shoot $2,000 Soon?
Ethereum price technical structure is readable, if not definitive. Price has been capped under $1,800 intraday range, with the consolidation zone defined between $1,760 and $1,800.
The $1,800 is, of course, the first meaningful resistance cluster. Above that, $2,000 represents the breakout zone that aligns with the lower Ichimoku cloud boundary. A confirmed close above that level opens a measured move toward $2,200, with $3,000–$3,050 as the macro target if momentum sustains.

A dovish FOMC, like a surprise rate cut with easing language, triggers a relief rally. TradingView analysis even targets the $2,600–$2,700 zone on that outcome. Glamsterdam testnet progress adds a protocol-level bid.
But if Fed holds with ambiguous language. ETH stays range-bound for another week while traders wait for cleaner signals. This will likely happen as the FOMC decision is already expected to stay at 350-375bps, so the price is likely priced in
The Standard Chartered bullish ETH thesis rests partly on ETF inflow momentum, which remains intact as BlackRock’s staked ETHB product draws institutional attention. That structural bid is real, but it doesn’t override macro in the short term.
Discover: The Best Crypto to Diversify Your Portfolio
LiquidChain Targets Early-Mover Upside as Ethereum Tests Key Levels
Ethereum at $1,800 is a recovered asset, but recovery from multi-month lows means the percentage upside from here is structurally smaller than it was six months ago.
Whale accumulation and ETF inflows confirm conviction at this level, yet the range-bound price action suggests the market is pricing in uncertainty, not opportunity. That’s exactly the environment where early-stage infrastructure plays attract capital that’s rotating away from crowded large caps.
Different chains, same problem.
LiquidChain is the bridge between them. ⟁pic.twitter.com/6JcPjebA6S
— LiquidChain (@getliquidchain) April 27, 2026
LiquidChain ($LIQUID) is an L3 infrastructure project built around a specific unsolved problem: fragmented liquidity across Bitcoin, Ethereum, and Solana. Its Unified Liquidity Layer fuses BTC, ETH, and SOL execution environments into a single-step architecture.
With Liquid, developers deploy once and access all three ecosystems. The presale is currently priced at $0.0147, with $850K raised to date. Standout features include Verifiable Settlement and a Deploy-Once Architecture designed to eliminate the cross-chain friction that still costs DeFi protocols measurable slippage and latency.
LiquidChain presale is worth a closer look before the next price step-up.
The post Ethereum Price Prediction: Final Glamsterdam Tests Could Ignite ETH After FOMC appeared first on Cryptonews.


Singapore’s Monetary Authority has added Bybit to its Investor Alert List, placing one of the world’s largest crypto exchanges alongside other platforms that are not licensed to offer regulated services to users in the city-state.
Summary
- Singapore’s MAS has added Bybit to its Investor Alert List, warning that the exchange is not licensed or regulated to provide services to local users.
- The move follows Singapore’s continued push for stricter crypto compliance, weeks after MAS revoked Bsquared’s licence over regulatory breaches and false statements.
- Despite the Singapore alert, Bybit continues to expand globally and recently launched tokenized fixed income products through a partnership with Plume.
According to the Monetary Authority of Singapore (MAS), Bybit Fintech Limited and its trading platform were added to the Investor Alert List on June 17. The regulator said the list identifies entities that may be wrongly perceived as being licensed, authorized, or otherwise regulated by MAS.
Unlike an enforcement action or operating ban, the Investor Alert List serves as a public warning tool. MAS noted that the list is not exhaustive and is compiled based on information available at the time of publication. Bybit’s entry includes the exchange’s main website.
Founded by Singaporean entrepreneur Ben Zhou, Bybit has grown into the second-largest crypto exchange by trading volume globally. Despite those roots, the company already restricts Singapore users under its terms of service and has implemented measures such as geo-blocking local IP addresses.
Singapore requires firms offering digital payment token services to obtain authorization under the Payment Services Act. Exchanges that operate without the necessary approvals risk regulatory action if they solicit or serve local residents.
Singapore maintains pressure on licensed and unlicensed firms
For local investors, MAS continues to direct users to its Financial Institutions Directory to verify whether a platform holds the appropriate licenses before using its services.
The latest warning comes as Singapore maintains a strict compliance stance across the crypto sector. In May, MAS revoked the Major Payment Institution licence of Bsquared Technology after finding false or misleading statements and identifying significant weaknesses in risk management, conflict-of-interest controls, and outsourcing arrangements. The regulator also said it was reviewing whether senior officers at the firm could bear personal responsibility for the breaches.
That case stood out because Bsquared had already obtained regulatory approval before losing its licence. Together with warnings directed at unlicensed platforms, the move underscored MAS’s focus on investor protection and compliance oversight.
Elsewhere, the regulator has continued to approve firms that meet its standards. Recent approvals for crypto infrastructure providers such as BitGo have highlighted the high compliance threshold required to operate in Singapore’s regulated market.
No disruption to Bybit’s global operations has been reported following the Singapore listing. The exchange continues to offer trading services, token listings, proof-of-reserves disclosures, and other products in jurisdictions where it is permitted to operate.
Bybit had not issued a public statement on the MAS listing at the time of publication and did not immediately respond to a request for comment.
MAS’s action also follows a different regulatory outcome for Bybit in Malaysia. In April 2026, the exchange was removed from the country’s investor alert list after engaging with local regulators and addressing compliance concerns.
Bybit expands products while facing regulatory scrutiny
Outside Singapore, Bybit has continued to broaden its product lineup and compliance efforts.
Just days before the MAS alert, Bybit partnered with Plume to launch institutional fixed-income vaults through the exchange’s real-world asset section. The offering allows users to deploy stablecoins into products linked to traditional fixed-income instruments associated with PIMCO and China Merchants Bank International.
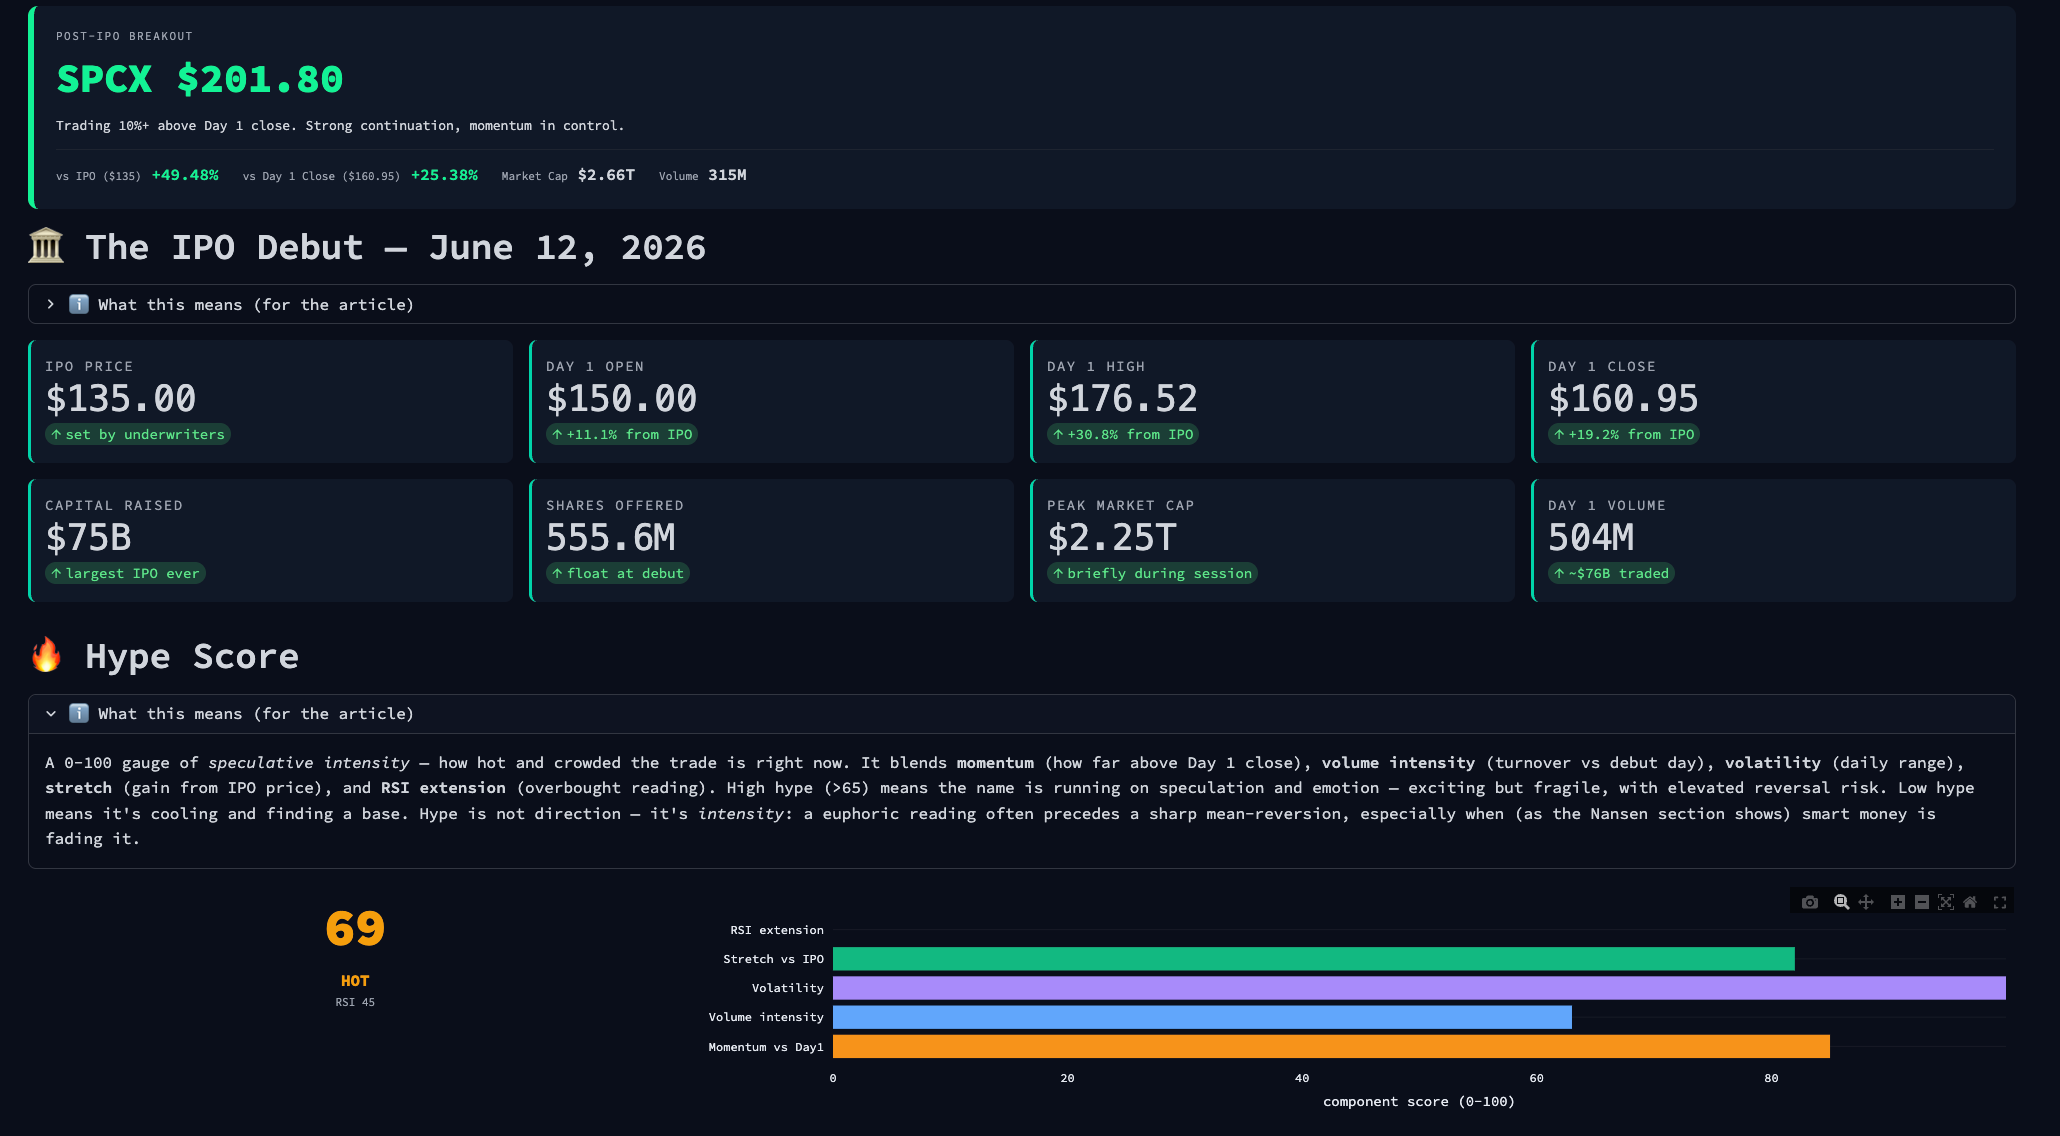
SpaceX stock launched like one of its own rockets. Within days of its debut it blasted toward $3 trillion, before settling near $2.66 trillion. Its busiest crypto market is now betting it comes back to earth.
On the perpetuals where SpaceX trades around the clock, the smart money is positioned for a fall. BeInCrypto pulled the data behind the euphoria.
A Record IPO, a $60 Billion Deal, and a Near $3 Trillion Peak
SpaceX (SPCX) priced its IPO at $135 on June 12 and raised about $75 billion, the largest listing ever. Four days later, it signed a $60 billion all-stock Cursor acquisition, buying AI coding firm Anysphere.
Want more insights like this? Sign up for Editor Harsh Notariya’s Daily Newsletter here.
The stock jumped as much as 14%. Its SpaceX market cap pushed past $2.7 trillion, briefly overtaking Amazon.

It has since cooled near $202, and its Hype Score has slipped to 69. The euphoria might just be fading.
The Warning Sits in the Crypto Market
SpaceX trades as one of the busiest Hyperliquid perpetuals, with $304 million in open interest. There, the smart money leans hard one way. Nansen data shows it is net short $20.8 million, with 91% of its exposure short.
Whales are net short $23.7 million. The three tracked cohorts combine to a $45.3 million net short bet, a one-sided bet against the rally.

They built that short from the IPO near $167 straight through the climb to $208. The smartest traders are positioned for a fall.
One Signal Still Keeps the Bulls Alive
For now, the money flow still points to buying. That is the one thing holding the rally up.
Chaikin Money Flow tracks whether money is entering or leaving an asset. It weights each move by volume, so it leans toward large, institutional orders. The reading sits positive at +0.14. That says the big money is still accumulating SpaceX, not distributing it.
Price also holds above its volume-weighted average price, or VWAP. That line is the volume-based average price institutions use to judge fair value on the day.
Trading above VWAP means buyers are paying up to get in, not waiting for lower prices. Paired with the money flow, it says accumulation has not broken yet.

The tell to watch is simple. If price holds up while that money flow rolls negative, institutions are quietly selling into strength. That gap between a steady price and a falling flow is the classic mark of distribution. For now, it has not appeared.
Flows, though, only show how SpaceX trades day to day. They say nothing about what kind of stock it really is.
Tesla Crashed After Its IPO Too
The deeper risk is the company SpaceX keeps. It trades like a Musk stock, not a space stock. Its correlation to Tesla sits near 0.12, while its tie to space peers is about negative 0.15. SpaceX moves on Musk and tech sentiment, even if the correlation is weak for now.

That matters because Tesla, Musk’s other company, also surged after its 2010 IPO before a sharp reversal. Traders see the same script. BeInCrypto reported the bear case in detail. Analyst Ted Pillows expects a 60% to 70% pump, then a brutal 50% crash.
What the Options Market Says about SpaceX (SPCX) Stock
The options market looks like one bullish offset. It is also the most double-edged read on the board. SpaceX put-to-call volume sits near 0.84, based on Barchart data. A ratio below 1 means more calls traded than puts, a crowd leaning long.
Heavy call buying can fuel a squeeze. Dealers who sell those calls hedge by buying stock, and they buy more as the price climbs. But that hedge runs in reverse. If the price falls, the same dealers sell their stock back, and the drop speeds up.
The contracts expire tomorrow, when that effect peaks. If the rally stalls below the call strikes overhead, that support unwinds fast. A call-heavy book is not a one-way bet higher. It is fuel that burns in whichever direction the price breaks first.

Note: Implied volatility, the move the options market is pricing in, runs near 170% into the two-day expiry. That is a bet on a violent swing, not a quiet drift, and it cuts both ways.
The same skew shows the crowd chasing calls while the crypto market’s smart money sells into it. The forced-selling risk sits next door, on the leveraged perps. There, longs face liquidation on a breakdown, while call buyers only lose their premium.
The chart marks the near-term line. SpaceX holds $201 as Fibonacci support, a level BeInCrypto flagged this week. A break opens $193, then $179. This week’s options expiry is the first trigger for the SpaceX stock. The bigger test is August, when early lock-ups expire and fresh shares hit the market.
Every SpaceX stock price prediction is a coin flip from here. The crowd and its call options are built for a squeeze. The smart money and the Tesla script are positioned for a flush. August settles it.
The post $45 Million in Shorts Are Betting SpaceX Stock Comes Back to Earth appeared first on BeInCrypto.
Crypto World
Novo Nordisk (NVO) Stock Under Pressure as Hackers Leak Stolen Data After Ransom Rejection

Key Points
- FulcrumSec, a cybercrime extortion operation, alleges it extracted more than 1.3 terabytes of confidential files from Novo Nordisk following the company’s decision to reject a $25 million ransom payment.
- The compromised information purportedly contains source code, confidential pharmaceutical research, clinical study documentation, and proprietary AI system files.
- The threat actors report they infiltrated the network through a GitHub access credential found in March, maintaining persistent access for more than two months.
- On June 11, Novo Nordisk publicly acknowledged a security breach involving unauthorized entry into select internal technology infrastructure and exposure of personal information.
- FulcrumSec now states it plans to pursue targeted private transactions for portions of the stolen materials while pledging to withhold patient information, employee records, and production facility data.
On June 11, Novo Nordisk publicly acknowledged a security incident, reporting that intruders had obtained unauthorized entry to a restricted set of internal technology systems. This announcement followed months during which FulcrumSec, a ransomware and extortion collective, had allegedly maintained concealed access to the pharmaceutical giant’s digital infrastructure.
At the moment of the public disclosure, NVO stock was hovering near $66. The shares have experienced downward pressure over recent months, and this cybersecurity episode introduces additional complications for investors.
According to FulcrumSec, their initial entry point was a GitHub authentication token they located in March. This credential provided them with entry to internal software repositories, which they subsequently leveraged to harvest additional login information and expand their foothold within Novo Nordisk‘s digital environment.
The group asserts it maintained undetected presence within the network for over two months. During this period, they claim to have exfiltrated approximately 1.3 terabytes of information encompassing more than 700,000 separate files.
FulcrumSec contacted undisclosed executives at Novo Nordisk with a $25 million payment demand. The pharmaceutical company responded on June 3—about 48 hours following the initial contact—using a Proton Mail account to authenticate their identity. Subsequently, Novo Nordisk refused to meet the payment terms.
Following the rejection, FulcrumSec indicates it is now pursuing selective private transactions for specific segments of the stolen information.
The threat actors informed Reuters they would actually prefer public disclosure of the materials, characterizing it as “a more effective deterrent for future companies to avoid paying.”
Contents of the Stolen Materials
FulcrumSec alleges the compromised files encompass source code, confidential details regarding both commercialized and developmental pharmaceuticals, clinical research data, and information connected to Novo Nordisk’s production operations.
The group also claims possession of internal artificial intelligence model files. This particular element carries significance considering Novo Nordisk’s publicized collaboration with OpenAI, which aimed to embed AI capabilities throughout drug development, production processes, and business operations by the end of 2026.
FulcrumSec maintains it will withhold certain data categories from release. These protected materials include documentation on thousands of staff members and medical professionals, information concerning approximately 11,500 anonymized clinical trial participants, and operational technology files from Novo Nordisk’s manufacturing locations.
The collective characterized this selective withholding as component of its “harm-reduction strategy.”
Evaluating the Threat Actor’s Legitimacy
Thomas Willkan, research director at cybersecurity organization Lab-1, informed Reuters that FulcrumSec is “usually quite legit in terms of both their capabilities and also their claims.” Willkan has maintained close surveillance of FulcrumSec since the group’s first appearance in October 2025.
Reuters noted it could not immediately authenticate the legitimacy of the materials published by the threat actors.
A representative from Novo Nordisk stated the organization “is aware of claims that data allegedly copied externally without authorisation from our systems has been published online,” and verified communication with appropriate regulatory bodies.
DataBreaches.net documented on June 15 that FulcrumSec provided alleged communications with Novo Nordisk beginning June 1, including a catalog of over 700,000 items totaling approximately 1.3 terabytes.
VX-Underground also published a report on Monday regarding an unidentified threat actor compromising Novo Nordisk. FulcrumSec maintains its intrusion represents a distinct incident from that reported breach.


Is it just me or does financial advice sometimes ignore the cultural weight of certain

England v Croatia: Who are Vuskovic, Gvardiol, Modric, Sucic & other players to watch out for?

Target, Walmart and Amazon losing LGBTQ+ consumer spending

Blockchain.com files with SEC for U.S. IPO

Israel says it has killed new Hamas military leader in Gaza City airstrikes

No Jackpot Winner as $257 Million Prize Rolls Over to $269 Million Monday Draw
Is it just me or does financial advice sometimes ignore the cultural weight of certain

Finance Bill 2026: New Rental Tax, PAYE Relief & Gratuity Changes Explained in Kenya

Finance Ministry asks employees to avoid Ai tools like #chatgpt and #deepseek #ai #bot #finance
-
 Business3 days ago
No Jackpot Winner as $257 Million Prize Rolls Over to $269 Million Monday Draw
-

 Crypto World6 days ago
Oppenheimer backs SpaceX as $70 billion retail frenzy builds
-

 Fashion5 days ago
Weekend Open Thread: Tuckernuck – Corporette.com
-

 Crypto World6 days ago
Markets Rally as SpaceX IPO Looms Amid Iran Tensions and Inflation Surge
-
 Crypto World3 days ago
Zimbabwe Requires Crypto Businesses to Register Annually Under New FIU Regulations
-

 Tech5 days ago
NanoClaw integrates JFrog registries to secure AI agent downloads
-

 Tech5 days ago
This Week In Security: Microsoft On Microsoft, Register Your Domains, Linux On ARM, And FreeBSD Joins The File Cache Club
-

 Crypto World4 days ago
Bitget enters Argentina’s regulated crypto market through PSAV registration
-
 Tech6 days ago
Dutton Ranch star claims they ‘didn’t see any disruption’ on set following Chad Feehan’s exit from Yellowstone spinoff fueled by Taylor Sheridan clash rumors
-

 NewsBeat6 days ago
El Nino has formed in the Pacific and could set records, forecasters say
-

 Politics6 days ago
Politics Home | Healey Resignation Is “Colossal Failure Of Government”, Says Former Labour Defence Secretary
-
 Entertainment6 days ago
Donnie Wahlberg & More Heat Up Las Vegas at Circa’s Barry’s Downtown Prime
-
 Tech6 days ago
Opendoor Ends India Operations, Fueling a Bigger Conversation About AI and Outsourcing
-

 Politics6 days ago
Belfast burns, while Met chief points finger at Iran and Russia
-

 Sports6 days ago
First Time Since 1971: Australia Register Historic Low In ODI Cricket
-

 Business6 days ago
AT&T: Verizon's 27% Outperformance Sets Up A Solid Entry Point
-

 NewsBeat5 days ago
FBI searches office of Ohio voter registration group
-
 Tech6 days ago
Anthropic is spending $150M to embed 1,000 AI fellows inside nonprofits. No degree required.
-

 Politics6 days ago
Modi thanks Trump for wishes as US attacks Indian seafarers
-
 Entertainment6 days ago
‘The Pitt’s Fan-Favorite Doctor Confirms Noah Wyle Gave His Blessing to Return [Exclusive]
You must be logged in to post a comment Login