
Crypto World
Polygon’s Giugliano Hardfork Signals a Stability Push After a Rough 2025
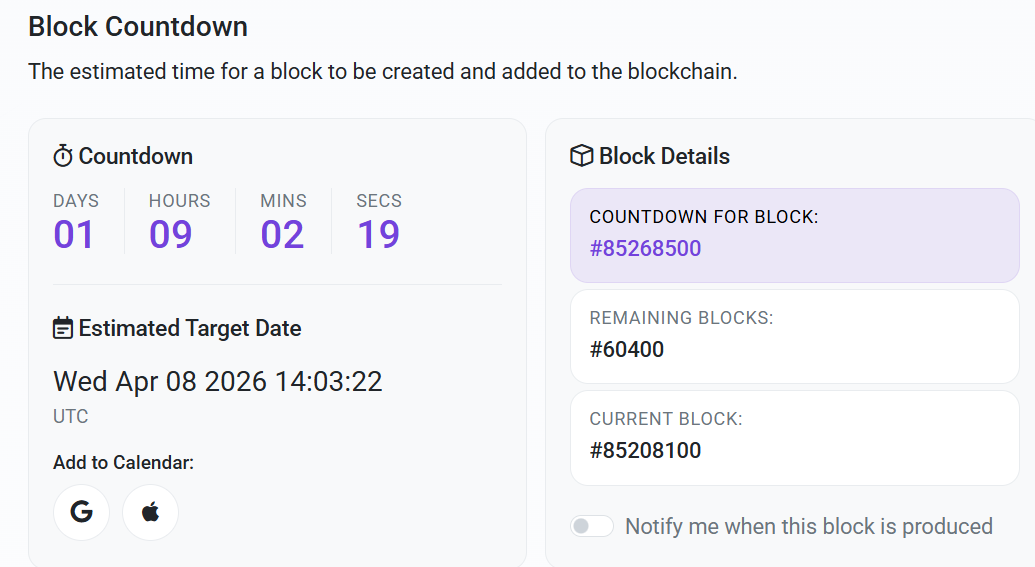
The Polygon Foundation confirmed the Giugliano hardfork will activate on mainnet at block 85,268,500, roughly 2 p.m. UTC on April 8.
The upgrade targets faster finality and improved fee transparency as part of the network’s broader push toward higher throughput for payments and tokenized assets.
What the Giugliano Upgrade Changes
The hardfork allows block producers to announce blocks earlier, reducing the time users wait for transaction confirmation to become irreversible.
Testing on the Amoy testnet last month showed a roughly two-second improvement in finality time.
Giugliano also embeds EIP-1559-style fee parameters directly into block headers. This gives developers and applications more efficient access to gas pricing data at the protocol level.
New Remote Procedure Call (RPC) endpoints accompany the fee changes. These let wallets and decentralized applications query fee information without relying on external estimations.
“This upgrade enables faster finality by letting producers announce blocks earlier, adds fee parameters directly in block headers, and introduces new RPC support for fee data,” Polygon shared.
Node operators must update Bor to v2.7.0 or Erigon to v3.5.0 before the activation block. Regular users and developers do not need to take any action.
A Stability Push After a Rough 2025
The upgrade arrives after a turbulent stretch for Polygon (POL) network reliability. In September 2025, a consensus bug caused finality delays of up to 15 minutes, prompting an emergency hard fork to restore normal operations.
Two months earlier, a validator exit triggered a bug in the Heimdall consensus layer that halted finality for roughly one hour.
Since then, the team has shipped several hardforks to tighten stability. The Madhugiri upgrade in December 2025 raised throughput to approximately 1,400 transactions per second.
The Lisovo hardfork in March 2026 added improvements to smart contract reliability and subsidized gas for AI agent transactions.
Part of the Gigagas Vision
Giugliano fits within Polygon’s Gigagas roadmap, announced in June 2025, which targets 100,000 TPS for global-scale payments and real-world asset settlement.
The phased plan began with the Bhilai upgrade in July 2025, which boosted throughput to over 1,000 TPS and reduced finality from over 60 seconds to roughly 5.
The network now processes around 2,600 TPS, with internal devnets reportedly hitting above 5,000. Whether faster finality and better fee tooling translate into sustained usage growth will depend on post-upgrade network data in the coming weeks.
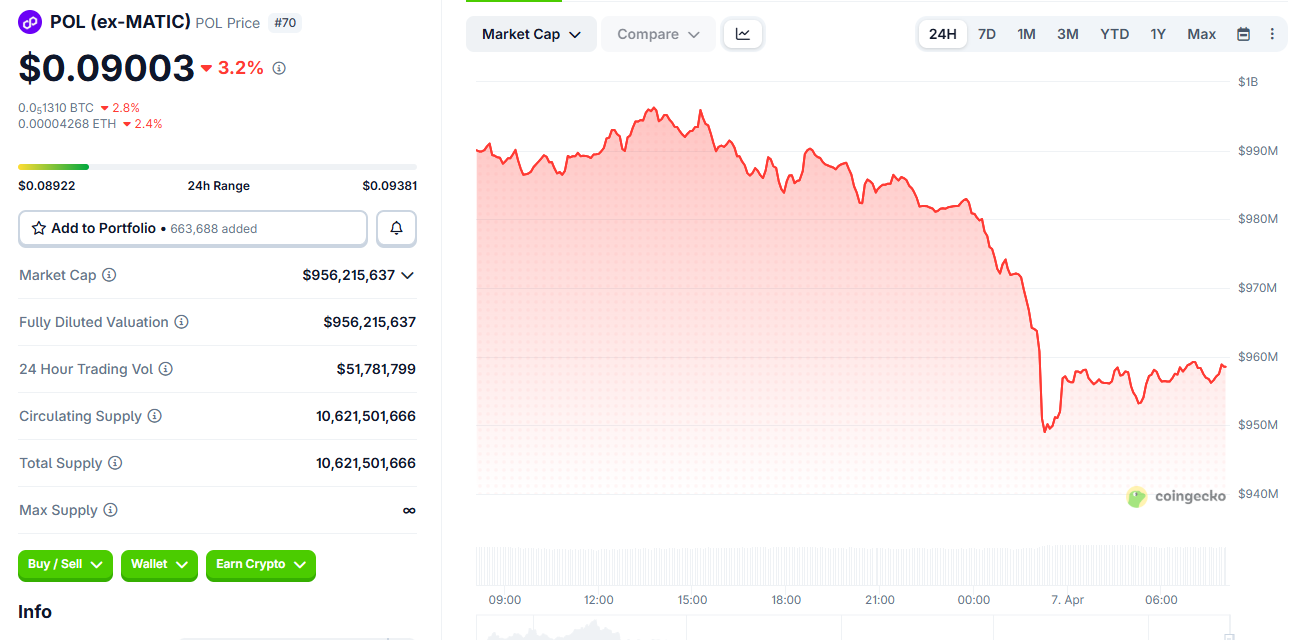
Despite anticipation for the harfork, Polygon’s powering token, POL, was down by almost 5%, trading for $0.09003 as of this writing.
The post Polygon’s Giugliano Hardfork Signals a Stability Push After a Rough 2025 appeared first on BeInCrypto.

US-listed spot Bitcoin ETFs renewed their inflow pace on Monday, drawing in $471 million in a single day, according to SoSoValue. The size of the inflow marks the strongest daily momentum in weeks as Bitcoin briefly climbed toward $70,000 before retreating to just under $69,000, per CoinGecko.
Market mood remained fragile amid ongoing geopolitical pressure and renewed concerns over Bitcoin’s quantum-resistance debate, while the Crypto Fear & Greed Index stayed in Extreme Fear at 13, highlighting the cautious stance of many investors.
Key takeaways
- Monday’s spot-Bitcoin ETF inflows reached $471 million, the largest single-day intake since February 25.
- Leading inflows by issuer: BlackRock’s IBIT with about $182 million, Fidelity Wise Origin Bitcoin Fund (FBTC) with $147 million, and ARK 21Shares Bitcoin ETF (ARKB) with roughly $119 million, per data from Farside.
- ARKB’s surge represented its strongest daily inflow in months, signaling renewed appetite among some long-duration players.
- Arkham data indicates ETF outflows slowed last week, with major issuers selling around $16.6 million in BTC; ARK Invest’s ARKB ETF bought about $34 million in BTC in that period, per Arkham.
- In April’s early sessions, US spot BTC ETFs posted about $307 million in net inflows, lifting total assets under management above $90 billion.
Top inflows and the issuer lineup
BlackRock’s iShares Bitcoin Trust ETF (IBIT) led the charge on Monday with roughly $182 million in new money, followed by Fidelity’s Wise Origin Bitcoin Fund (FBTC) at about $147 million, according to data tracked by Farside. The ARK 21Shares Bitcoin ETF (ARKB) rounded out the top three with roughly $119 million in fresh inflows, marking its strongest daily showing since mid-2025.
The activity underscores that, even amid volatility and macro concern, institutional-grade vehicles remain capable of moving sizable sums into the regulated crypto access space in the United States.
Arkham signals and weekly positioning
Arkham’s monitoring shows a refreshing pause in ETF outflows last week, with major issuers selling only about $16.6 million in Bitcoin. In that same period, ARK Invest’s ARKB ETF was the standout buyer, adding about $34 million worth of BTC. The signals point to a nuanced reweighting among funds—some lightening exposure while a subset targets fresh BTC purchases.
Looking at the broader April picture, Arkham data summarized that the first three trading sessions of the month produced roughly $307 million in net inflows for US spot BTC ETFs, helping push total assets under management over the $90 billion mark. This suggests a potential shift in risk appetite among US-listed ETF vehicles as market conditions quietly stabilize from earlier volatility.
Ether ETFs rebound, but the broader alt-coin set remains cautious
Ether-based ETF products joined the recovery, recording about $120 million in inflows on Monday and offsetting about $78 million of outflows from the prior two sessions, according to SoSoValue. Still, Ether ETFs have faced three consecutive months of losses, with total outflows reaching about $770 million for the period.
Activity across other altcoin ETFs remained comparatively muted. XRP ETFs posted zero inflows on Monday, while Solana (SOL) ETFs brought in roughly $247,000. The pattern suggests a cautious approach among investors toward non‑BTC chains, even as appetite for regulated BTC access remains firm.
What the data implies for traders and investors
The April uptick in US spot BTC ETF inflows could be interpreted as a return of institutional interest, carried partly by marquee vehicles such as IBIT and ARKB. For traders, the inflows may reflect a combination of price proximity to $70,000, ongoing macro uncertainty, and the appeal of regulated exposure with transparent custody and compliance frameworks.
Yet the backdrop remains mixed. While inflows are evolving, Bitcoin’s quantum-resistance debate and geopolitical tensions continue to cast a shadow over sentiment. The ongoing resilience in ETF demand may hinge on how regulatory clarity evolves and whether more traditional asset allocators view crypto exposure as a core, capital-efficient segment of their portfolios.
In March, Bitcoin ETFs posted about $1.3 billion in inflows—the first monthly gain after January outflows of $1.61 billion and February outflows of $207 million—indicating that financial-market participants are cautiously re-engaging with regulated crypto access after a period of outsized outflows.
As the month progresses, investors will be watching whether this renewed ETF interest translates into sustained net flows or remains episodic. Key questions include how issuer strategies adjust to shifting BTC price action, whether Ether and other altcoin ETF inflows pick up in tandem, and how regulatory developments in the U.S. shape the appetite for institutional-grade crypto exposure.
Watch next for any changes in the ETF lineup, additional weekly flow data, and how market volatility around macro headlines interacts with the ongoing push for regulated crypto access in the United States.
Key Takeaways
- UBS has revised its S&P 500 year-end 2026 projection downward from 7,700 to 7,500
- Elevated crude prices stemming from Middle Eastern geopolitical tensions drive the revision
- The benchmark index has declined 3.9% following the outbreak of Iran conflict on February 28
- Federal Reserve rate reduction expectations shifted to September and December from June and September
- Despite revisions, UBS maintains approximately 13% potential upside with $310 earnings per share forecast
UBS Global Wealth Management has adjusted its outlook for the S&P 500, trimming its price projection for 2026. The revision comes as energy costs climb and economic headwinds intensify due to escalating tensions in the Middle East.
According to an April 6 research note, UBS reduced its year-end forecast to 7,500 from a previous estimate of 7,700. The firm also lowered its mid-year projection to 7,000 from 7,300.

Since conflict erupted with Iran on February 28, the S&P 500 has retreated approximately 3.9%. Spiking energy costs combined with geopolitical instability have prompted investors to reduce equity exposure.
UBS’s central scenario anticipates the conflict subsiding in the weeks ahead, which would enable energy supply chains to gradually normalize.
Yet the Swiss banking giant cautioned that returning oil production to pre-conflict capacity will require significant time. Widespread infrastructure damage throughout the region means full production restoration remains months away.
This delay could sustain elevated crude prices beyond current market expectations.
Energy Price Surge Creates Economic Headwinds
Rising energy costs typically decelerate economic expansion while accelerating inflation. UBS indicated this pattern will likely sustain sticky inflation and create modest drag on the American economy.
Consequently, the institution now anticipates the Federal Reserve will postpone additional monetary easing. UBS had originally projected reductions in June and September but now forecasts two 25-basis-point decreases in September and December.
This adjustment illustrates how international geopolitical developments can influence domestic central bank decisions.
Notwithstanding the reduced targets, UBS calculates roughly 13.43% upside potential from the S&P 500’s most recent closing level of 6,611.83.
Long-Term Bullish Stance Remains Intact at UBS
UBS maintained its 2026 earnings projection for the S&P 500 at $310 per share. The institution characterized American equities as “attractive” notwithstanding near-term challenges.
The firm highlighted that corporate profit expansion remains robust. It also emphasized ongoing artificial intelligence adoption and commercialization as supportive factors for equities once conflict-related pressures diminish.
UBS noted that even with delayed policy accommodation, the Federal Reserve continues to provide broad market support.
The bank refrained from altering its constructive view on U.S. stocks. It simply recalibrated the timeline and magnitude of its price forecasts to reflect the ongoing war’s impact.
UBS currently projects two Federal Reserve rate reductions before 2026 concludes, both scheduled for the year’s second half.

Crypto World
Analysts eye potential breakdown as BTC price repeats familiar pattern: Crypto Markets Today

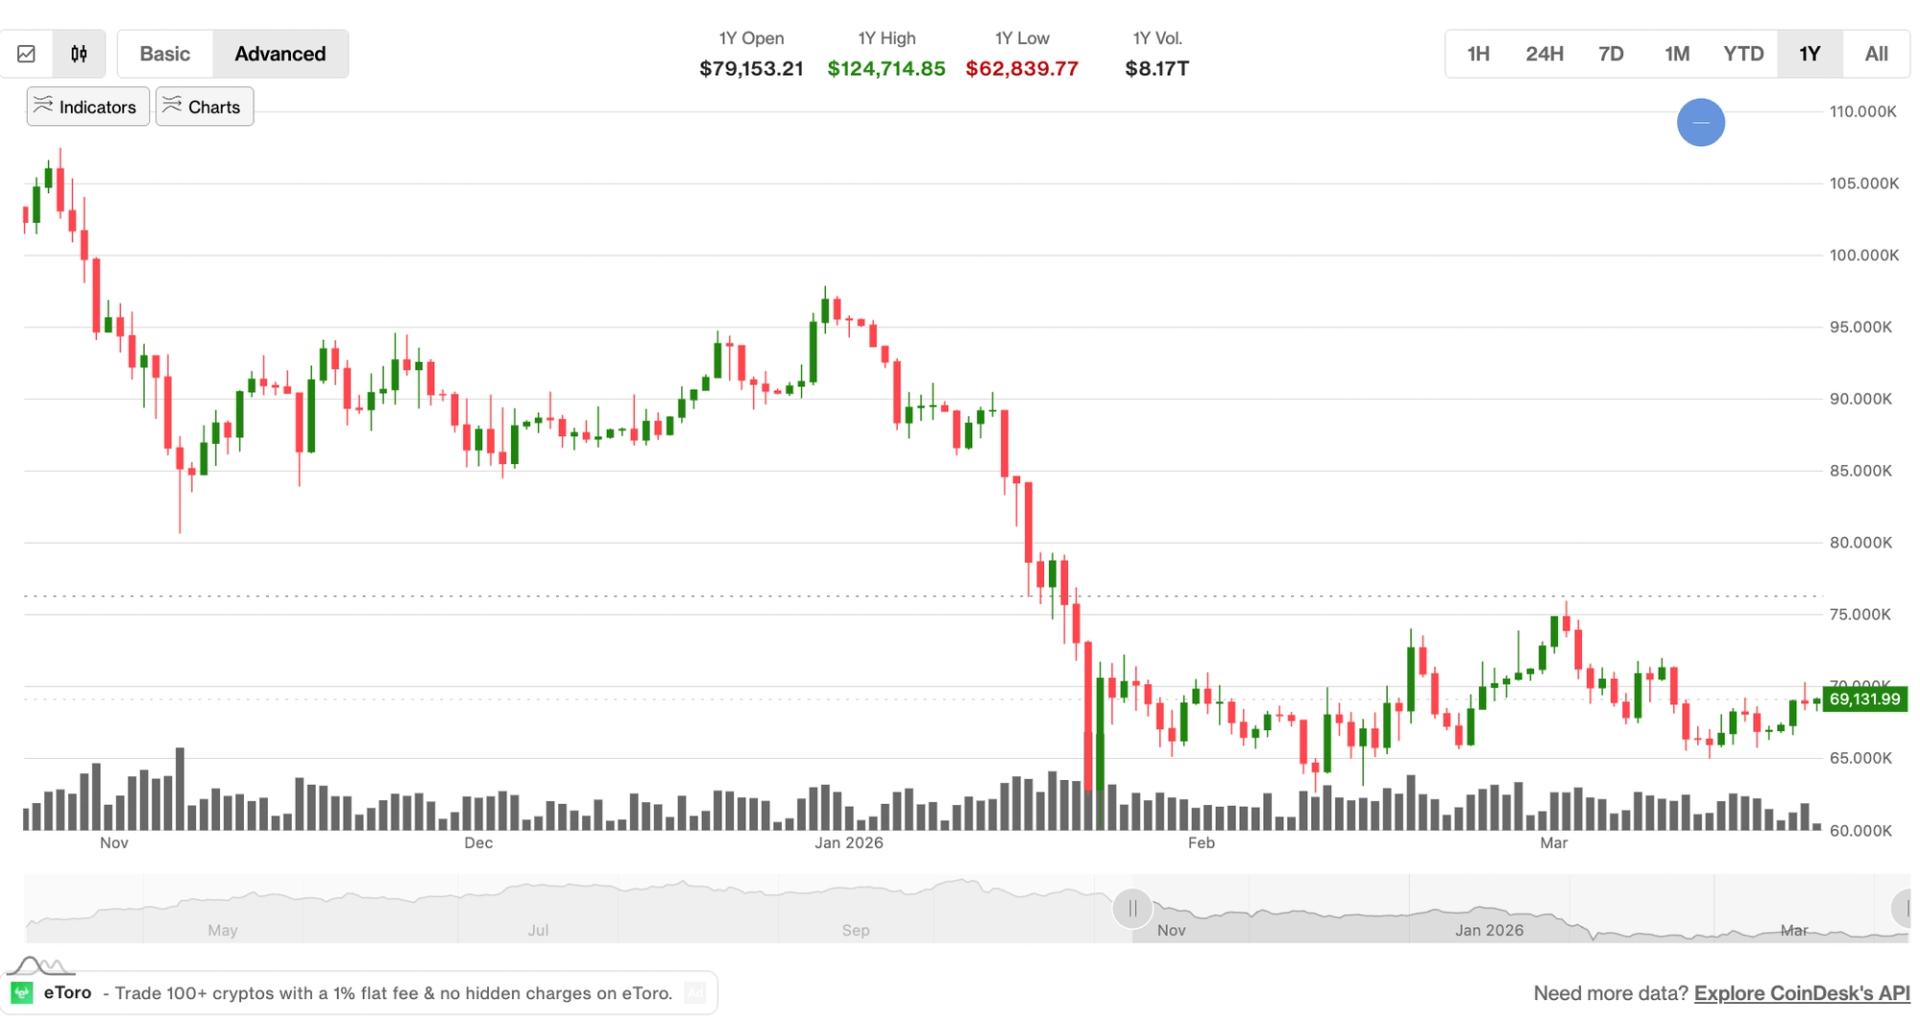
The crypto market is trading sluggishly within the range it has held for two months, with bitcoin changing hands at $69,000 and ether (ETH) at $2,130.
The range-bound pricing dates back to Feb. 6, with several peaks between $72,000 and $75,000 and troughs between $62,000 and $65,000.
A similar two-month pattern occurred between November and January before a price breakdown, leading analysts to suggest a similar scenario may play out this time around.
Much still depends on the conflict in Iran, with U.S. President Donald Trump’s threats of “obliteration” falling on deaf ears thus far. Brent crude oil remains at $107 per barrel, which will have a knock-on effect on inflation over the course of the year unless it declines.
Derivatives positioning
- The market continues to consolidate as bitcoin open interest (OI) stabilizes at $16.7 billion, little changed from last week and indicating that speculative activity remains flat.
- Funding rates have moved into a neutral 0%-6% range, following a period of negative funding that likely fueled the initial relief rally through short covering.
- With the three-month annualized basis also little changed over the week, institutional conviction remains cautious, suggesting that while the immediate downside pressure has eased, the big players are not yet positioning for a major breakout.
- Options sentiment is stabilizing as call dominance reaches 47% and one-week skew drops to 16% from 19% last week. However, the implied volatility term structure’s front-end backwardation confirms that traders are still prioritizing immediate downside protection over long-term growth expectations.
- CoinGlass data shows $163 million in 24-hour liquidations, with a 60-40 split between longs and shorts. BTC (64 million), ETH ($35 million) and others ($16 million) were the leaders in terms of notional liquidations.
- The Binance liquidation heatmap indicates $69,500 as a core level to monitor in case of a price rise.
Token talk
- The altcoin market has been surprisingly buoyant recently, despite broader market apathy. Since midnight UTC privacy tokens zcash (ZEC) and dash (DASH) rose by 6.7% and 3.1%, respectively, and there were also notable gains for FET, PUMP and RENDER.
- The bitcoin-dominant CoinDesk 20 (CD20) index gained 0.3% on Tuesday, while being outpaced by the CoinDesk Memecoin Index (CDMEME) and CoinDesk Computing Select Index (CPUS), a sign of the relative strength of altcoins compared with crypto majors.
- The recent bounce in altcoins has not been uniform, however. AI tokens, privacy tokens and the likes of HYPE and ALGO have performed well, while other market segments have tumbled. Over the past 90 days ethena (ENA) has lost 66% of its value, while TIA, LDO, SUI and ARB have all fallen by more than 50%.
- That’s a divergence from previous cycles, when altcoins moved in unison. It now appears the market is maturing to a point where assets may be moving based on real-world impact, as opposed to hype and overzealous roadmaps.

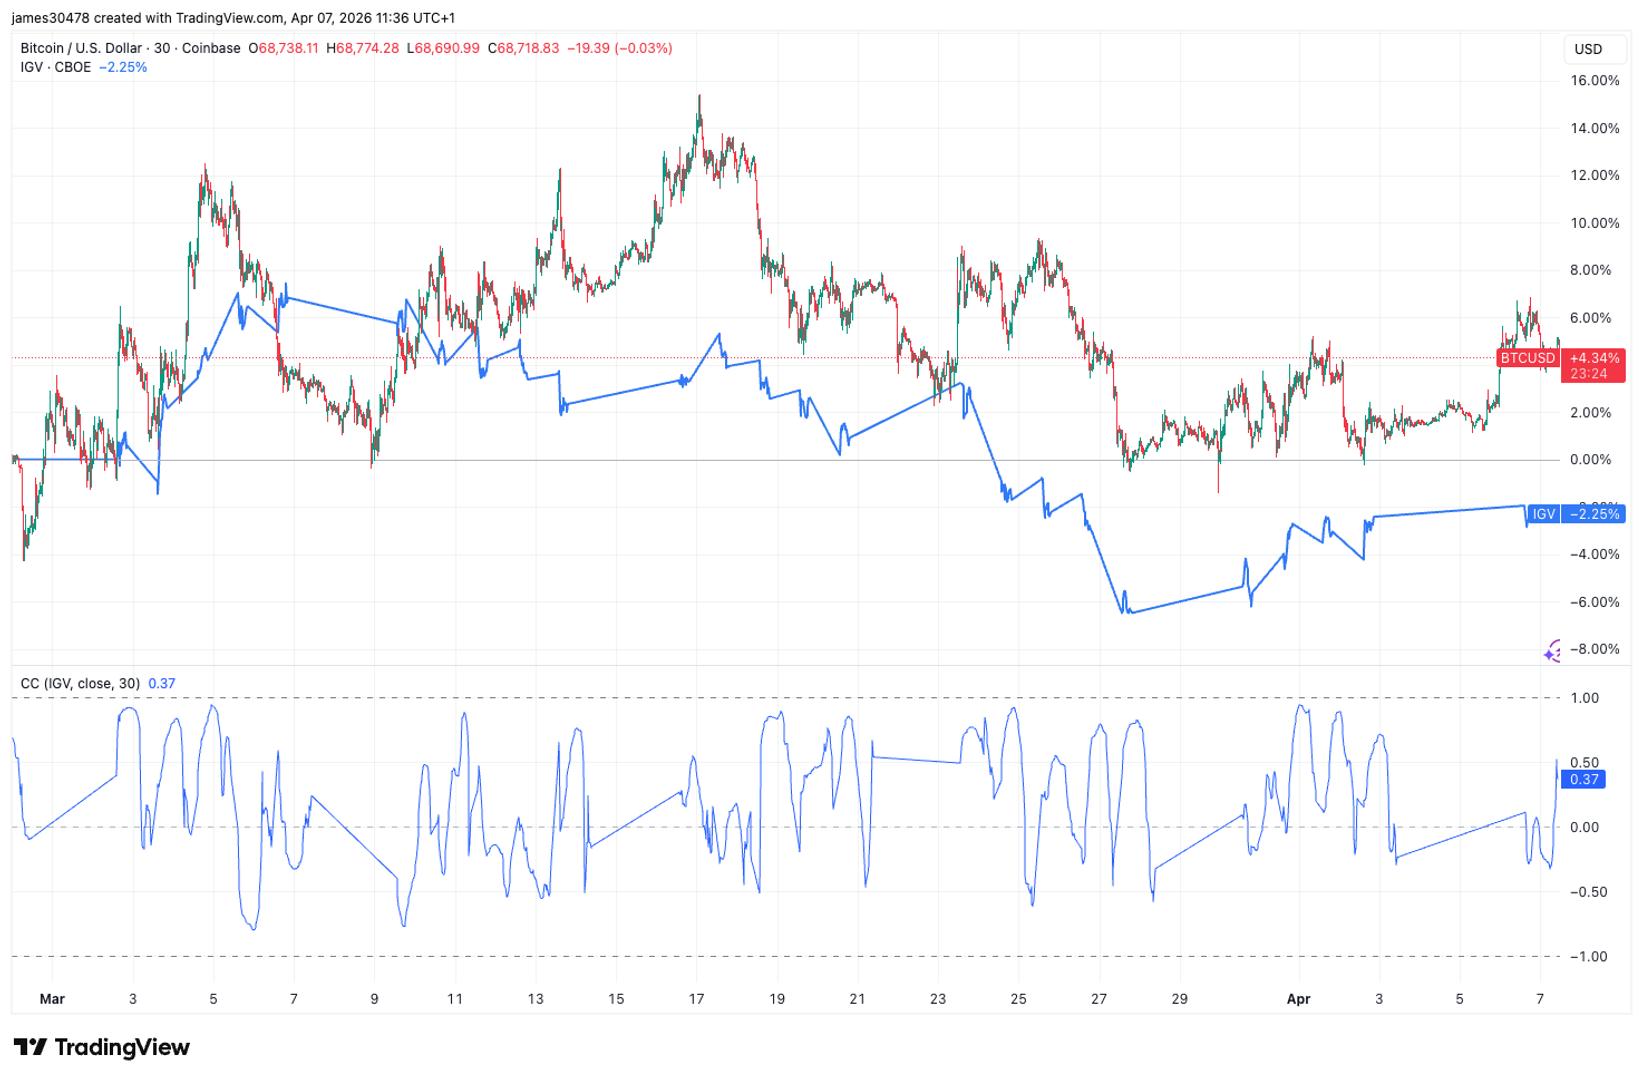
Since the outbreak of the war with Iran on Feb. 28, bitcoin has started to diverge from software equities, with the iShares Expanded Tech-Software Sector ETF (IGV), serving as a useful proxy for the sector.
Bitcoin has been one of the strongest-performing assets during this period, rising more than 5% and trading back above $69,000, including a gain of more than 0.5% over the past 24 hours.
IGV, in contrast, has fallen more than 2% since the conflict began. That gap suggests investors are starting to treat bitcoin and software stocks differently, at least in the near term.
Until recently, the two had moved closely together. Over the past three months, bitcoin fell 26% and the ETF lost 23%. Year to date, both are lower by about 21%. Over five years, bitcoin has gained 18% compared with 10% for IGV. In other words, both have moved in the same direction, but the cryptocurrency has done so with much greater volatility.
That is also clear in their declines. Bitcoin had fallen roughly 50% from its October all-time high, while IGV, which peaked slightly earlier, fell about 35% from its own top.
The correlation data tells the same story. From early February, bitcoin and IGV were almost perfectly correlated, close to 1.0, meaning they were moving nearly in lockstep. After the war began, that relationship broke down sharply, with the correlation dropping to 0.13, a level that signals near decoupling, before rebounding to around 0.7. The figure can range between -1.0 and +1.0, with 0 indicating no correlation at all.
Why have software stocks been hit harder?
IGV is heavily weighted toward large software and services companies such as Microsoft (MSFT), Oracle (ORCL) and Salesforce (CRM). Investors are increasingly worried that artificial intelligence will compress margins and valuation multiples across software, especially in Software as a Service (SaaS), as competition rises and barriers to entry fall. Bitcoin, meanwhile, is trading more like a macro asset, benefiting from geopolitical uncertainty.
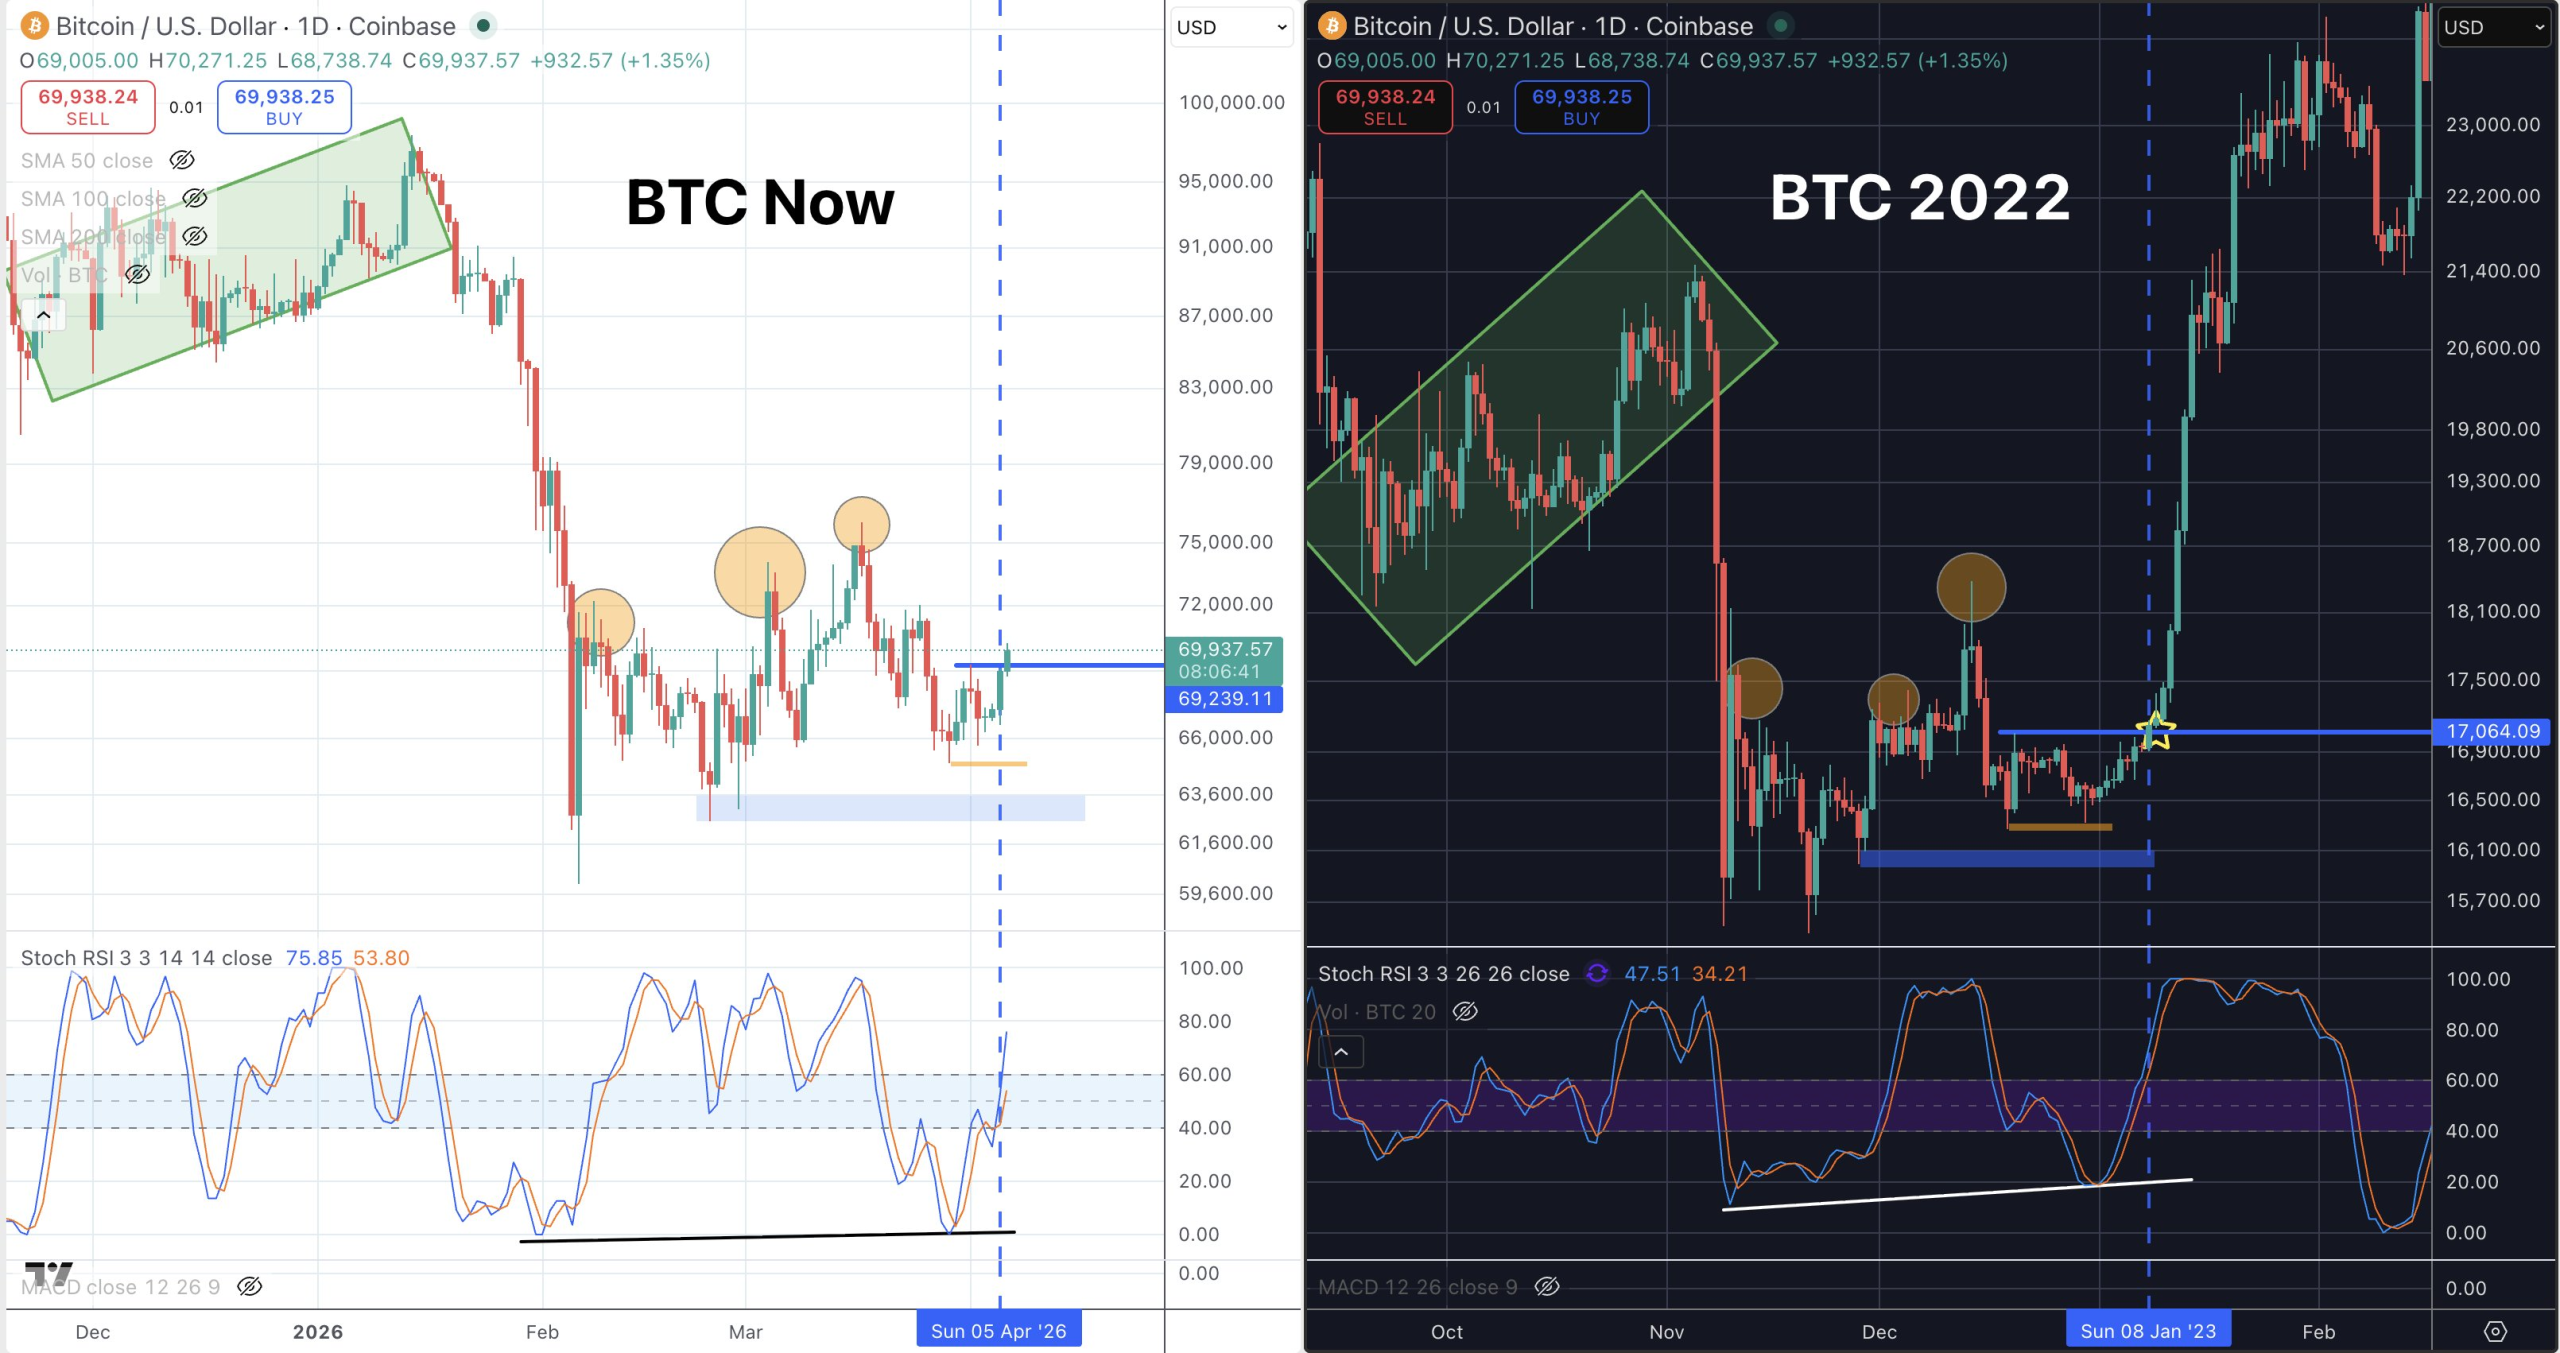
Bitcoin (BTC) is copying the end of its 2022 bear market “nearly perfectly,” according to a new BTC price analysis.
Key points:
-
Bitcoin stochastic RSI values are “nearly perfectly” repeating the end of its last bear market, new analysis claims.
-
Both recent local bottoms and the current rebound echo conditions from three years ago.
-
Standard RSI is already on the radar for a potential BTC price bottom signal.
Bitcoin stochastic RSI echoes 2023 rebound
In an X post on Monday, crypto trader Quantum Ascend revealed copycat moves playing out on Bitcoin’s stochastic relative strength index (RSI) indicator.
Stochastic RSI, also known as “stoch RSI,” is a derivative of traditional RSI — a classic leading indicator that helps traders identify overbought and oversold conditions, as well as BTC price trend changes.
Like its standard counterpart, stoch RSI flashes “oversold” price signals when it drops below 30/100 on its scale, with “overbought” entering when its value is above 70/100.
Stoch RSI moves between those two zones much more quickly, but Quantum Ascend sees a key long-term bull signal now locking in.
“RSI at the EXACT SAME point on the Daily as it was in 2022,” he told X followers.

An accompanying comparative chart shows stoch RSI making a double bottom along with price before both surged higher in early 2023. At the time, BTC/USD had recently set a multiyear low of $15,600 — a level that ended up forming the bear-market bottom.
Now, Quantum Ascend says, the repeat performance is “playing out nearly perfectly.”
“Breaking above the EXACT SAME level (blue line). At the EXACT SAME time,” he added.
The chart reveals that stoch RSI is now attempting to clear its 50/100 midpoint after two local lows in late January and late March, respectively.
BTC price counts down to bear flag decision
RSI signals have already been firing in 2026 despite lackluster BTC price strength.
Related: First real bull signal since 2025? Five things to know in Bitcoin this week
As Cointelegraph reported, eyes are on weekly standard RSI to print a bullish divergence with price, again mimicking early 2023.
I stuck to my plan religiously in the bull, and I will do the same in the bear.
As such, it’s time to start paying attention – as it looks like $BTC is forming a potential higher low on the weekly RSI.
Giving it a few more weeks to develop, given how the previous bottoms had… pic.twitter.com/nnT84R5Til
— Jelle (@CryptoJelleNL) April 7, 2026
At the time, weekly RSI set its lowest level on record — one so far not matched in 2026, per data from TradingView.

Bitcoin still faces bearish hurdles to recovery, with traders concerned about a bear-flag breakdown repeating on the daily chart.
“In few days we will understand if the pattern is repeating or not,” analyst Aksel Kibar wrote on X over the weekend.

This article is produced in accordance with Cointelegraph’s Editorial Policy and is intended for informational purposes only. It does not constitute investment advice or recommendations. All investments and trades carry risk; readers are encouraged to conduct independent research before making any decisions. Cointelegraph makes no guarantees regarding the accuracy or completeness of the information presented, including forward-looking statements, and will not be liable for any loss or damage arising from reliance on this content.

European currencies are entering a consolidation phase following an attempted recovery, while market participants adopt a wait-and-see approach amid uncertainty surrounding the geopolitical landscape. Current price action reflects a balance between a softer US dollar and a lack of sustained drivers for further gains in the euro and the pound, keeping both pairs within defined ranges.
The key factor shaping the current market structure remains developments surrounding Iran. Despite signs of moderate recovery in global markets and some easing in the dollar, US rhetoric and the absence of clear signals regarding a potential agreement continue to maintain a high level of uncertainty. Rising oil prices and risks of supply disruptions through the Strait of Hormuz continue to fuel inflation expectations and, as a result, support a cautious approach to assessing the outlook for monetary policy.
Additional uncertainty stems from statements by Donald Trump, who earlier this week once again hardened his stance on Iran, suggesting the possibility of further strikes. At the same time, diplomatic efforts to reach an agreement are ongoing, although the likelihood of a near-term resolution is seen as limited. This combination of pressure and negotiations creates a mixed news backdrop, restraining the formation of a clear directional move in the currency market while leaving room for sharp impulses in the event of escalation.
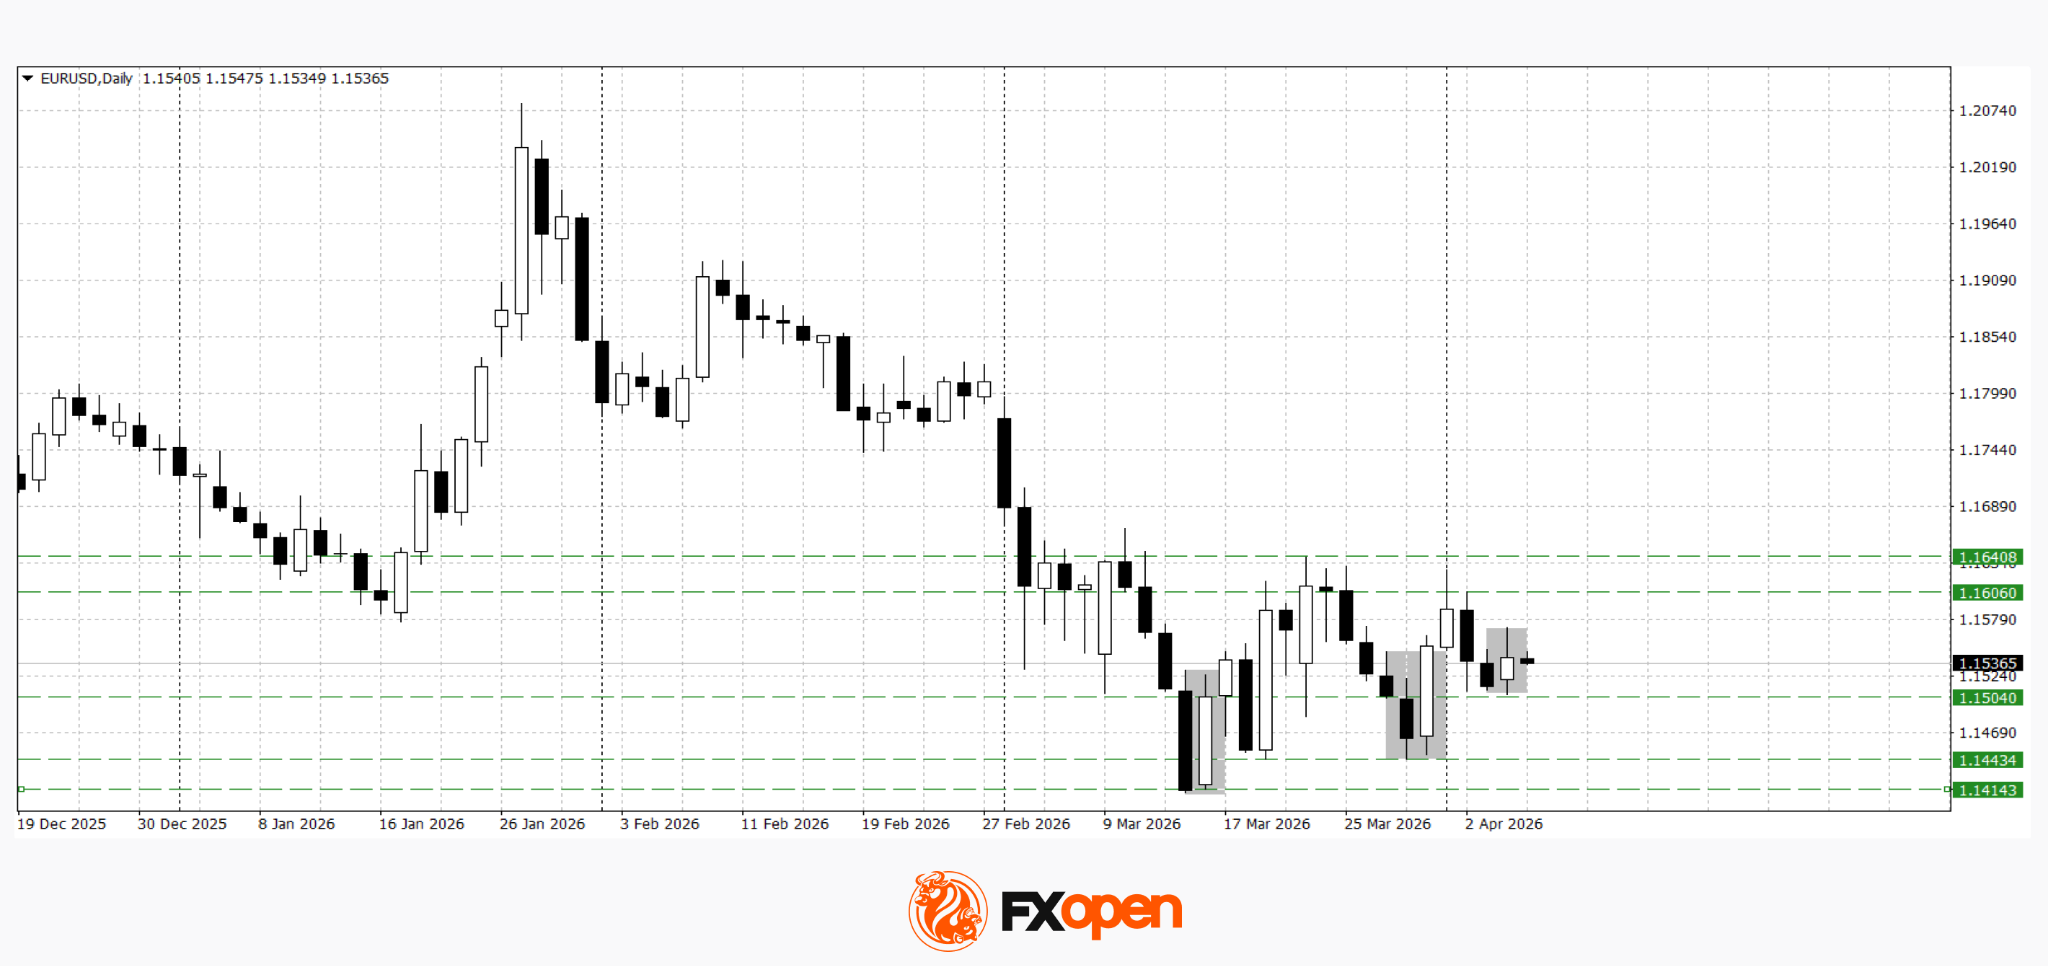
EUR/USD
EUR/USD is trading within a narrow 1.1500–1.1600 range. Technical analysis suggests a potential test of the upper boundary, as several reversal patterns have formed on the daily timeframe. A sustained move above 1.1600 could lead to gains towards 1.1640. Conversely, a break below the 1.1500 support level could open the way for a decline towards the 1.1440–1.1410 area.
Key events for EUR/USD:
- today at 10:15 (GMT+3): Spain Services PMI
- today at 10:55 (GMT+3): Germany Services PMI
- today at 15:30 (GMT+3): US core durable goods orders
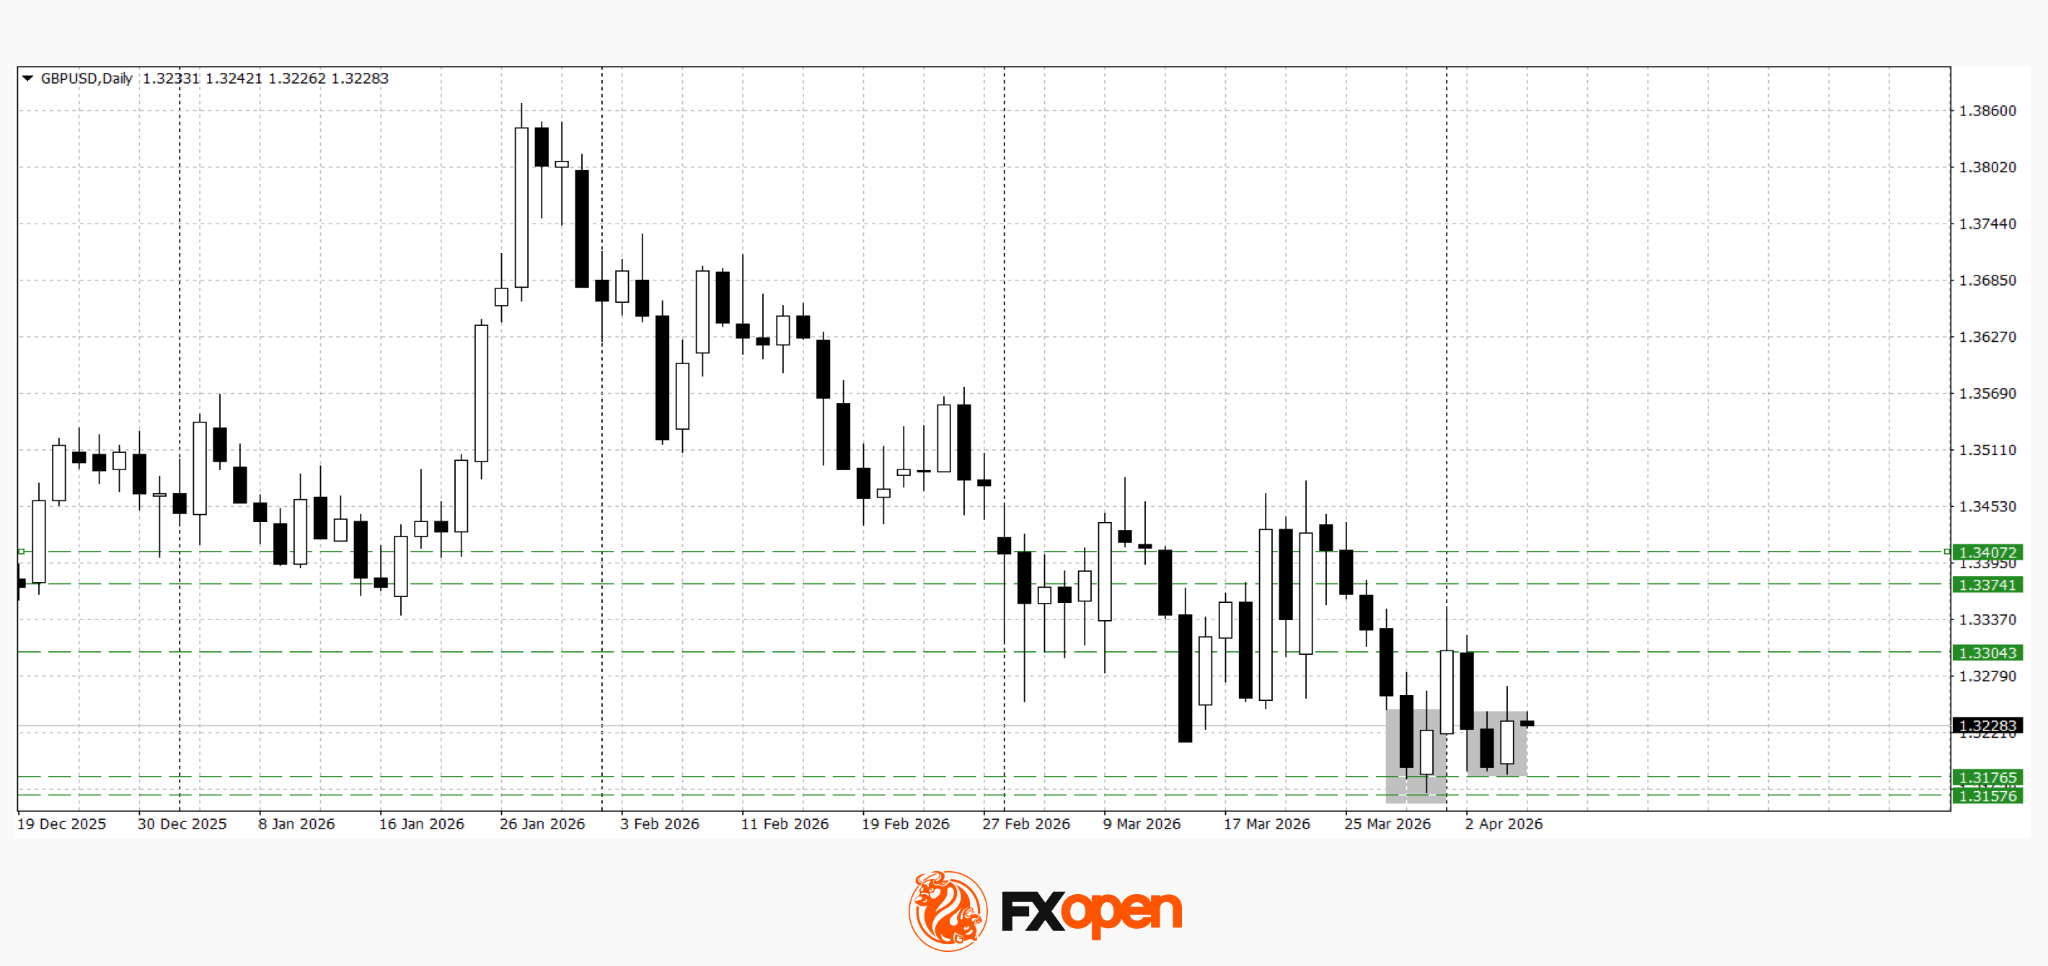
GBP/USD
GBP/USD is showing a similar pattern, remaining within a sideways range after a corrective rebound. A firm break above 1.3300 could pave the way for further gains towards 1.3370–1.3400. On the downside, a rejection from current levels may result in a retest of recent lows near 1.3150.
Key events for GBP/USD:
- today at 11:30 (GMT+3): UK Composite PMI
- today at 11:30 (GMT+3): UK Services PMI
- today at 17:00 (GMT+3): Atlanta Fed GDPNow
Overall, the market retains a consolidative tone, awaiting both geopolitical developments and macroeconomic signals. A breakout from the current range could be triggered by news related to negotiations involving Iran or by key economic data releases, highlighting the transitional nature of the current market phase.
Trade over 50 forex markets 24 hours a day with FXOpen. Take advantage of low commissions, deep liquidity, and spreads from 0.0 pips (additional fees may apply). Open your FXOpen account now or learn more about trading forex with FXOpen.
This article represents the opinion of the Companies operating under the FXOpen brand only. It is not to be construed as an offer, solicitation, or recommendation with respect to products and services provided by the Companies operating under the FXOpen brand, nor is it to be considered financial advice.

- XRP price dropped to near $1.30 on Tuesday, April 7, 2027.
- Santiment data showed holder returns have dipped by 41% over the past year.
- Bulls need to reclaim $1.35, but sellers may be eyeing $1.10.
XRP faces fresh downside pressure amid an intraday dip to near $1.30, with the overall picture exacerbated by the broader cryptocurrency market weakness.
Notably, the Ripple-linked token’s slide comes as on-chain metrics reveal stark underperformance for holders, with average returns plummeting 41% over the past year.
Analysts say that while the surge in underwater wallets signals potential capitulation, it echoes past market patterns that have ended with a sharp bounce.
XRP Ledger returns down 41%
Data from analytics platform Santiment has noted that wallets active on the XRP Ledger have slipped into significant loss over the past 12 months.
XRP holders are nursing an average loss of -41% on their investments, the firm posted on X.
The average loss marks one of the most severe drawdowns in active recent history.
This figure stems from the MVRV (Market Value to Realized Value) ratio, a key indicator that compares current market prices to the average cost basis of holders.
Santiment’s on-chain analysis shows XRP’s MVRV hitting its lowest level since the FTX collapse in November 2022, when the exchange’s implosion triggered widespread panic selling across crypto markets.
Back then, XRP’s MVRV plunged into deeply negative territory, reflecting widespread unrealized losses as traders offloaded positions at fire-sale prices.
Today’s reading mirrors that despair, with the metric signaling that the average XRP holder is far underwater.
XRP price outlook
This 41% dip in returns highlights that a growing number of wallets are unprofitable, which means pressure on short-term traders.
XRP is now changing hands near $1.32, slightly up on the day after the latest altcoin dip. However, daily trading volume, down 14% to around $1.6 billion, suggests prevailing weakness.
The failed breakout above $1.40 earlier this week injected fresh jitters, leaving sellers in control.
On the technical charts, XRP struggles below the 50-day exponential moving average. The RSI indicates fresh losses towards oversold conditions.
However, such a scenario could spark a rebound.

A decisive uptick above $1.35 might embolden bulls to target higher resistance at $1.50, with 200-day EMA above $1.80.
Santiment shared their take via X:
“Because cryptocurrencies are zero-sum trading games, significantly negative average returns (not just a price drop, but actual trader returns) imply that there is much lower risk than average in buying or adding on to your $XRP positions, due to the fact that competing traders are already in severe ‘blood in the streets’ territory.”
If price swings below $1.30 will mean buyers risk a deeper correction toward $1.10.
Ethereum price retraced some of its gains from Monday after U.S. President Donald Trump brushed off an Iranian proposal to end the war and warned that strikes would target key infrastructure if Tehran fails to reopen the Strait of Hormuz by the deadline.
Summary
- Ethereum price fell 3.4% below $2,100 as Trump rejected Iran’s proposal and warned of strikes if the Strait of Hormuz is not reopened.
- Risk sentiment weakened across crypto and equities, with Asian markets flat to lower and investors pulling capital amid geopolitical uncertainty.
- A confirmed breakdown below $2,000 could trigger a double top pattern and liquidations of up to $1.41B in long positions.
According to data from crypto.news, Ethereum (ETH) price fell 3.4% below the $2,100 support after reports emerged that Trump will not call off the strikes at Iranian infrastructure unless Tehran commits to reopening the Strait of Hormuz, a key maritime corridor that handles 20% of all the global oil trade. This came after the U.S. President dismissed a proposal from the Iranian leadership to end the war while keeping the Strait closed.
Fears of a very aggressive strike on Iran are likely causing investors to withdraw capital as they await the conclusion of this geopolitical standoff. Investors are withdrawing from both crypto and traditionally safe-haven assets such as gold and silver, a sign of broader derisking across global markets as uncertainty intensifies.
Asian tech stocks such as Japan’s Nikkei 225, Hong Kong’s Hang Seng, and the Shanghai Composite all remained either still or dropped as uncertainty weighed on the region.
Besides these factors lowering risk sentiment, retail investors are also likely panicking as they potentially face liquidation of $1.41 billion worth of long positions being erased from the market should Ethereum price slide further down to $2,040.
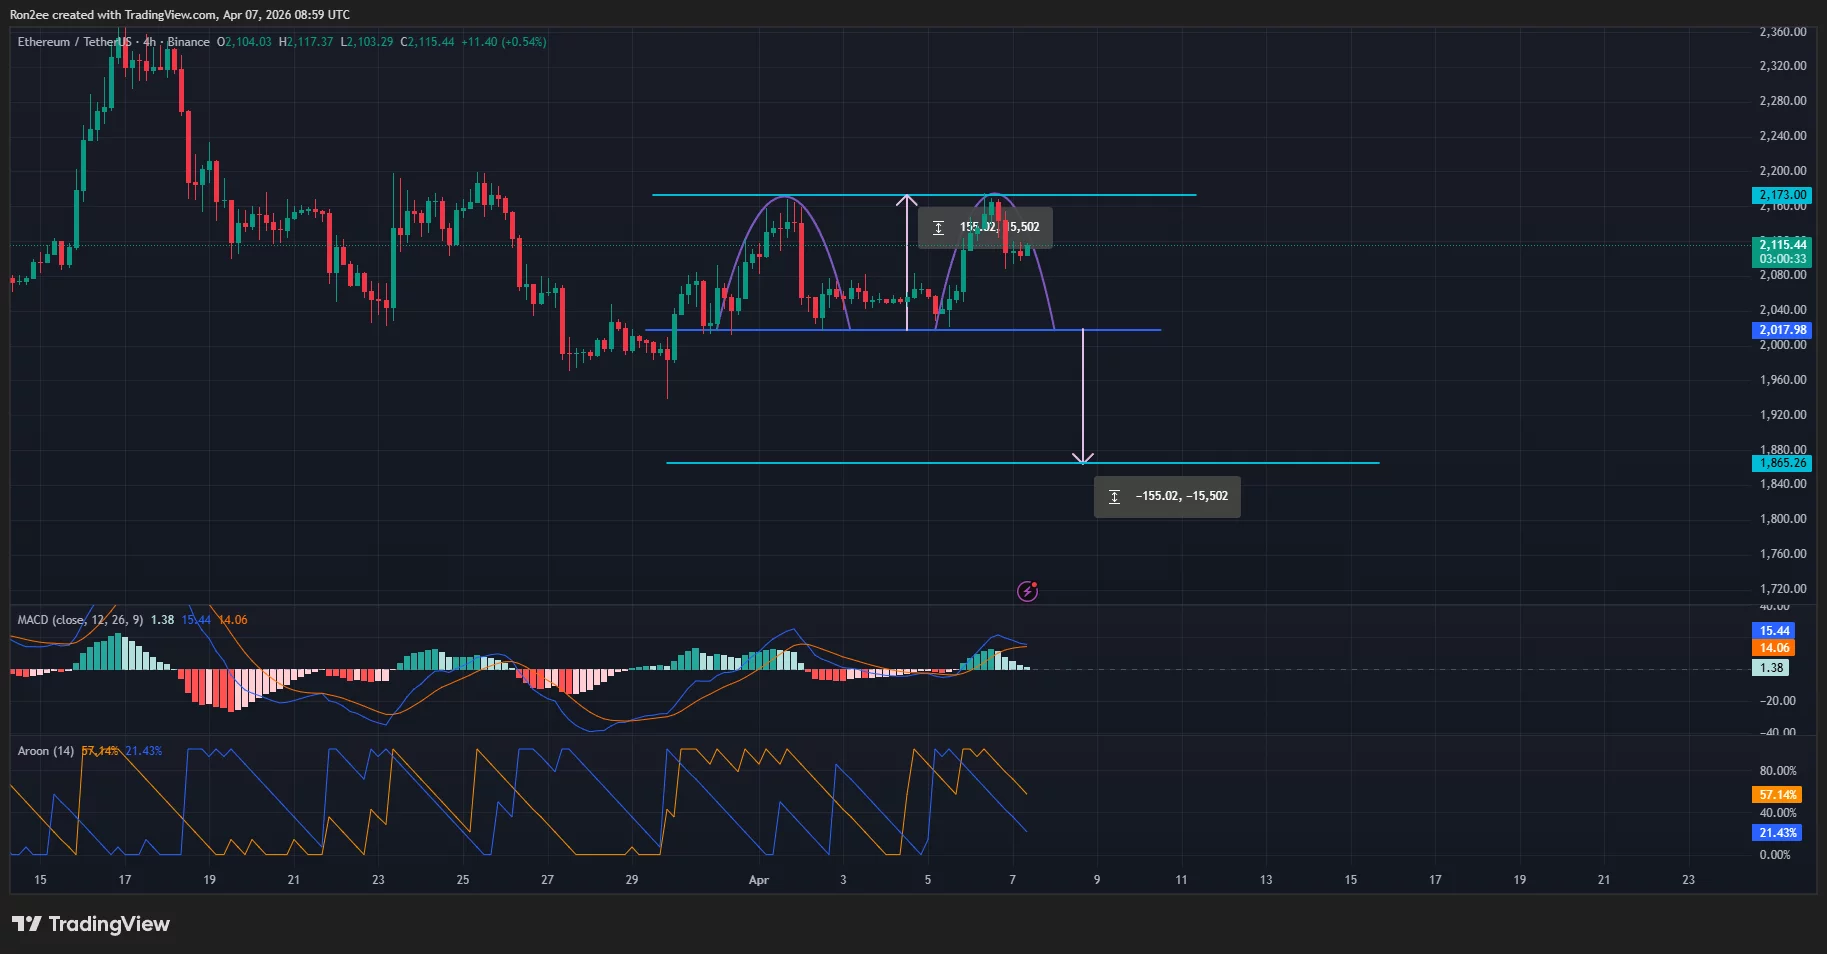
On the daily chart, Ethereum price has been forming a double top pattern on the 4-hour chart. Double top patterns are some of the most common bearish signals in technical analysis. The neckline of the pattern lies at around $2,017.

If Ethereum price falls below the $2,000 support, it would confirm the double top pattern and will continue to drop lower to under $1,900 as calculated by subtracting the height of the double tops formed from the point at which the neckline stands.
Technical indicators show that bears are starting to take control. Notably, the Aroon Up and Down lines have pointed sharply downwards, suggesting a strong downtrend. The MACD lines are close to forming a bearish crossover, a sign that selling pressure is mounting.
For now, the immediate support level that decides the trend lies at $2,000. Failure to hold this level would confirm both the double top pattern and the long liquidation cascade.
Disclosure: This article does not represent investment advice. The content and materials featured on this page are for educational purposes only.
Nvidia’s chip production is concentrated with Taiwanese contractor TSMC, increasing the company’s exposure to geopolitical risks and US export policy. Restrictions on shipments to China, including decisions related to H20-series chips, have led to significant financial adjustments, which the market estimates at several billion dollars, linked to inventory and expected demand.
At the same time, the revenue structure remains resilient — around 69% of income is generated in the US domestic market, where hyperscalers continue to expand purchases of data centre accelerators. In the fourth quarter of fiscal 2026, revenue reached $68.1 billion, marking a 73% year-on-year increase, while full-year revenue totalled $215.9 billion (+65%).
In late March, the company announced an expansion of its strategic partnership with Marvell Technology, including a $2 billion investment and integration via the NVLink Fusion ecosystem, strengthening its position in the physical AI and robotics segments. At the same time, the broader macro backdrop remains subdued.

Technical Outlook
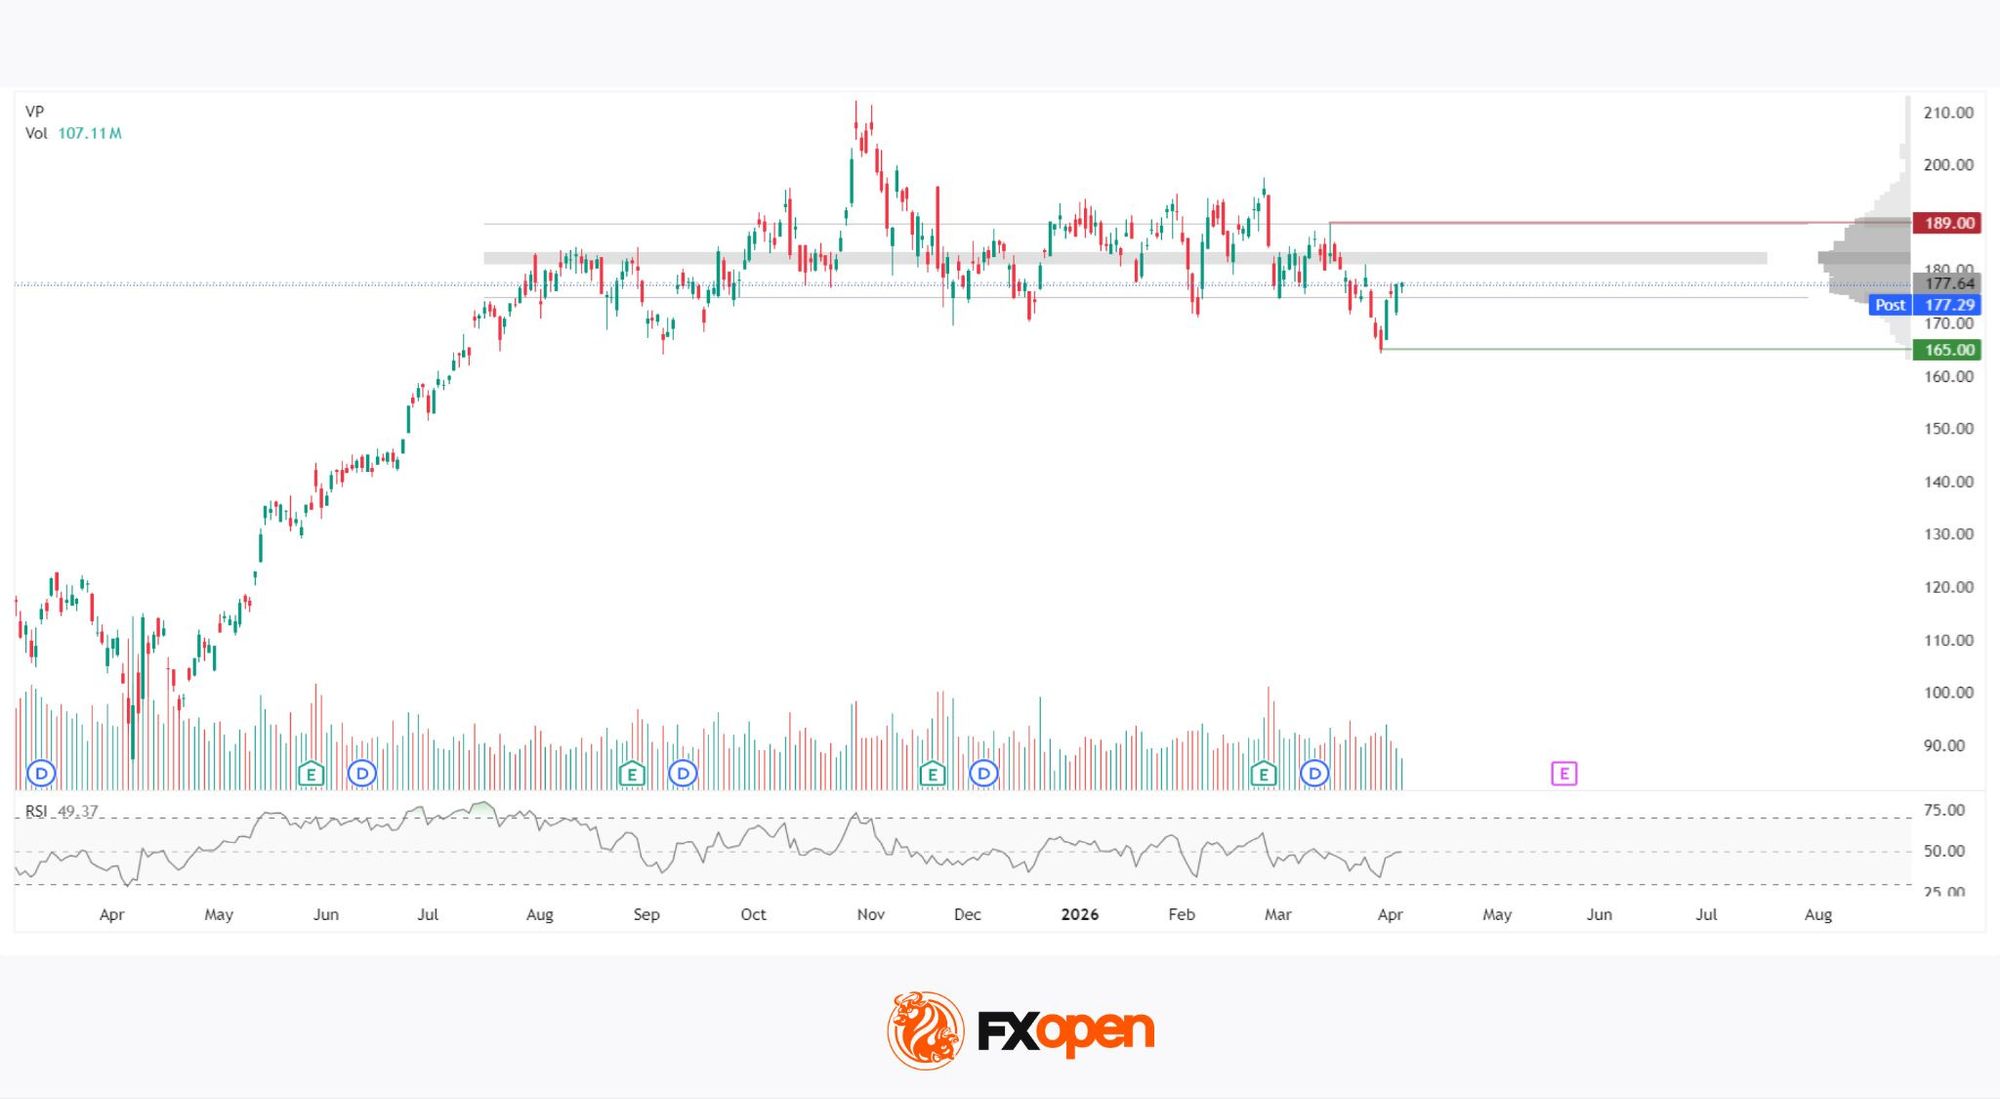
After reaching an all-time high near 210 in late October 2025, the stock entered a corrective downtrend. The correction bottomed at 165 on 30 March 2026, followed by a rebound, although prices remain around 177, showing no clear signs of a sustained recovery. The volume profile adds further clarity.
The highest concentration of trading activity during the observed period is located in the 181–183 range, where the Point of Control (POC) is positioned — this is the level where market participants were most active over several months, making it a key reference zone. Above current levels, the volume profile remains dense up to 189, which aligns with local highs from the second half of 2025 and acts as the nearest resistance.
The RSI stands at 49.37, remaining in neutral territory and offering no clear directional bias. The latest session’s volume, at 107.11 million, indicates continued market participation. However, it is worth noting that the most pronounced spikes in volume and volatility typically occur around earnings releases — and with the next report scheduled for May 2026, the stock may continue to consolidate within the current range.
Summary
NVIDIA remains in a prolonged consolidation phase, supported by strong operational performance but weighed by a subdued macro environment. The volume profile highlights significant activity above current price levels, while RSI remains neutral. Market participants appear to be assessing incoming signals without rushing to conclusions.
Buy and sell stocks of the world’s biggest publicly-listed companies with CFDs on FXOpen’s trading platform. Open your FXOpen account now or learn more about trading share CFDs with FXOpen.
This article represents the opinion of the Companies operating under the FXOpen brand only. It is not to be construed as an offer, solicitation, or recommendation with respect to products and services provided by the Companies operating under the FXOpen brand, nor is it to be considered financial advice.


Anthropic has struck a major infrastructure deal with Google and Broadcom to secure multi-gigawatt computing capacity, as demand for its Claude AI models continues to climb.
Summary
- Anthropic has secured access to roughly 3.5 gigawatts of TPU compute through an expanded partnership with Google and Broadcom.
- Most of the new infrastructure will be built in the United States.
- The AI firm’s Annualized revenue has surpassed $30 billion.
Details disclosed in a recent securities filing show the semiconductor firm will support future iterations of Google’s tensor processing units, with part of that capacity allocated to Anthropic. The arrangement is expected to unlock roughly 3.5 gigawatts of compute, with deployments set to begin scaling from 2027.
Anthropic said its annualized revenue has now crossed $30 billion, up sharply from around $9 billion at the end of last year. The company also reported that more than 1,000 enterprise customers are each spending over $1 million annually, a figure that has doubled within weeks.
“We are making our most significant compute commitment to date to keep pace with our unprecedented growth,” Anthropic’s chief financial officer Krishna Rao said, adding that the partnership would “build the capacity necessary to serve the exponential growth we have seen in our customer base.”
Most of the new infrastructure will be based in the United States, extending an earlier pledge to invest $50 billion into domestic compute capacity. The expansion also builds on Anthropic’s existing relationships with Google Cloud and Broadcom, following earlier TPU capacity announcements.
From Broadcom’s side, the deal adds to a growing pipeline of AI-linked revenue. CEO Hock Tan had previously confirmed that the company was already supplying around 1 gigawatt of compute for Anthropic through Google’s TPU systems, with demand expected to climb past 3 gigawatts in 2027.
For Broadcom, the latest deal adds to a quickly growing list of AI infrastructure partnerships. During the company’s March earnings call, Broadcom CEO Hock Tan said it was already supplying roughly 1 gigawatt of compute for Anthropic and added that this was expected to surpass 3 gigawatts by 2027.
Wall Street estimates suggest the partnership could translate into significant earnings. Analysts at Mizuho have projected that Broadcom may generate about $21 billion in AI-related revenue from Anthropic in 2026, potentially doubling to $42 billion the following year.
At the same time, competition across AI infrastructure remains intense. AI developers, including Anthropic and its peers, continue to rely on a mix of hardware platforms, including Nvidia GPUs, Google TPUs, and custom chips.
Broadcom is also working with OpenAI on separate silicon efforts, while cloud providers such as Amazon, Google, and Microsoft remain central to delivering that compute at scale.
Anthropic noted that its Claude models are now deployed across all three major cloud ecosystems, allowing workloads to be distributed depending on performance needs.

Five ways to turn eco-anxiety into something positive

Oil price tops $111 a barrel as Iran talks stall ahead of Trump deadline

Bitcoin ETF Inflows Jump to $471M, Largest Since Late February


-

 NewsBeat5 days ago
Steven Gerrard disagrees with Gary Neville over ‘shock’ Chelsea and Arsenal claim | Football
-

 Business4 days ago
No Jackpot Winner and $194 Million Prize Rolls Over
-

 Fashion4 days ago
Weekend Open Thread: Spanx – Corporette.com
-

 Crypto World6 days ago
Gold Price Prediction: Worst Month in 17 Years fo Save Haven Rock
-

 Business1 day ago
Three Gulf funds agree to back Paramount’s $81 billion takeover of Warner, WSJ reports
-
Crypto World7 days ago
Dems press CFTC, ethics board on prediction-market insider trades
-

 Sports3 days ago
India men’s 4x400m and mixed 4x100m relay teams register big progress | Other Sports News
-

 Business3 days ago
Expert Picks for Every Need
-

 Business5 days ago
Login and Checkout Issues Spark Merchant Frustration
-

 Sports7 days ago
Tallest college basketball player ever, standing at 7-foot-9, entering transfer portal
-

 Crypto World7 days ago
Bitcoin enters the public bond market as Moody’s gives a first-of-its-kind crypto deal a rating
-
Crypto World6 days ago
Bitcoin stalls below key resistance as technical signals skew bearish
-

 Tech5 days ago
Commonwealth Fusion Systems leans on magnets for near-term revenue
-

 Politics6 days ago
Starmer’s centre has collapsed, and the left was right all along
-
Business2 days ago
No Jackpot Winner, Prize to Climb to $231 Million
-

 Fashion7 days ago
Zara Turns Up the Heat With New Swimwear
-

 Fashion7 days ago
Tuesday’s Workwear Report: Tavira Sculpt Stretch Crepe Trousers
-
Crypto World7 days ago
AI Memory Rout Wipes 9% Off Nvidia Stock: Chart Says More Pain Ahead
-

 Crypto World6 days ago
Why It’s Partnering, Not Issuing
-

 Fashion7 days ago
Margot Robbie Makes Chanel Lipstick Look Effortless
You must be logged in to post a comment Login